

Key Insights
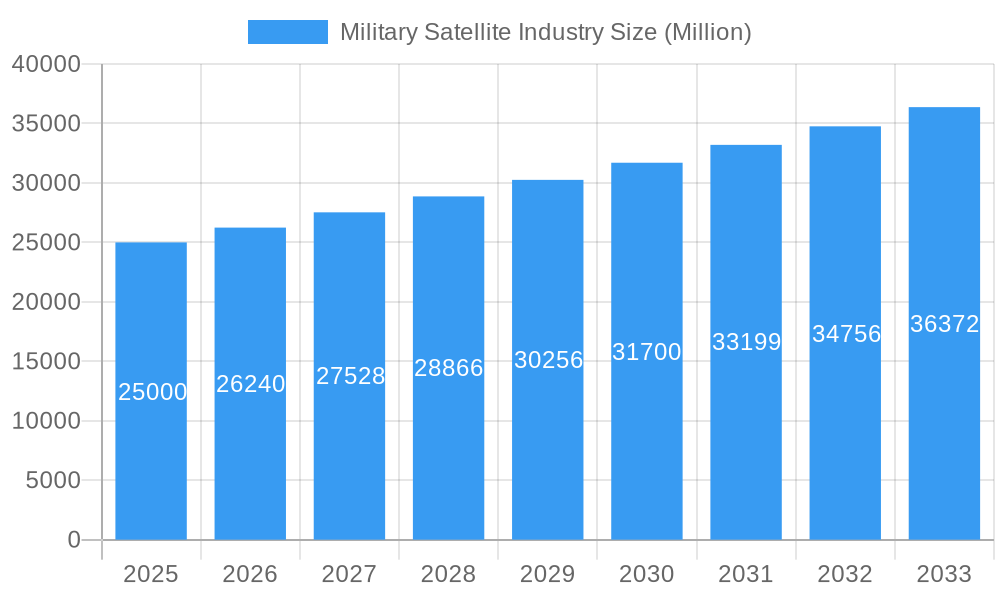
The global military satellite market is projected for significant expansion, with an estimated current market size of $36 billion. The market is expected to grow at a Compound Annual Growth Rate (CAGR) of 10% from the base year 2025 through 2033. This growth is attributed to escalating geopolitical tensions and the increasing demand for advanced surveillance, reconnaissance, and communication capabilities. Innovations in satellite miniaturization, propulsion systems, and data processing are enhancing cost-effectiveness and deployment versatility, thereby driving market growth. Emerging trends, including the development of small satellite constellations for comprehensive coverage and the integration of AI for sophisticated data analysis, are shaping the future landscape. Key market restraints include substantial technological hurdles in ensuring system reliability and resilience, coupled with the significant capital investment required for satellite development and launch. The market is segmented by satellite mass, orbit class (GEO, LEO, MEO), subsystem (propulsion, bus, power, etc.), and application (communication, earth observation, navigation). Communication and earth observation satellites, typically within the 100-500kg mass range and operating in LEO, are anticipated to dominate key segments.
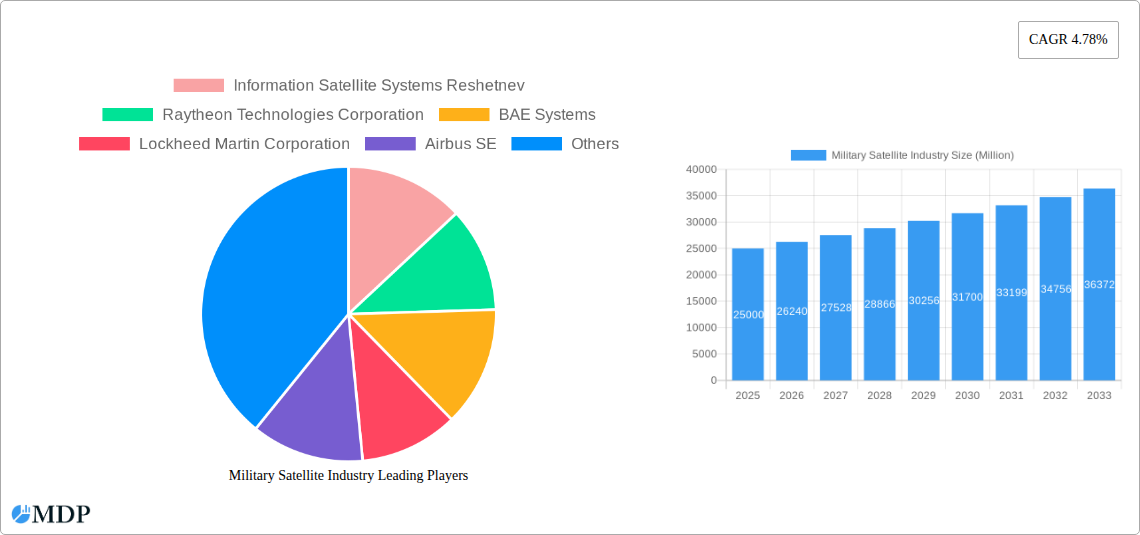
Military Satellite Industry Market Size (In Billion)
The military satellite industry features a competitive environment with major established aerospace corporations such as Lockheed Martin, Raytheon, Airbus, and BAE Systems, alongside specialized emerging firms. Government space agencies including ISRO, ROSCOSMOS, and CASC also play a crucial role, highlighting the strategic importance of this sector. The forecast period of 2025-2033 presents substantial opportunities for companies capable of delivering innovative, high-performance, and cost-efficient satellite solutions to meet the evolving requirements of global military and intelligence organizations. Continued growth is anticipated, driven by technological advancements and rising worldwide demand. However, market participants must address challenges related to cost, reliability, and the complexities of space operations to fully leverage this expanding market.
Military Satellite Industry Company Market Share
Military Satellite Industry: A Comprehensive Market Report (2019-2033)
This in-depth report provides a comprehensive analysis of the Military Satellite Industry, encompassing market dynamics, leading players, technological advancements, and future growth projections. The study period covers 2019-2033, with a base year of 2025 and a forecast period of 2025-2033. This report is invaluable for industry stakeholders, investors, and anyone seeking a clear understanding of this rapidly evolving sector. The market is expected to reach xx Million by 2033, exhibiting a CAGR of xx% during the forecast period.
Military Satellite Industry Market Dynamics & Concentration
The Military Satellite Industry is characterized by a moderately concentrated market, with a few major players holding significant market share. The market is driven by increasing defense budgets globally, advancements in satellite technology, and the growing demand for enhanced surveillance, communication, and navigation capabilities. Stringent regulatory frameworks and export controls influence market dynamics. Product substitutes, while limited, include alternative communication and surveillance systems. End-user trends favor miniaturization, increased reliability, and cost-effectiveness. M&A activity has been relatively moderate in recent years, with xx major deals recorded between 2019 and 2024, resulting in an estimated xx% market share consolidation among the top players.
- Market Concentration: High, with the top 5 players accounting for approximately xx% of the market share in 2024.
- Innovation Drivers: Miniaturization, AI integration, improved communication capabilities, enhanced resilience against cyber threats.
- Regulatory Frameworks: Stringent export controls and licensing requirements vary significantly by country.
- M&A Activity: An average of xx major M&A deals per year during 2019-2024.
- Product Substitutes: Limited, but emerging technologies like high-altitude drones and advanced terrestrial networks pose potential competition.
- End-User Trends: Increasing demand for smaller, more agile, and cost-effective satellite systems.
Military Satellite Industry Industry Trends & Analysis
The Military Satellite Industry is experiencing robust growth fueled by several key factors. Technological advancements, such as the development of smaller, more affordable satellites, are driving market expansion. The rising adoption of advanced technologies like AI and machine learning for improved data analysis and autonomous operations is also contributing to growth. The increasing demand for secure communication networks for military applications further fuels market expansion. Competitive dynamics are characterized by intense rivalry among major players focusing on technological innovation, partnerships, and government contracts. The market is segmented by satellite mass, orbit class, subsystem, and application. The market is witnessing increased penetration of LEO constellations for various applications, including communication, earth observation, and navigation.
- Market Growth Drivers: Increasing defense budgets, technological advancements, growing demand for enhanced surveillance, communication, and navigation.
- Technological Disruptions: Miniaturization of satellites, AI integration, improved sensor technology, and quantum communication technologies.
- Consumer Preferences: Demand for increased reliability, improved data throughput, reduced latency, and enhanced cybersecurity.
- Competitive Dynamics: Intense competition among leading players, focused on innovation, strategic partnerships, and securing government contracts.
Leading Markets & Segments in Military Satellite Industry
The North American region dominates the Military Satellite Industry, driven by robust defense spending and technological innovation. Within the segment breakdown, the LEO (Low Earth Orbit) segment is experiencing significant growth due to the increasing deployment of constellations for various applications. The 10-100kg satellite mass segment holds the largest market share due to cost-effectiveness and ease of deployment. Communication and Earth Observation applications are the most prominent, driven by the need for secure communication channels and enhanced situational awareness.
- Dominant Region: North America
- Key Drivers: High defense spending, technological innovation, and strong governmental support.
- Dominant Segment (Satellite Mass): 10-100kg
- Key Drivers: Cost-effectiveness, ease of deployment, and growing demand for small satellites.
- Dominant Segment (Orbit Class): LEO
- Key Drivers: Reduced latency, improved coverage, and suitability for various applications.
- Dominant Segment (Application): Communication and Earth Observation
- Key Drivers: The crucial need for secure communication networks and timely, accurate intelligence gathering.
Military Satellite Industry Product Developments
Recent product innovations include the development of smaller, more agile satellites with advanced capabilities, improved sensors, and enhanced data processing capacity. These advancements are driven by the demand for cost-effective, easily deployable, and highly reliable military satellite systems. The integration of artificial intelligence and machine learning is enhancing the capabilities of these systems, providing improved situational awareness and autonomous decision-making capabilities. These innovations enhance the competitive advantages of manufacturers by providing superior performance, reliability, and cost-effectiveness.
Key Drivers of Military Satellite Industry Growth
Technological advancements like miniaturization, AI integration, and improved propulsion systems are driving growth. Increased defense budgets globally are funding the development and deployment of advanced military satellite systems. Favorable government policies and regulations are fostering innovation and market expansion. Examples include the US Space Force's investment in space-based missile tracking systems and various national space programs globally.
Challenges in the Military Satellite Industry Market
Regulatory hurdles, particularly concerning licensing and export controls, hinder growth. Supply chain disruptions impacting the availability of key components pose significant challenges. Intense competition and the high cost of development and deployment limit market entry for smaller companies. These challenges contribute to an estimated xx Million loss annually in potential revenue for the industry.
Emerging Opportunities in Military Satellite Industry
The integration of quantum communication technologies promises significant advancements in secure communication. Strategic partnerships between government agencies and private companies are accelerating innovation and expanding market reach. The development of reusable launch vehicles is driving down launch costs and making satellite deployment more affordable. These factors suggest a potential market expansion of xx Million in the next 5 years.
Leading Players in the Military Satellite Industry Sector
Key Milestones in Military Satellite Industry Industry
- February 2023: Blue Canyon Technologies LLC (Raytheon Technologies subsidiary) provided hardware for 114 small payloads on Transporter-6, highlighting the growth of the smallsat market.
- February 2023: Blue Canyon Technologies LLC (Raytheon Technologies subsidiary) provided critical hardware components for several of the smallsat missions aboard the Transporter-6 launch, which pitched 114 small payloads into polar orbit. This underscores the growing importance of small satellite technology.
- January 2023: Raytheon Intelligence & Space awarded a contract to develop a prototype missile tracking system for the US Space Force, indicating a focus on advanced space-based surveillance.
Strategic Outlook for Military Satellite Industry Market
The Military Satellite Industry is poised for sustained growth, driven by technological advancements, increased defense spending, and the expanding applications of satellite technology. Strategic partnerships and investments in research and development will be crucial for maintaining competitiveness and capturing a larger market share. The focus on miniaturization, enhanced data processing capabilities, and AI integration will shape the industry’s future, promising a market worth xx Million by 2033.
Military Satellite Industry Segmentation
-
1. Satellite Mass
- 1.1. 10-100kg
- 1.2. 100-500kg
- 1.3. 500-1000kg
- 1.4. Below 10 Kg
- 1.5. above 1000kg
-
2. Orbit Class
- 2.1. GEO
- 2.2. LEO
- 2.3. MEO
-
3. Satellite Subsystem
- 3.1. Propulsion Hardware and Propellant
- 3.2. Satellite Bus & Subsystems
- 3.3. Solar Array & Power Hardware
- 3.4. Structures, Harness & Mechanisms
-
4. Application
- 4.1. Communication
- 4.2. Earth Observation
- 4.3. Navigation
- 4.4. Space Observation
- 4.5. Others
Military Satellite Industry Segmentation By Geography
-
1. North America
- 1.1. United States
- 1.2. Canada
- 1.3. Mexico
-
2. South America
- 2.1. Brazil
- 2.2. Argentina
- 2.3. Rest of South America
-
3. Europe
- 3.1. United Kingdom
- 3.2. Germany
- 3.3. France
- 3.4. Italy
- 3.5. Spain
- 3.6. Russia
- 3.7. Benelux
- 3.8. Nordics
- 3.9. Rest of Europe
-
4. Middle East & Africa
- 4.1. Turkey
- 4.2. Israel
- 4.3. GCC
- 4.4. North Africa
- 4.5. South Africa
- 4.6. Rest of Middle East & Africa
-
5. Asia Pacific
- 5.1. China
- 5.2. India
- 5.3. Japan
- 5.4. South Korea
- 5.5. ASEAN
- 5.6. Oceania
- 5.7. Rest of Asia Pacific
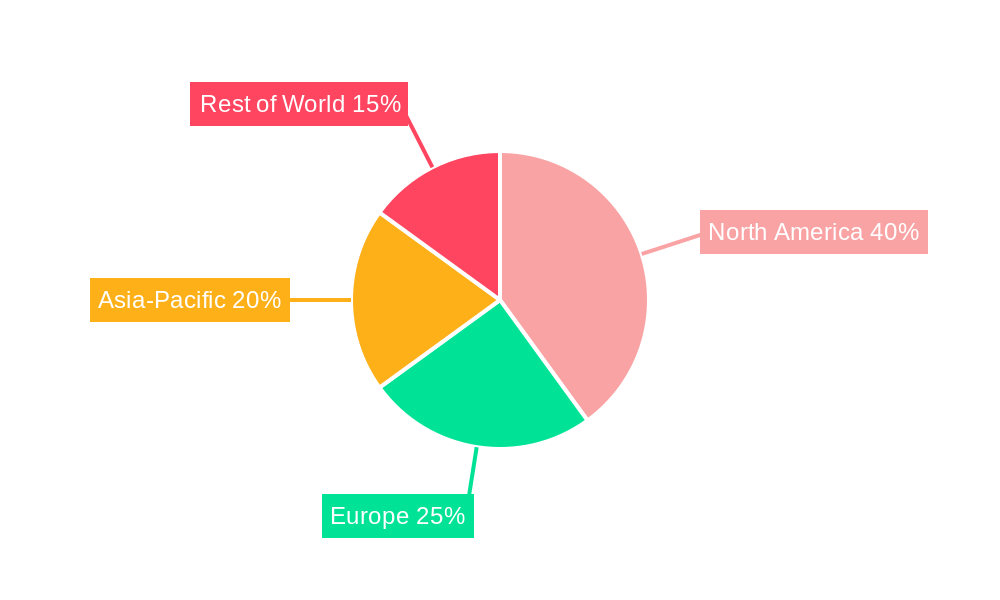
Military Satellite Industry Regional Market Share
Geographic Coverage of Military Satellite Industry
Military Satellite Industry REPORT HIGHLIGHTS
| Aspects | Details |
|---|---|
| Study Period | 2020-2034 |
| Base Year | 2025 |
| Estimated Year | 2026 |
| Forecast Period | 2026-2034 |
| Historical Period | 2020-2025 |
| Growth Rate | CAGR of 10% from 2020-2034 |
| Segmentation |
|
Table of Contents
- 1. Introduction
- 1.1. Research Scope
- 1.2. Market Segmentation
- 1.3. Research Objective
- 1.4. Definitions and Assumptions
- 2. Executive Summary
- 2.1. Market Snapshot
- 3. Market Dynamics
- 3.1. Market Drivers
- 3.2. Market Restrains
- 3.3. Market Trends
- 3.4. Market Opportunities
- 4. Market Factor Analysis
- 4.1. Porters Five Forces
- 4.1.1. Bargaining Power of Suppliers
- 4.1.2. Bargaining Power of Buyers
- 4.1.3. Threat of New Entrants
- 4.1.4. Threat of Substitutes
- 4.1.5. Competitive Rivalry
- 4.2. PESTEL analysis
- 4.3. BCG Analysis
- 4.3.1. Stars (High Growth, High Market Share)
- 4.3.2. Cash Cows (Low Growth, High Market Share)
- 4.3.3. Question Mark (High Growth, Low Market Share)
- 4.3.4. Dogs (Low Growth, Low Market Share)
- 4.4. Ansoff Matrix Analysis
- 4.5. Supply Chain Analysis
- 4.6. Regulatory Landscape
- 4.7. Current Market Potential and Opportunity Assessment (TAM–SAM–SOM Framework)
- 4.8. MDP Analyst Note
- 4.1. Porters Five Forces
- 5. Market Analysis, Insights and Forecast 2021-2033
- 5.1. Market Analysis, Insights and Forecast - by Satellite Mass
- 5.1.1. 10-100kg
- 5.1.2. 100-500kg
- 5.1.3. 500-1000kg
- 5.1.4. Below 10 Kg
- 5.1.5. above 1000kg
- 5.2. Market Analysis, Insights and Forecast - by Orbit Class
- 5.2.1. GEO
- 5.2.2. LEO
- 5.2.3. MEO
- 5.3. Market Analysis, Insights and Forecast - by Satellite Subsystem
- 5.3.1. Propulsion Hardware and Propellant
- 5.3.2. Satellite Bus & Subsystems
- 5.3.3. Solar Array & Power Hardware
- 5.3.4. Structures, Harness & Mechanisms
- 5.4. Market Analysis, Insights and Forecast - by Application
- 5.4.1. Communication
- 5.4.2. Earth Observation
- 5.4.3. Navigation
- 5.4.4. Space Observation
- 5.4.5. Others
- 5.5. Market Analysis, Insights and Forecast - by Region
- 5.5.1. North America
- 5.5.2. South America
- 5.5.3. Europe
- 5.5.4. Middle East & Africa
- 5.5.5. Asia Pacific
- 5.1. Market Analysis, Insights and Forecast - by Satellite Mass
- 6. Global Military Satellite Industry Analysis, Insights and Forecast, 2021-2033
- 6.1. Market Analysis, Insights and Forecast - by Satellite Mass
- 6.1.1. 10-100kg
- 6.1.2. 100-500kg
- 6.1.3. 500-1000kg
- 6.1.4. Below 10 Kg
- 6.1.5. above 1000kg
- 6.2. Market Analysis, Insights and Forecast - by Orbit Class
- 6.2.1. GEO
- 6.2.2. LEO
- 6.2.3. MEO
- 6.3. Market Analysis, Insights and Forecast - by Satellite Subsystem
- 6.3.1. Propulsion Hardware and Propellant
- 6.3.2. Satellite Bus & Subsystems
- 6.3.3. Solar Array & Power Hardware
- 6.3.4. Structures, Harness & Mechanisms
- 6.4. Market Analysis, Insights and Forecast - by Application
- 6.4.1. Communication
- 6.4.2. Earth Observation
- 6.4.3. Navigation
- 6.4.4. Space Observation
- 6.4.5. Others
- 6.1. Market Analysis, Insights and Forecast - by Satellite Mass
- 7. North America Military Satellite Industry Analysis, Insights and Forecast, 2020-2032
- 7.1. Market Analysis, Insights and Forecast - by Satellite Mass
- 7.1.1. 10-100kg
- 7.1.2. 100-500kg
- 7.1.3. 500-1000kg
- 7.1.4. Below 10 Kg
- 7.1.5. above 1000kg
- 7.2. Market Analysis, Insights and Forecast - by Orbit Class
- 7.2.1. GEO
- 7.2.2. LEO
- 7.2.3. MEO
- 7.3. Market Analysis, Insights and Forecast - by Satellite Subsystem
- 7.3.1. Propulsion Hardware and Propellant
- 7.3.2. Satellite Bus & Subsystems
- 7.3.3. Solar Array & Power Hardware
- 7.3.4. Structures, Harness & Mechanisms
- 7.4. Market Analysis, Insights and Forecast - by Application
- 7.4.1. Communication
- 7.4.2. Earth Observation
- 7.4.3. Navigation
- 7.4.4. Space Observation
- 7.4.5. Others
- 7.1. Market Analysis, Insights and Forecast - by Satellite Mass
- 8. South America Military Satellite Industry Analysis, Insights and Forecast, 2020-2032
- 8.1. Market Analysis, Insights and Forecast - by Satellite Mass
- 8.1.1. 10-100kg
- 8.1.2. 100-500kg
- 8.1.3. 500-1000kg
- 8.1.4. Below 10 Kg
- 8.1.5. above 1000kg
- 8.2. Market Analysis, Insights and Forecast - by Orbit Class
- 8.2.1. GEO
- 8.2.2. LEO
- 8.2.3. MEO
- 8.3. Market Analysis, Insights and Forecast - by Satellite Subsystem
- 8.3.1. Propulsion Hardware and Propellant
- 8.3.2. Satellite Bus & Subsystems
- 8.3.3. Solar Array & Power Hardware
- 8.3.4. Structures, Harness & Mechanisms
- 8.4. Market Analysis, Insights and Forecast - by Application
- 8.4.1. Communication
- 8.4.2. Earth Observation
- 8.4.3. Navigation
- 8.4.4. Space Observation
- 8.4.5. Others
- 8.1. Market Analysis, Insights and Forecast - by Satellite Mass
- 9. Europe Military Satellite Industry Analysis, Insights and Forecast, 2020-2032
- 9.1. Market Analysis, Insights and Forecast - by Satellite Mass
- 9.1.1. 10-100kg
- 9.1.2. 100-500kg
- 9.1.3. 500-1000kg
- 9.1.4. Below 10 Kg
- 9.1.5. above 1000kg
- 9.2. Market Analysis, Insights and Forecast - by Orbit Class
- 9.2.1. GEO
- 9.2.2. LEO
- 9.2.3. MEO
- 9.3. Market Analysis, Insights and Forecast - by Satellite Subsystem
- 9.3.1. Propulsion Hardware and Propellant
- 9.3.2. Satellite Bus & Subsystems
- 9.3.3. Solar Array & Power Hardware
- 9.3.4. Structures, Harness & Mechanisms
- 9.4. Market Analysis, Insights and Forecast - by Application
- 9.4.1. Communication
- 9.4.2. Earth Observation
- 9.4.3. Navigation
- 9.4.4. Space Observation
- 9.4.5. Others
- 9.1. Market Analysis, Insights and Forecast - by Satellite Mass
- 10. Middle East & Africa Military Satellite Industry Analysis, Insights and Forecast, 2020-2032
- 10.1. Market Analysis, Insights and Forecast - by Satellite Mass
- 10.1.1. 10-100kg
- 10.1.2. 100-500kg
- 10.1.3. 500-1000kg
- 10.1.4. Below 10 Kg
- 10.1.5. above 1000kg
- 10.2. Market Analysis, Insights and Forecast - by Orbit Class
- 10.2.1. GEO
- 10.2.2. LEO
- 10.2.3. MEO
- 10.3. Market Analysis, Insights and Forecast - by Satellite Subsystem
- 10.3.1. Propulsion Hardware and Propellant
- 10.3.2. Satellite Bus & Subsystems
- 10.3.3. Solar Array & Power Hardware
- 10.3.4. Structures, Harness & Mechanisms
- 10.4. Market Analysis, Insights and Forecast - by Application
- 10.4.1. Communication
- 10.4.2. Earth Observation
- 10.4.3. Navigation
- 10.4.4. Space Observation
- 10.4.5. Others
- 10.1. Market Analysis, Insights and Forecast - by Satellite Mass
- 11. Asia Pacific Military Satellite Industry Analysis, Insights and Forecast, 2020-2032
- 11.1. Market Analysis, Insights and Forecast - by Satellite Mass
- 11.1.1. 10-100kg
- 11.1.2. 100-500kg
- 11.1.3. 500-1000kg
- 11.1.4. Below 10 Kg
- 11.1.5. above 1000kg
- 11.2. Market Analysis, Insights and Forecast - by Orbit Class
- 11.2.1. GEO
- 11.2.2. LEO
- 11.2.3. MEO
- 11.3. Market Analysis, Insights and Forecast - by Satellite Subsystem
- 11.3.1. Propulsion Hardware and Propellant
- 11.3.2. Satellite Bus & Subsystems
- 11.3.3. Solar Array & Power Hardware
- 11.3.4. Structures, Harness & Mechanisms
- 11.4. Market Analysis, Insights and Forecast - by Application
- 11.4.1. Communication
- 11.4.2. Earth Observation
- 11.4.3. Navigation
- 11.4.4. Space Observation
- 11.4.5. Others
- 11.1. Market Analysis, Insights and Forecast - by Satellite Mass
- 12. Competitive Analysis
- 12.1. Company Profiles
- 12.1.1 Information Satellite Systems Reshetnev
- 12.1.1.1. Company Overview
- 12.1.1.2. Products
- 12.1.1.3. Company Financials
- 12.1.1.4. SWOT Analysis
- 12.1.2 Raytheon Technologies Corporation
- 12.1.2.1. Company Overview
- 12.1.2.2. Products
- 12.1.2.3. Company Financials
- 12.1.2.4. SWOT Analysis
- 12.1.3 BAE Systems
- 12.1.3.1. Company Overview
- 12.1.3.2. Products
- 12.1.3.3. Company Financials
- 12.1.3.4. SWOT Analysis
- 12.1.4 Lockheed Martin Corporation
- 12.1.4.1. Company Overview
- 12.1.4.2. Products
- 12.1.4.3. Company Financials
- 12.1.4.4. SWOT Analysis
- 12.1.5 Airbus SE
- 12.1.5.1. Company Overview
- 12.1.5.2. Products
- 12.1.5.3. Company Financials
- 12.1.5.4. SWOT Analysis
- 12.1.6 Viasat Inc
- 12.1.6.1. Company Overview
- 12.1.6.2. Products
- 12.1.6.3. Company Financials
- 12.1.6.4. SWOT Analysis
- 12.1.7 China Aerospace Science and Technology Corporation (CASC)
- 12.1.7.1. Company Overview
- 12.1.7.2. Products
- 12.1.7.3. Company Financials
- 12.1.7.4. SWOT Analysis
- 12.1.8 General Dynamics
- 12.1.8.1. Company Overview
- 12.1.8.2. Products
- 12.1.8.3. Company Financials
- 12.1.8.4. SWOT Analysis
- 12.1.9 Thales
- 12.1.9.1. Company Overview
- 12.1.9.2. Products
- 12.1.9.3. Company Financials
- 12.1.9.4. SWOT Analysis
- 12.1.10 Elbit Systems
- 12.1.10.1. Company Overview
- 12.1.10.2. Products
- 12.1.10.3. Company Financials
- 12.1.10.4. SWOT Analysis
- 12.1.11 ROSCOSMOS
- 12.1.11.1. Company Overview
- 12.1.11.2. Products
- 12.1.11.3. Company Financials
- 12.1.11.4. SWOT Analysis
- 12.1.12 Indian Space Research Organisation (ISRO)
- 12.1.12.1. Company Overview
- 12.1.12.2. Products
- 12.1.12.3. Company Financials
- 12.1.12.4. SWOT Analysis
- 12.1.1 Information Satellite Systems Reshetnev
- 12.2. Market Entropy
- 12.2.1 Company's Key Areas Served
- 12.2.2 Recent Developments
- 12.3. Company Market Share Analysis 2025
- 12.3.1 Top 5 Companies Market Share Analysis
- 12.3.2 Top 3 Companies Market Share Analysis
- 12.4. List of Potential Customers
- 13. Research Methodology
List of Figures
- Figure 1: Global Military Satellite Industry Revenue Breakdown (billion, %) by Region 2025 & 2033
- Figure 2: North America Military Satellite Industry Revenue (billion), by Satellite Mass 2025 & 2033
- Figure 3: North America Military Satellite Industry Revenue Share (%), by Satellite Mass 2025 & 2033
- Figure 4: North America Military Satellite Industry Revenue (billion), by Orbit Class 2025 & 2033
- Figure 5: North America Military Satellite Industry Revenue Share (%), by Orbit Class 2025 & 2033
- Figure 6: North America Military Satellite Industry Revenue (billion), by Satellite Subsystem 2025 & 2033
- Figure 7: North America Military Satellite Industry Revenue Share (%), by Satellite Subsystem 2025 & 2033
- Figure 8: North America Military Satellite Industry Revenue (billion), by Application 2025 & 2033
- Figure 9: North America Military Satellite Industry Revenue Share (%), by Application 2025 & 2033
- Figure 10: North America Military Satellite Industry Revenue (billion), by Country 2025 & 2033
- Figure 11: North America Military Satellite Industry Revenue Share (%), by Country 2025 & 2033
- Figure 12: South America Military Satellite Industry Revenue (billion), by Satellite Mass 2025 & 2033
- Figure 13: South America Military Satellite Industry Revenue Share (%), by Satellite Mass 2025 & 2033
- Figure 14: South America Military Satellite Industry Revenue (billion), by Orbit Class 2025 & 2033
- Figure 15: South America Military Satellite Industry Revenue Share (%), by Orbit Class 2025 & 2033
- Figure 16: South America Military Satellite Industry Revenue (billion), by Satellite Subsystem 2025 & 2033
- Figure 17: South America Military Satellite Industry Revenue Share (%), by Satellite Subsystem 2025 & 2033
- Figure 18: South America Military Satellite Industry Revenue (billion), by Application 2025 & 2033
- Figure 19: South America Military Satellite Industry Revenue Share (%), by Application 2025 & 2033
- Figure 20: South America Military Satellite Industry Revenue (billion), by Country 2025 & 2033
- Figure 21: South America Military Satellite Industry Revenue Share (%), by Country 2025 & 2033
- Figure 22: Europe Military Satellite Industry Revenue (billion), by Satellite Mass 2025 & 2033
- Figure 23: Europe Military Satellite Industry Revenue Share (%), by Satellite Mass 2025 & 2033
- Figure 24: Europe Military Satellite Industry Revenue (billion), by Orbit Class 2025 & 2033
- Figure 25: Europe Military Satellite Industry Revenue Share (%), by Orbit Class 2025 & 2033
- Figure 26: Europe Military Satellite Industry Revenue (billion), by Satellite Subsystem 2025 & 2033
- Figure 27: Europe Military Satellite Industry Revenue Share (%), by Satellite Subsystem 2025 & 2033
- Figure 28: Europe Military Satellite Industry Revenue (billion), by Application 2025 & 2033
- Figure 29: Europe Military Satellite Industry Revenue Share (%), by Application 2025 & 2033
- Figure 30: Europe Military Satellite Industry Revenue (billion), by Country 2025 & 2033
- Figure 31: Europe Military Satellite Industry Revenue Share (%), by Country 2025 & 2033
- Figure 32: Middle East & Africa Military Satellite Industry Revenue (billion), by Satellite Mass 2025 & 2033
- Figure 33: Middle East & Africa Military Satellite Industry Revenue Share (%), by Satellite Mass 2025 & 2033
- Figure 34: Middle East & Africa Military Satellite Industry Revenue (billion), by Orbit Class 2025 & 2033
- Figure 35: Middle East & Africa Military Satellite Industry Revenue Share (%), by Orbit Class 2025 & 2033
- Figure 36: Middle East & Africa Military Satellite Industry Revenue (billion), by Satellite Subsystem 2025 & 2033
- Figure 37: Middle East & Africa Military Satellite Industry Revenue Share (%), by Satellite Subsystem 2025 & 2033
- Figure 38: Middle East & Africa Military Satellite Industry Revenue (billion), by Application 2025 & 2033
- Figure 39: Middle East & Africa Military Satellite Industry Revenue Share (%), by Application 2025 & 2033
- Figure 40: Middle East & Africa Military Satellite Industry Revenue (billion), by Country 2025 & 2033
- Figure 41: Middle East & Africa Military Satellite Industry Revenue Share (%), by Country 2025 & 2033
- Figure 42: Asia Pacific Military Satellite Industry Revenue (billion), by Satellite Mass 2025 & 2033
- Figure 43: Asia Pacific Military Satellite Industry Revenue Share (%), by Satellite Mass 2025 & 2033
- Figure 44: Asia Pacific Military Satellite Industry Revenue (billion), by Orbit Class 2025 & 2033
- Figure 45: Asia Pacific Military Satellite Industry Revenue Share (%), by Orbit Class 2025 & 2033
- Figure 46: Asia Pacific Military Satellite Industry Revenue (billion), by Satellite Subsystem 2025 & 2033
- Figure 47: Asia Pacific Military Satellite Industry Revenue Share (%), by Satellite Subsystem 2025 & 2033
- Figure 48: Asia Pacific Military Satellite Industry Revenue (billion), by Application 2025 & 2033
- Figure 49: Asia Pacific Military Satellite Industry Revenue Share (%), by Application 2025 & 2033
- Figure 50: Asia Pacific Military Satellite Industry Revenue (billion), by Country 2025 & 2033
- Figure 51: Asia Pacific Military Satellite Industry Revenue Share (%), by Country 2025 & 2033
List of Tables
- Table 1: Global Military Satellite Industry Revenue billion Forecast, by Satellite Mass 2020 & 2033
- Table 2: Global Military Satellite Industry Revenue billion Forecast, by Orbit Class 2020 & 2033
- Table 3: Global Military Satellite Industry Revenue billion Forecast, by Satellite Subsystem 2020 & 2033
- Table 4: Global Military Satellite Industry Revenue billion Forecast, by Application 2020 & 2033
- Table 5: Global Military Satellite Industry Revenue billion Forecast, by Region 2020 & 2033
- Table 6: Global Military Satellite Industry Revenue billion Forecast, by Satellite Mass 2020 & 2033
- Table 7: Global Military Satellite Industry Revenue billion Forecast, by Orbit Class 2020 & 2033
- Table 8: Global Military Satellite Industry Revenue billion Forecast, by Satellite Subsystem 2020 & 2033
- Table 9: Global Military Satellite Industry Revenue billion Forecast, by Application 2020 & 2033
- Table 10: Global Military Satellite Industry Revenue billion Forecast, by Country 2020 & 2033
- Table 11: United States Military Satellite Industry Revenue (billion) Forecast, by Application 2020 & 2033
- Table 12: Canada Military Satellite Industry Revenue (billion) Forecast, by Application 2020 & 2033
- Table 13: Mexico Military Satellite Industry Revenue (billion) Forecast, by Application 2020 & 2033
- Table 14: Global Military Satellite Industry Revenue billion Forecast, by Satellite Mass 2020 & 2033
- Table 15: Global Military Satellite Industry Revenue billion Forecast, by Orbit Class 2020 & 2033
- Table 16: Global Military Satellite Industry Revenue billion Forecast, by Satellite Subsystem 2020 & 2033
- Table 17: Global Military Satellite Industry Revenue billion Forecast, by Application 2020 & 2033
- Table 18: Global Military Satellite Industry Revenue billion Forecast, by Country 2020 & 2033
- Table 19: Brazil Military Satellite Industry Revenue (billion) Forecast, by Application 2020 & 2033
- Table 20: Argentina Military Satellite Industry Revenue (billion) Forecast, by Application 2020 & 2033
- Table 21: Rest of South America Military Satellite Industry Revenue (billion) Forecast, by Application 2020 & 2033
- Table 22: Global Military Satellite Industry Revenue billion Forecast, by Satellite Mass 2020 & 2033
- Table 23: Global Military Satellite Industry Revenue billion Forecast, by Orbit Class 2020 & 2033
- Table 24: Global Military Satellite Industry Revenue billion Forecast, by Satellite Subsystem 2020 & 2033
- Table 25: Global Military Satellite Industry Revenue billion Forecast, by Application 2020 & 2033
- Table 26: Global Military Satellite Industry Revenue billion Forecast, by Country 2020 & 2033
- Table 27: United Kingdom Military Satellite Industry Revenue (billion) Forecast, by Application 2020 & 2033
- Table 28: Germany Military Satellite Industry Revenue (billion) Forecast, by Application 2020 & 2033
- Table 29: France Military Satellite Industry Revenue (billion) Forecast, by Application 2020 & 2033
- Table 30: Italy Military Satellite Industry Revenue (billion) Forecast, by Application 2020 & 2033
- Table 31: Spain Military Satellite Industry Revenue (billion) Forecast, by Application 2020 & 2033
- Table 32: Russia Military Satellite Industry Revenue (billion) Forecast, by Application 2020 & 2033
- Table 33: Benelux Military Satellite Industry Revenue (billion) Forecast, by Application 2020 & 2033
- Table 34: Nordics Military Satellite Industry Revenue (billion) Forecast, by Application 2020 & 2033
- Table 35: Rest of Europe Military Satellite Industry Revenue (billion) Forecast, by Application 2020 & 2033
- Table 36: Global Military Satellite Industry Revenue billion Forecast, by Satellite Mass 2020 & 2033
- Table 37: Global Military Satellite Industry Revenue billion Forecast, by Orbit Class 2020 & 2033
- Table 38: Global Military Satellite Industry Revenue billion Forecast, by Satellite Subsystem 2020 & 2033
- Table 39: Global Military Satellite Industry Revenue billion Forecast, by Application 2020 & 2033
- Table 40: Global Military Satellite Industry Revenue billion Forecast, by Country 2020 & 2033
- Table 41: Turkey Military Satellite Industry Revenue (billion) Forecast, by Application 2020 & 2033
- Table 42: Israel Military Satellite Industry Revenue (billion) Forecast, by Application 2020 & 2033
- Table 43: GCC Military Satellite Industry Revenue (billion) Forecast, by Application 2020 & 2033
- Table 44: North Africa Military Satellite Industry Revenue (billion) Forecast, by Application 2020 & 2033
- Table 45: South Africa Military Satellite Industry Revenue (billion) Forecast, by Application 2020 & 2033
- Table 46: Rest of Middle East & Africa Military Satellite Industry Revenue (billion) Forecast, by Application 2020 & 2033
- Table 47: Global Military Satellite Industry Revenue billion Forecast, by Satellite Mass 2020 & 2033
- Table 48: Global Military Satellite Industry Revenue billion Forecast, by Orbit Class 2020 & 2033
- Table 49: Global Military Satellite Industry Revenue billion Forecast, by Satellite Subsystem 2020 & 2033
- Table 50: Global Military Satellite Industry Revenue billion Forecast, by Application 2020 & 2033
- Table 51: Global Military Satellite Industry Revenue billion Forecast, by Country 2020 & 2033
- Table 52: China Military Satellite Industry Revenue (billion) Forecast, by Application 2020 & 2033
- Table 53: India Military Satellite Industry Revenue (billion) Forecast, by Application 2020 & 2033
- Table 54: Japan Military Satellite Industry Revenue (billion) Forecast, by Application 2020 & 2033
- Table 55: South Korea Military Satellite Industry Revenue (billion) Forecast, by Application 2020 & 2033
- Table 56: ASEAN Military Satellite Industry Revenue (billion) Forecast, by Application 2020 & 2033
- Table 57: Oceania Military Satellite Industry Revenue (billion) Forecast, by Application 2020 & 2033
- Table 58: Rest of Asia Pacific Military Satellite Industry Revenue (billion) Forecast, by Application 2020 & 2033
Frequently Asked Questions
1. What is the projected Compound Annual Growth Rate (CAGR) of the Military Satellite Industry?
The projected CAGR is approximately 10%.
2. Which companies are prominent players in the Military Satellite Industry?
Key companies in the market include Information Satellite Systems Reshetnev, Raytheon Technologies Corporation, BAE Systems, Lockheed Martin Corporation, Airbus SE, Viasat Inc, China Aerospace Science and Technology Corporation (CASC), General Dynamics, Thales, Elbit Systems, ROSCOSMOS, Indian Space Research Organisation (ISRO).
3. What are the main segments of the Military Satellite Industry?
The market segments include Satellite Mass, Orbit Class, Satellite Subsystem, Application.
4. Can you provide details about the market size?
The market size is estimated to be USD 36 billion as of 2022.
5. What are some drivers contributing to market growth?
N/A
6. What are the notable trends driving market growth?
OTHER KEY INDUSTRY TRENDS COVERED IN THE REPORT.
7. Are there any restraints impacting market growth?
N/A
8. Can you provide examples of recent developments in the market?
February 2023: Blue Canyon Technologies LLC, a subsidiary of Raytheon Technologies, provided critical hardware components for several of the SmallSat missions aboard the Transporter-6 launch that pitched 114 small payloads into polar orbit.February 2023: Blue Canyon Technologies LLC, a subsidiary of Raytheon Technologies, provided critical hardware components for several of the smallsat missions aboard the Transporter-6 launch, which pitched 114 small payloads into polar orbit.January 2023: Raytheon Intelligence & Space was awarded a major contract to develop a prototype missile tracking system for the US Space Force. MTC is the service's first missile tracking system for medium earth orbit. Under this contract, Raytheon Intelligence & Space will act as the main contractor, developing and delivering a state-of-the-art space vehicle, missile tracking mission payload, and command and control elements for ground and data processing missions.
9. What pricing options are available for accessing the report?
Pricing options include single-user, multi-user, and enterprise licenses priced at USD 3800, USD 4500, and USD 5800 respectively.
10. Is the market size provided in terms of value or volume?
The market size is provided in terms of value, measured in billion.
11. Are there any specific market keywords associated with the report?
Yes, the market keyword associated with the report is "Military Satellite Industry," which aids in identifying and referencing the specific market segment covered.
12. How do I determine which pricing option suits my needs best?
The pricing options vary based on user requirements and access needs. Individual users may opt for single-user licenses, while businesses requiring broader access may choose multi-user or enterprise licenses for cost-effective access to the report.
13. Are there any additional resources or data provided in the Military Satellite Industry report?
While the report offers comprehensive insights, it's advisable to review the specific contents or supplementary materials provided to ascertain if additional resources or data are available.
14. How can I stay updated on further developments or reports in the Military Satellite Industry?
To stay informed about further developments, trends, and reports in the Military Satellite Industry, consider subscribing to industry newsletters, following relevant companies and organizations, or regularly checking reputable industry news sources and publications.
Methodology
Step 1 - Identification of Relevant Samples Size from Population Database


Step 2 - Approaches for Defining Global Market Size (Value, Volume* & Price*)

Note*: In applicable scenarios
Step 3 - Data Sources
Primary Research
- Web Analytics
- Survey Reports
- Research Institute
- Latest Research Reports
- Opinion Leaders
Secondary Research
- Annual Reports
- White Paper
- Latest Press Release
- Industry Association
- Paid Database
- Investor Presentations

Step 4 - Data Triangulation
Involves using different sources of information in order to increase the validity of a study
These sources are likely to be stakeholders in a program - participants, other researchers, program staff, other community members, and so on.
Then we put all data in single framework & apply various statistical tools to find out the dynamic on the market.
During the analysis stage, feedback from the stakeholder groups would be compared to determine areas of agreement as well as areas of divergence