

Key Insights
The Low Earth Orbit (LEO) satellite market is experiencing significant expansion, driven by escalating demand for high-bandwidth, low-latency communications, advanced Earth observation, and precise navigation. Growth is fueled by the proliferation of IoT devices, the burgeoning new space economy, and the critical need for real-time data across defense, agriculture, and environmental sectors. Advancements in miniaturization, electric propulsion, and satellite constellation deployment further accelerate this trend. While initial investments are substantial, economies of scale and reusable launch systems are reducing operational costs, enhancing accessibility. The market shows a strong focus on smaller satellites (10-100kg) for cost-effective deployment. The commercial sector leads, with considerable future growth anticipated in military and government applications, particularly in surveillance and national security.
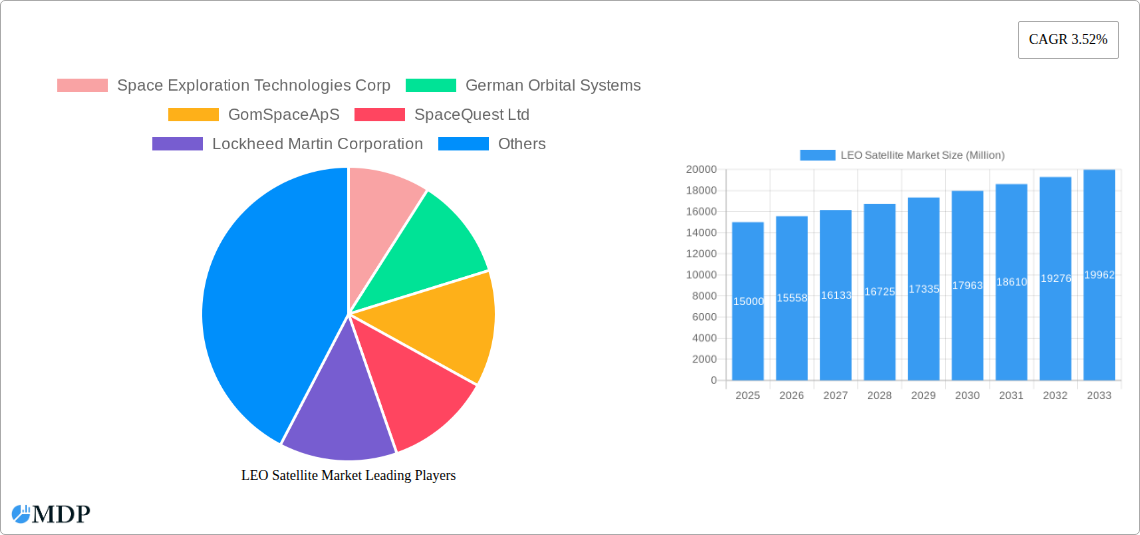
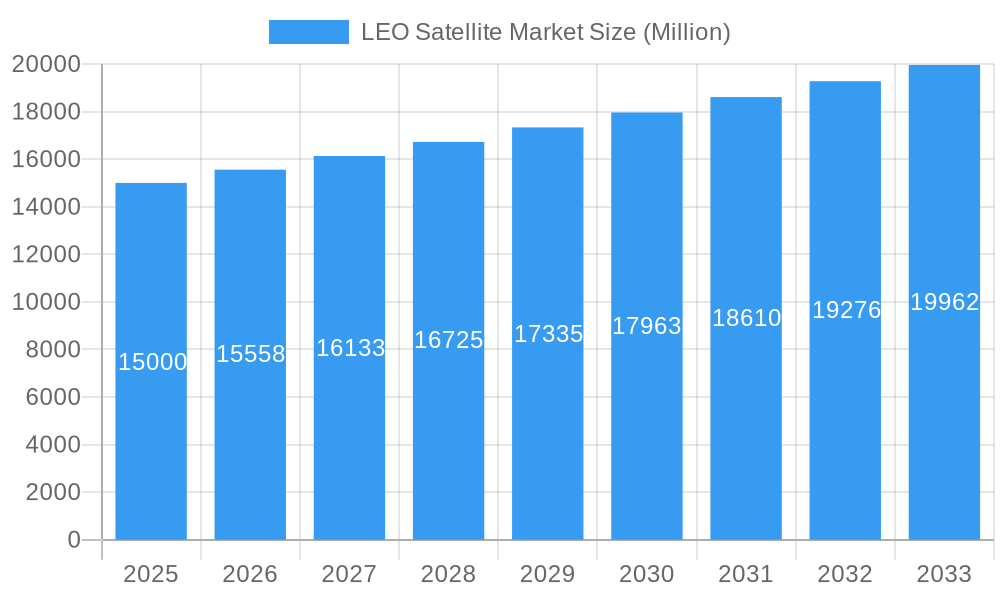
LEO Satellite Market Market Size (In Billion)
The market is projected to grow at a cagr: 11.9% from base year: 2025. With a current market size: 11.81 billion, this indicates substantial value appreciation over the forecast period (2025-2033). Key challenges include regulatory complexities, space debris risks, and potential signal interference. However, ongoing space traffic management initiatives and international cooperation are mitigating these concerns. A competitive landscape featuring established players like Lockheed Martin and Airbus, alongside innovators such as SpaceX and Planet Labs, fosters continuous innovation and market development.
LEO Satellite Market Company Market Share
LEO Satellite Market Analysis: Growth, Trends, and Forecast (2025-2033)
This comprehensive report offers an in-depth analysis of the LEO satellite market, detailing dynamics, industry trends, key players, and future growth prospects. The analysis focuses on the base year: 2025 with a forecast period extending to 2033. Essential for investors, stakeholders, and decision-makers, this report provides critical insights into this rapidly evolving market. Detailed segmentation covers applications, satellite mass, end-users, and propulsion technologies, offering actionable intelligence for strategic planning. Market values are presented in billions.
LEO Satellite Market Market Dynamics & Concentration
The LEO satellite market is experiencing robust growth, driven by increasing demand for high-bandwidth communication, advanced Earth observation capabilities, and the proliferation of IoT devices. Market concentration is moderate, with several key players vying for market share. However, a few dominant players such as SpaceX and Planet Labs hold significant influence. Innovation is a key driver, with continuous advancements in satellite technology, miniaturization, and propulsion systems. The regulatory landscape, while evolving, is largely supportive of LEO satellite deployment. Product substitutes, such as terrestrial communication networks, exist, but the unique advantages of LEO satellites in terms of coverage and latency are driving market expansion. Mergers and acquisitions (M&A) are frequent, with larger companies acquiring smaller, innovative firms to bolster their technological capabilities and market reach.
- Market Share: SpaceX and Planet Labs hold approximately xx% and xx% of the market share, respectively, in 2025. Other major players such as Airbus SE and Lockheed Martin Corporation together account for approximately xx%.
- M&A Activity: The historical period (2019-2024) witnessed approximately xx M&A deals, indicating a strong trend of consolidation within the market. This trend is predicted to continue into the forecast period.
LEO Satellite Market Industry Trends & Analysis
The LEO satellite market is characterized by a Compound Annual Growth Rate (CAGR) of xx% during the forecast period (2025-2033). Key growth drivers include the increasing adoption of satellite-based internet services, the burgeoning need for high-resolution Earth observation data across various sectors (agriculture, environmental monitoring, etc.), and government initiatives promoting space exploration and technological advancement. Technological disruptions, such as the development of smaller, more efficient satellites and improved launch technologies, are further accelerating market expansion. Consumer preferences are shifting towards more affordable and readily accessible satellite-based services. The competitive dynamics are intense, with companies continuously innovating to offer superior products and services. Market penetration in key sectors like communication and Earth observation is expected to increase significantly by 2033.
Leading Markets & Segments in LEO Satellite Market
The North American region dominates the LEO satellite market, driven by strong government support, technological advancements, and a thriving private sector. Within application segments, communication services hold the largest market share, followed by Earth observation. In terms of satellite mass, the 10-100kg segment is experiencing the most significant growth due to the increasing demand for smallsat constellations.
Key Drivers:
- North America: Strong government investment in space exploration, robust private sector participation, and advanced technological capabilities.
- Communication Segment: Growing demand for high-speed internet access, particularly in remote and underserved areas.
- 10-100kg Satellite Mass Segment: Cost-effectiveness, ease of launch, and suitability for large constellations.
Dominance Analysis: The dominance of North America is expected to persist throughout the forecast period due to sustained government funding and private investment. The communication segment will likely maintain its lead due to the ever-growing demand for global connectivity.
LEO Satellite Market Product Developments
Recent years have seen significant advancements in LEO satellite technology, including the development of smaller, more efficient satellites, improved propulsion systems, and advanced onboard sensors. These innovations are leading to the emergence of more cost-effective and versatile satellite constellations capable of providing a wide range of services. Companies are focusing on developing products that meet specific market needs, enhancing their competitiveness. The integration of artificial intelligence and machine learning into satellite operations is also creating new opportunities for service optimization and data analysis.
Key Drivers of LEO Satellite Market Growth
Technological advancements, such as miniaturization of satellites and improved launch capabilities, are key growth drivers. Increased government funding for space exploration and technological development, coupled with favorable regulatory frameworks, is further fueling market expansion. The rising demand for high-speed internet access, particularly in underserved regions, is also boosting market growth. The expanding use of satellite data in various sectors like agriculture, environmental monitoring, and disaster management is creating substantial opportunities.
Challenges in the LEO Satellite Market Market
The LEO satellite market faces challenges such as the high upfront cost of satellite development and launch, potential regulatory hurdles related to spectrum allocation and orbital slots, and the risk of space debris collisions. Supply chain disruptions can also impact the availability of critical components, while intense competition necessitates continuous innovation and cost optimization. These factors can limit the market's growth potential if not adequately addressed.
Emerging Opportunities in LEO Satellite Market
Technological breakthroughs, such as the development of advanced propulsion systems and improved satellite communication technologies, are creating significant opportunities for market expansion. Strategic partnerships between satellite operators, data analytics firms, and other stakeholders are driving innovation and market penetration. The expanding demand for data-driven insights in various industries and the exploration of new applications for LEO satellites are creating new markets and revenue streams.
Leading Players in the LEO Satellite Market Sector
- Space Exploration Technologies Corp
- German Orbital Systems
- GomSpace ApS
- SpaceQuest Ltd
- Lockheed Martin Corporation
- Airbus SE
- Astrocast
- Nano Avionics
- China Aerospace Science and Technology Corporation (CASC)
- Surrey Satellite Technology Ltd
- ROSCOSMOS
- Planet Labs Inc
Key Milestones in LEO Satellite Market Industry
- January 2022: Planet Labs launches 44 SuperDove satellites on SpaceX's Falcon 9 rocket, significantly expanding its Earth observation constellation.
- November 2021: Planet Labs acquires VanderSat for $28 Million, enhancing its Earth observation data capabilities.
- January 2021: Astrocast launches 5 satellites for IoT data collection, expanding its presence in the IoT market.
Strategic Outlook for LEO Satellite Market Market
The LEO satellite market exhibits significant long-term growth potential, fueled by continuous technological advancements and increasing demand for satellite-based services. Strategic partnerships and collaborations will play a vital role in accelerating market expansion. Focus on cost reduction, improved operational efficiency, and the development of innovative applications will be key to success in this highly competitive market. The market will continue to experience consolidation through mergers and acquisitions as larger companies seek to gain a stronger foothold in the industry.
LEO Satellite Market Segmentation
-
1. Application
- 1.1. Communication
- 1.2. Earth Observation
- 1.3. Navigation
- 1.4. Space Observation
- 1.5. Others
-
2. Satellite Mass
- 2.1. 10-100kg
- 2.2. 100-500kg
- 2.3. 500-1000kg
- 2.4. Below 10 Kg
- 2.5. above 1000kg
-
3. End User
- 3.1. Commercial
- 3.2. Military & Government
- 3.3. Other
-
4. Propulsion Tech
- 4.1. Electric
- 4.2. Gas based
- 4.3. Liquid Fuel
LEO Satellite Market Segmentation By Geography
-
1. North America
- 1.1. United States
- 1.2. Canada
- 1.3. Mexico
-
2. South America
- 2.1. Brazil
- 2.2. Argentina
- 2.3. Rest of South America
-
3. Europe
- 3.1. United Kingdom
- 3.2. Germany
- 3.3. France
- 3.4. Italy
- 3.5. Spain
- 3.6. Russia
- 3.7. Benelux
- 3.8. Nordics
- 3.9. Rest of Europe
-
4. Middle East & Africa
- 4.1. Turkey
- 4.2. Israel
- 4.3. GCC
- 4.4. North Africa
- 4.5. South Africa
- 4.6. Rest of Middle East & Africa
-
5. Asia Pacific
- 5.1. China
- 5.2. India
- 5.3. Japan
- 5.4. South Korea
- 5.5. ASEAN
- 5.6. Oceania
- 5.7. Rest of Asia Pacific
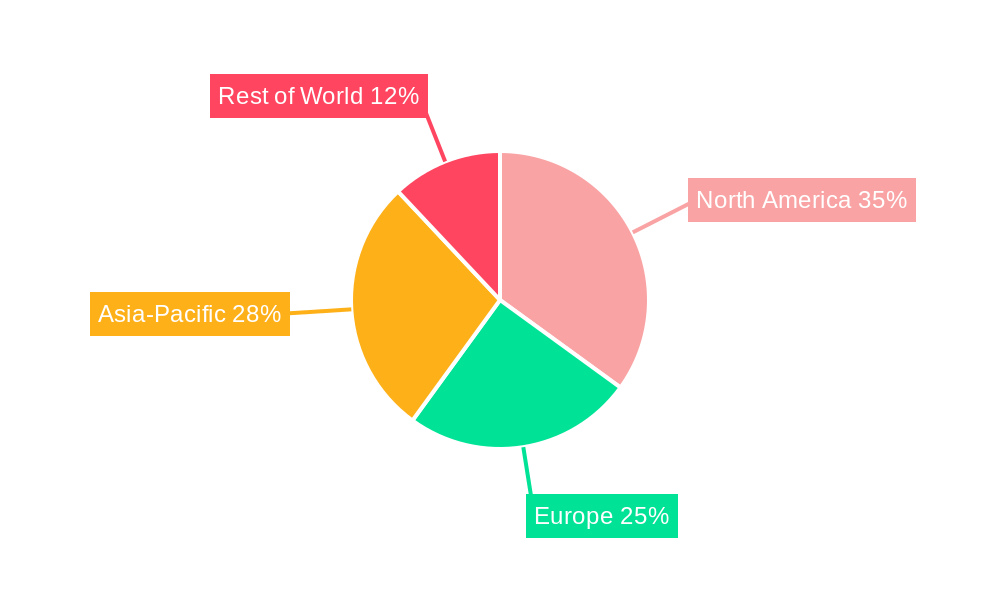
LEO Satellite Market Regional Market Share
Geographic Coverage of LEO Satellite Market
LEO Satellite Market REPORT HIGHLIGHTS
| Aspects | Details |
|---|---|
| Study Period | 2020-2034 |
| Base Year | 2025 |
| Estimated Year | 2026 |
| Forecast Period | 2026-2034 |
| Historical Period | 2020-2025 |
| Growth Rate | CAGR of 11.9% from 2020-2034 |
| Segmentation |
|
Table of Contents
- 1. Introduction
- 1.1. Research Scope
- 1.2. Market Segmentation
- 1.3. Research Objective
- 1.4. Definitions and Assumptions
- 2. Executive Summary
- 2.1. Market Snapshot
- 3. Market Dynamics
- 3.1. Market Drivers
- 3.2. Market Restrains
- 3.3. Market Trends
- 3.4. Market Opportunities
- 4. Market Factor Analysis
- 4.1. Porters Five Forces
- 4.1.1. Bargaining Power of Suppliers
- 4.1.2. Bargaining Power of Buyers
- 4.1.3. Threat of New Entrants
- 4.1.4. Threat of Substitutes
- 4.1.5. Competitive Rivalry
- 4.2. PESTEL analysis
- 4.3. BCG Analysis
- 4.3.1. Stars (High Growth, High Market Share)
- 4.3.2. Cash Cows (Low Growth, High Market Share)
- 4.3.3. Question Mark (High Growth, Low Market Share)
- 4.3.4. Dogs (Low Growth, Low Market Share)
- 4.4. Ansoff Matrix Analysis
- 4.5. Supply Chain Analysis
- 4.6. Regulatory Landscape
- 4.7. Current Market Potential and Opportunity Assessment (TAM–SAM–SOM Framework)
- 4.8. MDP Analyst Note
- 4.1. Porters Five Forces
- 5. Market Analysis, Insights and Forecast 2021-2033
- 5.1. Market Analysis, Insights and Forecast - by Application
- 5.1.1. Communication
- 5.1.2. Earth Observation
- 5.1.3. Navigation
- 5.1.4. Space Observation
- 5.1.5. Others
- 5.2. Market Analysis, Insights and Forecast - by Satellite Mass
- 5.2.1. 10-100kg
- 5.2.2. 100-500kg
- 5.2.3. 500-1000kg
- 5.2.4. Below 10 Kg
- 5.2.5. above 1000kg
- 5.3. Market Analysis, Insights and Forecast - by End User
- 5.3.1. Commercial
- 5.3.2. Military & Government
- 5.3.3. Other
- 5.4. Market Analysis, Insights and Forecast - by Propulsion Tech
- 5.4.1. Electric
- 5.4.2. Gas based
- 5.4.3. Liquid Fuel
- 5.5. Market Analysis, Insights and Forecast - by Region
- 5.5.1. North America
- 5.5.2. South America
- 5.5.3. Europe
- 5.5.4. Middle East & Africa
- 5.5.5. Asia Pacific
- 5.1. Market Analysis, Insights and Forecast - by Application
- 6. Global LEO Satellite Market Analysis, Insights and Forecast, 2021-2033
- 6.1. Market Analysis, Insights and Forecast - by Application
- 6.1.1. Communication
- 6.1.2. Earth Observation
- 6.1.3. Navigation
- 6.1.4. Space Observation
- 6.1.5. Others
- 6.2. Market Analysis, Insights and Forecast - by Satellite Mass
- 6.2.1. 10-100kg
- 6.2.2. 100-500kg
- 6.2.3. 500-1000kg
- 6.2.4. Below 10 Kg
- 6.2.5. above 1000kg
- 6.3. Market Analysis, Insights and Forecast - by End User
- 6.3.1. Commercial
- 6.3.2. Military & Government
- 6.3.3. Other
- 6.4. Market Analysis, Insights and Forecast - by Propulsion Tech
- 6.4.1. Electric
- 6.4.2. Gas based
- 6.4.3. Liquid Fuel
- 6.1. Market Analysis, Insights and Forecast - by Application
- 7. North America LEO Satellite Market Analysis, Insights and Forecast, 2020-2032
- 7.1. Market Analysis, Insights and Forecast - by Application
- 7.1.1. Communication
- 7.1.2. Earth Observation
- 7.1.3. Navigation
- 7.1.4. Space Observation
- 7.1.5. Others
- 7.2. Market Analysis, Insights and Forecast - by Satellite Mass
- 7.2.1. 10-100kg
- 7.2.2. 100-500kg
- 7.2.3. 500-1000kg
- 7.2.4. Below 10 Kg
- 7.2.5. above 1000kg
- 7.3. Market Analysis, Insights and Forecast - by End User
- 7.3.1. Commercial
- 7.3.2. Military & Government
- 7.3.3. Other
- 7.4. Market Analysis, Insights and Forecast - by Propulsion Tech
- 7.4.1. Electric
- 7.4.2. Gas based
- 7.4.3. Liquid Fuel
- 7.1. Market Analysis, Insights and Forecast - by Application
- 8. South America LEO Satellite Market Analysis, Insights and Forecast, 2020-2032
- 8.1. Market Analysis, Insights and Forecast - by Application
- 8.1.1. Communication
- 8.1.2. Earth Observation
- 8.1.3. Navigation
- 8.1.4. Space Observation
- 8.1.5. Others
- 8.2. Market Analysis, Insights and Forecast - by Satellite Mass
- 8.2.1. 10-100kg
- 8.2.2. 100-500kg
- 8.2.3. 500-1000kg
- 8.2.4. Below 10 Kg
- 8.2.5. above 1000kg
- 8.3. Market Analysis, Insights and Forecast - by End User
- 8.3.1. Commercial
- 8.3.2. Military & Government
- 8.3.3. Other
- 8.4. Market Analysis, Insights and Forecast - by Propulsion Tech
- 8.4.1. Electric
- 8.4.2. Gas based
- 8.4.3. Liquid Fuel
- 8.1. Market Analysis, Insights and Forecast - by Application
- 9. Europe LEO Satellite Market Analysis, Insights and Forecast, 2020-2032
- 9.1. Market Analysis, Insights and Forecast - by Application
- 9.1.1. Communication
- 9.1.2. Earth Observation
- 9.1.3. Navigation
- 9.1.4. Space Observation
- 9.1.5. Others
- 9.2. Market Analysis, Insights and Forecast - by Satellite Mass
- 9.2.1. 10-100kg
- 9.2.2. 100-500kg
- 9.2.3. 500-1000kg
- 9.2.4. Below 10 Kg
- 9.2.5. above 1000kg
- 9.3. Market Analysis, Insights and Forecast - by End User
- 9.3.1. Commercial
- 9.3.2. Military & Government
- 9.3.3. Other
- 9.4. Market Analysis, Insights and Forecast - by Propulsion Tech
- 9.4.1. Electric
- 9.4.2. Gas based
- 9.4.3. Liquid Fuel
- 9.1. Market Analysis, Insights and Forecast - by Application
- 10. Middle East & Africa LEO Satellite Market Analysis, Insights and Forecast, 2020-2032
- 10.1. Market Analysis, Insights and Forecast - by Application
- 10.1.1. Communication
- 10.1.2. Earth Observation
- 10.1.3. Navigation
- 10.1.4. Space Observation
- 10.1.5. Others
- 10.2. Market Analysis, Insights and Forecast - by Satellite Mass
- 10.2.1. 10-100kg
- 10.2.2. 100-500kg
- 10.2.3. 500-1000kg
- 10.2.4. Below 10 Kg
- 10.2.5. above 1000kg
- 10.3. Market Analysis, Insights and Forecast - by End User
- 10.3.1. Commercial
- 10.3.2. Military & Government
- 10.3.3. Other
- 10.4. Market Analysis, Insights and Forecast - by Propulsion Tech
- 10.4.1. Electric
- 10.4.2. Gas based
- 10.4.3. Liquid Fuel
- 10.1. Market Analysis, Insights and Forecast - by Application
- 11. Asia Pacific LEO Satellite Market Analysis, Insights and Forecast, 2020-2032
- 11.1. Market Analysis, Insights and Forecast - by Application
- 11.1.1. Communication
- 11.1.2. Earth Observation
- 11.1.3. Navigation
- 11.1.4. Space Observation
- 11.1.5. Others
- 11.2. Market Analysis, Insights and Forecast - by Satellite Mass
- 11.2.1. 10-100kg
- 11.2.2. 100-500kg
- 11.2.3. 500-1000kg
- 11.2.4. Below 10 Kg
- 11.2.5. above 1000kg
- 11.3. Market Analysis, Insights and Forecast - by End User
- 11.3.1. Commercial
- 11.3.2. Military & Government
- 11.3.3. Other
- 11.4. Market Analysis, Insights and Forecast - by Propulsion Tech
- 11.4.1. Electric
- 11.4.2. Gas based
- 11.4.3. Liquid Fuel
- 11.1. Market Analysis, Insights and Forecast - by Application
- 12. Competitive Analysis
- 12.1. Company Profiles
- 12.1.1 Space Exploration Technologies Corp
- 12.1.1.1. Company Overview
- 12.1.1.2. Products
- 12.1.1.3. Company Financials
- 12.1.1.4. SWOT Analysis
- 12.1.2 German Orbital Systems
- 12.1.2.1. Company Overview
- 12.1.2.2. Products
- 12.1.2.3. Company Financials
- 12.1.2.4. SWOT Analysis
- 12.1.3 GomSpaceApS
- 12.1.3.1. Company Overview
- 12.1.3.2. Products
- 12.1.3.3. Company Financials
- 12.1.3.4. SWOT Analysis
- 12.1.4 SpaceQuest Ltd
- 12.1.4.1. Company Overview
- 12.1.4.2. Products
- 12.1.4.3. Company Financials
- 12.1.4.4. SWOT Analysis
- 12.1.5 Lockheed Martin Corporation
- 12.1.5.1. Company Overview
- 12.1.5.2. Products
- 12.1.5.3. Company Financials
- 12.1.5.4. SWOT Analysis
- 12.1.6 Airbus SE
- 12.1.6.1. Company Overview
- 12.1.6.2. Products
- 12.1.6.3. Company Financials
- 12.1.6.4. SWOT Analysis
- 12.1.7 Astrocast
- 12.1.7.1. Company Overview
- 12.1.7.2. Products
- 12.1.7.3. Company Financials
- 12.1.7.4. SWOT Analysis
- 12.1.8 Nano Avionics
- 12.1.8.1. Company Overview
- 12.1.8.2. Products
- 12.1.8.3. Company Financials
- 12.1.8.4. SWOT Analysis
- 12.1.9 China Aerospace Science and Technology Corporation (CASC)
- 12.1.9.1. Company Overview
- 12.1.9.2. Products
- 12.1.9.3. Company Financials
- 12.1.9.4. SWOT Analysis
- 12.1.10 Surrey Satellite Technology Ltd
- 12.1.10.1. Company Overview
- 12.1.10.2. Products
- 12.1.10.3. Company Financials
- 12.1.10.4. SWOT Analysis
- 12.1.11 ROSCOSMOS
- 12.1.11.1. Company Overview
- 12.1.11.2. Products
- 12.1.11.3. Company Financials
- 12.1.11.4. SWOT Analysis
- 12.1.12 Planet Labs Inc
- 12.1.12.1. Company Overview
- 12.1.12.2. Products
- 12.1.12.3. Company Financials
- 12.1.12.4. SWOT Analysis
- 12.1.1 Space Exploration Technologies Corp
- 12.2. Market Entropy
- 12.2.1 Company's Key Areas Served
- 12.2.2 Recent Developments
- 12.3. Company Market Share Analysis 2025
- 12.3.1 Top 5 Companies Market Share Analysis
- 12.3.2 Top 3 Companies Market Share Analysis
- 12.4. List of Potential Customers
- 13. Research Methodology
List of Figures
- Figure 1: Global LEO Satellite Market Revenue Breakdown (billion, %) by Region 2025 & 2033
- Figure 2: North America LEO Satellite Market Revenue (billion), by Application 2025 & 2033
- Figure 3: North America LEO Satellite Market Revenue Share (%), by Application 2025 & 2033
- Figure 4: North America LEO Satellite Market Revenue (billion), by Satellite Mass 2025 & 2033
- Figure 5: North America LEO Satellite Market Revenue Share (%), by Satellite Mass 2025 & 2033
- Figure 6: North America LEO Satellite Market Revenue (billion), by End User 2025 & 2033
- Figure 7: North America LEO Satellite Market Revenue Share (%), by End User 2025 & 2033
- Figure 8: North America LEO Satellite Market Revenue (billion), by Propulsion Tech 2025 & 2033
- Figure 9: North America LEO Satellite Market Revenue Share (%), by Propulsion Tech 2025 & 2033
- Figure 10: North America LEO Satellite Market Revenue (billion), by Country 2025 & 2033
- Figure 11: North America LEO Satellite Market Revenue Share (%), by Country 2025 & 2033
- Figure 12: South America LEO Satellite Market Revenue (billion), by Application 2025 & 2033
- Figure 13: South America LEO Satellite Market Revenue Share (%), by Application 2025 & 2033
- Figure 14: South America LEO Satellite Market Revenue (billion), by Satellite Mass 2025 & 2033
- Figure 15: South America LEO Satellite Market Revenue Share (%), by Satellite Mass 2025 & 2033
- Figure 16: South America LEO Satellite Market Revenue (billion), by End User 2025 & 2033
- Figure 17: South America LEO Satellite Market Revenue Share (%), by End User 2025 & 2033
- Figure 18: South America LEO Satellite Market Revenue (billion), by Propulsion Tech 2025 & 2033
- Figure 19: South America LEO Satellite Market Revenue Share (%), by Propulsion Tech 2025 & 2033
- Figure 20: South America LEO Satellite Market Revenue (billion), by Country 2025 & 2033
- Figure 21: South America LEO Satellite Market Revenue Share (%), by Country 2025 & 2033
- Figure 22: Europe LEO Satellite Market Revenue (billion), by Application 2025 & 2033
- Figure 23: Europe LEO Satellite Market Revenue Share (%), by Application 2025 & 2033
- Figure 24: Europe LEO Satellite Market Revenue (billion), by Satellite Mass 2025 & 2033
- Figure 25: Europe LEO Satellite Market Revenue Share (%), by Satellite Mass 2025 & 2033
- Figure 26: Europe LEO Satellite Market Revenue (billion), by End User 2025 & 2033
- Figure 27: Europe LEO Satellite Market Revenue Share (%), by End User 2025 & 2033
- Figure 28: Europe LEO Satellite Market Revenue (billion), by Propulsion Tech 2025 & 2033
- Figure 29: Europe LEO Satellite Market Revenue Share (%), by Propulsion Tech 2025 & 2033
- Figure 30: Europe LEO Satellite Market Revenue (billion), by Country 2025 & 2033
- Figure 31: Europe LEO Satellite Market Revenue Share (%), by Country 2025 & 2033
- Figure 32: Middle East & Africa LEO Satellite Market Revenue (billion), by Application 2025 & 2033
- Figure 33: Middle East & Africa LEO Satellite Market Revenue Share (%), by Application 2025 & 2033
- Figure 34: Middle East & Africa LEO Satellite Market Revenue (billion), by Satellite Mass 2025 & 2033
- Figure 35: Middle East & Africa LEO Satellite Market Revenue Share (%), by Satellite Mass 2025 & 2033
- Figure 36: Middle East & Africa LEO Satellite Market Revenue (billion), by End User 2025 & 2033
- Figure 37: Middle East & Africa LEO Satellite Market Revenue Share (%), by End User 2025 & 2033
- Figure 38: Middle East & Africa LEO Satellite Market Revenue (billion), by Propulsion Tech 2025 & 2033
- Figure 39: Middle East & Africa LEO Satellite Market Revenue Share (%), by Propulsion Tech 2025 & 2033
- Figure 40: Middle East & Africa LEO Satellite Market Revenue (billion), by Country 2025 & 2033
- Figure 41: Middle East & Africa LEO Satellite Market Revenue Share (%), by Country 2025 & 2033
- Figure 42: Asia Pacific LEO Satellite Market Revenue (billion), by Application 2025 & 2033
- Figure 43: Asia Pacific LEO Satellite Market Revenue Share (%), by Application 2025 & 2033
- Figure 44: Asia Pacific LEO Satellite Market Revenue (billion), by Satellite Mass 2025 & 2033
- Figure 45: Asia Pacific LEO Satellite Market Revenue Share (%), by Satellite Mass 2025 & 2033
- Figure 46: Asia Pacific LEO Satellite Market Revenue (billion), by End User 2025 & 2033
- Figure 47: Asia Pacific LEO Satellite Market Revenue Share (%), by End User 2025 & 2033
- Figure 48: Asia Pacific LEO Satellite Market Revenue (billion), by Propulsion Tech 2025 & 2033
- Figure 49: Asia Pacific LEO Satellite Market Revenue Share (%), by Propulsion Tech 2025 & 2033
- Figure 50: Asia Pacific LEO Satellite Market Revenue (billion), by Country 2025 & 2033
- Figure 51: Asia Pacific LEO Satellite Market Revenue Share (%), by Country 2025 & 2033
List of Tables
- Table 1: Global LEO Satellite Market Revenue billion Forecast, by Application 2020 & 2033
- Table 2: Global LEO Satellite Market Revenue billion Forecast, by Satellite Mass 2020 & 2033
- Table 3: Global LEO Satellite Market Revenue billion Forecast, by End User 2020 & 2033
- Table 4: Global LEO Satellite Market Revenue billion Forecast, by Propulsion Tech 2020 & 2033
- Table 5: Global LEO Satellite Market Revenue billion Forecast, by Region 2020 & 2033
- Table 6: Global LEO Satellite Market Revenue billion Forecast, by Application 2020 & 2033
- Table 7: Global LEO Satellite Market Revenue billion Forecast, by Satellite Mass 2020 & 2033
- Table 8: Global LEO Satellite Market Revenue billion Forecast, by End User 2020 & 2033
- Table 9: Global LEO Satellite Market Revenue billion Forecast, by Propulsion Tech 2020 & 2033
- Table 10: Global LEO Satellite Market Revenue billion Forecast, by Country 2020 & 2033
- Table 11: United States LEO Satellite Market Revenue (billion) Forecast, by Application 2020 & 2033
- Table 12: Canada LEO Satellite Market Revenue (billion) Forecast, by Application 2020 & 2033
- Table 13: Mexico LEO Satellite Market Revenue (billion) Forecast, by Application 2020 & 2033
- Table 14: Global LEO Satellite Market Revenue billion Forecast, by Application 2020 & 2033
- Table 15: Global LEO Satellite Market Revenue billion Forecast, by Satellite Mass 2020 & 2033
- Table 16: Global LEO Satellite Market Revenue billion Forecast, by End User 2020 & 2033
- Table 17: Global LEO Satellite Market Revenue billion Forecast, by Propulsion Tech 2020 & 2033
- Table 18: Global LEO Satellite Market Revenue billion Forecast, by Country 2020 & 2033
- Table 19: Brazil LEO Satellite Market Revenue (billion) Forecast, by Application 2020 & 2033
- Table 20: Argentina LEO Satellite Market Revenue (billion) Forecast, by Application 2020 & 2033
- Table 21: Rest of South America LEO Satellite Market Revenue (billion) Forecast, by Application 2020 & 2033
- Table 22: Global LEO Satellite Market Revenue billion Forecast, by Application 2020 & 2033
- Table 23: Global LEO Satellite Market Revenue billion Forecast, by Satellite Mass 2020 & 2033
- Table 24: Global LEO Satellite Market Revenue billion Forecast, by End User 2020 & 2033
- Table 25: Global LEO Satellite Market Revenue billion Forecast, by Propulsion Tech 2020 & 2033
- Table 26: Global LEO Satellite Market Revenue billion Forecast, by Country 2020 & 2033
- Table 27: United Kingdom LEO Satellite Market Revenue (billion) Forecast, by Application 2020 & 2033
- Table 28: Germany LEO Satellite Market Revenue (billion) Forecast, by Application 2020 & 2033
- Table 29: France LEO Satellite Market Revenue (billion) Forecast, by Application 2020 & 2033
- Table 30: Italy LEO Satellite Market Revenue (billion) Forecast, by Application 2020 & 2033
- Table 31: Spain LEO Satellite Market Revenue (billion) Forecast, by Application 2020 & 2033
- Table 32: Russia LEO Satellite Market Revenue (billion) Forecast, by Application 2020 & 2033
- Table 33: Benelux LEO Satellite Market Revenue (billion) Forecast, by Application 2020 & 2033
- Table 34: Nordics LEO Satellite Market Revenue (billion) Forecast, by Application 2020 & 2033
- Table 35: Rest of Europe LEO Satellite Market Revenue (billion) Forecast, by Application 2020 & 2033
- Table 36: Global LEO Satellite Market Revenue billion Forecast, by Application 2020 & 2033
- Table 37: Global LEO Satellite Market Revenue billion Forecast, by Satellite Mass 2020 & 2033
- Table 38: Global LEO Satellite Market Revenue billion Forecast, by End User 2020 & 2033
- Table 39: Global LEO Satellite Market Revenue billion Forecast, by Propulsion Tech 2020 & 2033
- Table 40: Global LEO Satellite Market Revenue billion Forecast, by Country 2020 & 2033
- Table 41: Turkey LEO Satellite Market Revenue (billion) Forecast, by Application 2020 & 2033
- Table 42: Israel LEO Satellite Market Revenue (billion) Forecast, by Application 2020 & 2033
- Table 43: GCC LEO Satellite Market Revenue (billion) Forecast, by Application 2020 & 2033
- Table 44: North Africa LEO Satellite Market Revenue (billion) Forecast, by Application 2020 & 2033
- Table 45: South Africa LEO Satellite Market Revenue (billion) Forecast, by Application 2020 & 2033
- Table 46: Rest of Middle East & Africa LEO Satellite Market Revenue (billion) Forecast, by Application 2020 & 2033
- Table 47: Global LEO Satellite Market Revenue billion Forecast, by Application 2020 & 2033
- Table 48: Global LEO Satellite Market Revenue billion Forecast, by Satellite Mass 2020 & 2033
- Table 49: Global LEO Satellite Market Revenue billion Forecast, by End User 2020 & 2033
- Table 50: Global LEO Satellite Market Revenue billion Forecast, by Propulsion Tech 2020 & 2033
- Table 51: Global LEO Satellite Market Revenue billion Forecast, by Country 2020 & 2033
- Table 52: China LEO Satellite Market Revenue (billion) Forecast, by Application 2020 & 2033
- Table 53: India LEO Satellite Market Revenue (billion) Forecast, by Application 2020 & 2033
- Table 54: Japan LEO Satellite Market Revenue (billion) Forecast, by Application 2020 & 2033
- Table 55: South Korea LEO Satellite Market Revenue (billion) Forecast, by Application 2020 & 2033
- Table 56: ASEAN LEO Satellite Market Revenue (billion) Forecast, by Application 2020 & 2033
- Table 57: Oceania LEO Satellite Market Revenue (billion) Forecast, by Application 2020 & 2033
- Table 58: Rest of Asia Pacific LEO Satellite Market Revenue (billion) Forecast, by Application 2020 & 2033
Frequently Asked Questions
1. What is the projected Compound Annual Growth Rate (CAGR) of the LEO Satellite Market?
The projected CAGR is approximately 11.9%.
2. Which companies are prominent players in the LEO Satellite Market?
Key companies in the market include Space Exploration Technologies Corp, German Orbital Systems, GomSpaceApS, SpaceQuest Ltd, Lockheed Martin Corporation, Airbus SE, Astrocast, Nano Avionics, China Aerospace Science and Technology Corporation (CASC), Surrey Satellite Technology Ltd, ROSCOSMOS, Planet Labs Inc.
3. What are the main segments of the LEO Satellite Market?
The market segments include Application, Satellite Mass, End User, Propulsion Tech.
4. Can you provide details about the market size?
The market size is estimated to be USD 11.81 billion as of 2022.
5. What are some drivers contributing to market growth?
N/A
6. What are the notable trends driving market growth?
North America is driving the market demand with a market share of 85.4% in 2029.
7. Are there any restraints impacting market growth?
N/A
8. Can you provide examples of recent developments in the market?
January 2022: Planet Labs launches 44 SuperDove satellites on SpaceX's Falcon 9 rocketNovember 2021: Planet Labs announced an agreement to acquire VanderSat, a Dutch company that provides data on Earth surface conditions, like soil moisture and land surface temperature, by combining public satellite data with proprietary algorithms, for about $28 million.January 2021: In January 2021, 5 Astrocast satellites were launched to collect and downlink data from weather buoys, wellhead sensors, pollution monitors, and other remote stations.
9. What pricing options are available for accessing the report?
Pricing options include single-user, multi-user, and enterprise licenses priced at USD 3800, USD 4500, and USD 5800 respectively.
10. Is the market size provided in terms of value or volume?
The market size is provided in terms of value, measured in billion.
11. Are there any specific market keywords associated with the report?
Yes, the market keyword associated with the report is "LEO Satellite Market," which aids in identifying and referencing the specific market segment covered.
12. How do I determine which pricing option suits my needs best?
The pricing options vary based on user requirements and access needs. Individual users may opt for single-user licenses, while businesses requiring broader access may choose multi-user or enterprise licenses for cost-effective access to the report.
13. Are there any additional resources or data provided in the LEO Satellite Market report?
While the report offers comprehensive insights, it's advisable to review the specific contents or supplementary materials provided to ascertain if additional resources or data are available.
14. How can I stay updated on further developments or reports in the LEO Satellite Market?
To stay informed about further developments, trends, and reports in the LEO Satellite Market, consider subscribing to industry newsletters, following relevant companies and organizations, or regularly checking reputable industry news sources and publications.
Methodology
Step 1 - Identification of Relevant Samples Size from Population Database


Step 2 - Approaches for Defining Global Market Size (Value, Volume* & Price*)

Note*: In applicable scenarios
Step 3 - Data Sources
Primary Research
- Web Analytics
- Survey Reports
- Research Institute
- Latest Research Reports
- Opinion Leaders
Secondary Research
- Annual Reports
- White Paper
- Latest Press Release
- Industry Association
- Paid Database
- Investor Presentations

Step 4 - Data Triangulation
Involves using different sources of information in order to increase the validity of a study
These sources are likely to be stakeholders in a program - participants, other researchers, program staff, other community members, and so on.
Then we put all data in single framework & apply various statistical tools to find out the dynamic on the market.
During the analysis stage, feedback from the stakeholder groups would be compared to determine areas of agreement as well as areas of divergence