

Key Insights
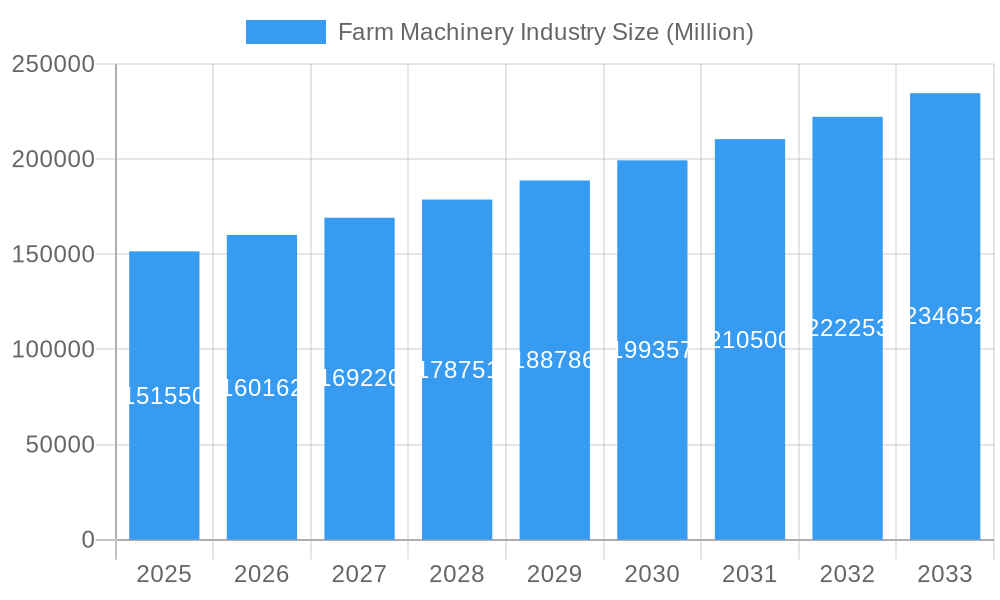
The global farm machinery market, valued at $151.55 billion in 2025, is projected to experience robust growth, exhibiting a Compound Annual Growth Rate (CAGR) of 5.40% from 2025 to 2033. This expansion is driven by several key factors. Increasing global population necessitates higher agricultural output, fueling demand for efficient farm machinery. Technological advancements, such as precision farming techniques and automation, are enhancing productivity and reducing labor costs, further stimulating market growth. Government initiatives promoting agricultural modernization and sustainable farming practices in various regions also contribute significantly. The market is segmented by machinery type (tractors – encompassing compact utility, utility, and row crop tractors – and plowing/cultivating machinery) and horsepower, reflecting diverse farming needs and scales of operation. Leading players like Deere & Company, Mahindra & Mahindra Limited, and Kubota Corporation are driving innovation and expanding their market share through strategic partnerships, acquisitions, and technological advancements. The Asia-Pacific region, particularly India and China, is expected to witness significant growth due to expanding agricultural land and rising farmer income. However, challenges such as high initial investment costs for advanced machinery and fluctuating commodity prices could potentially restrain market growth in certain segments and regions.
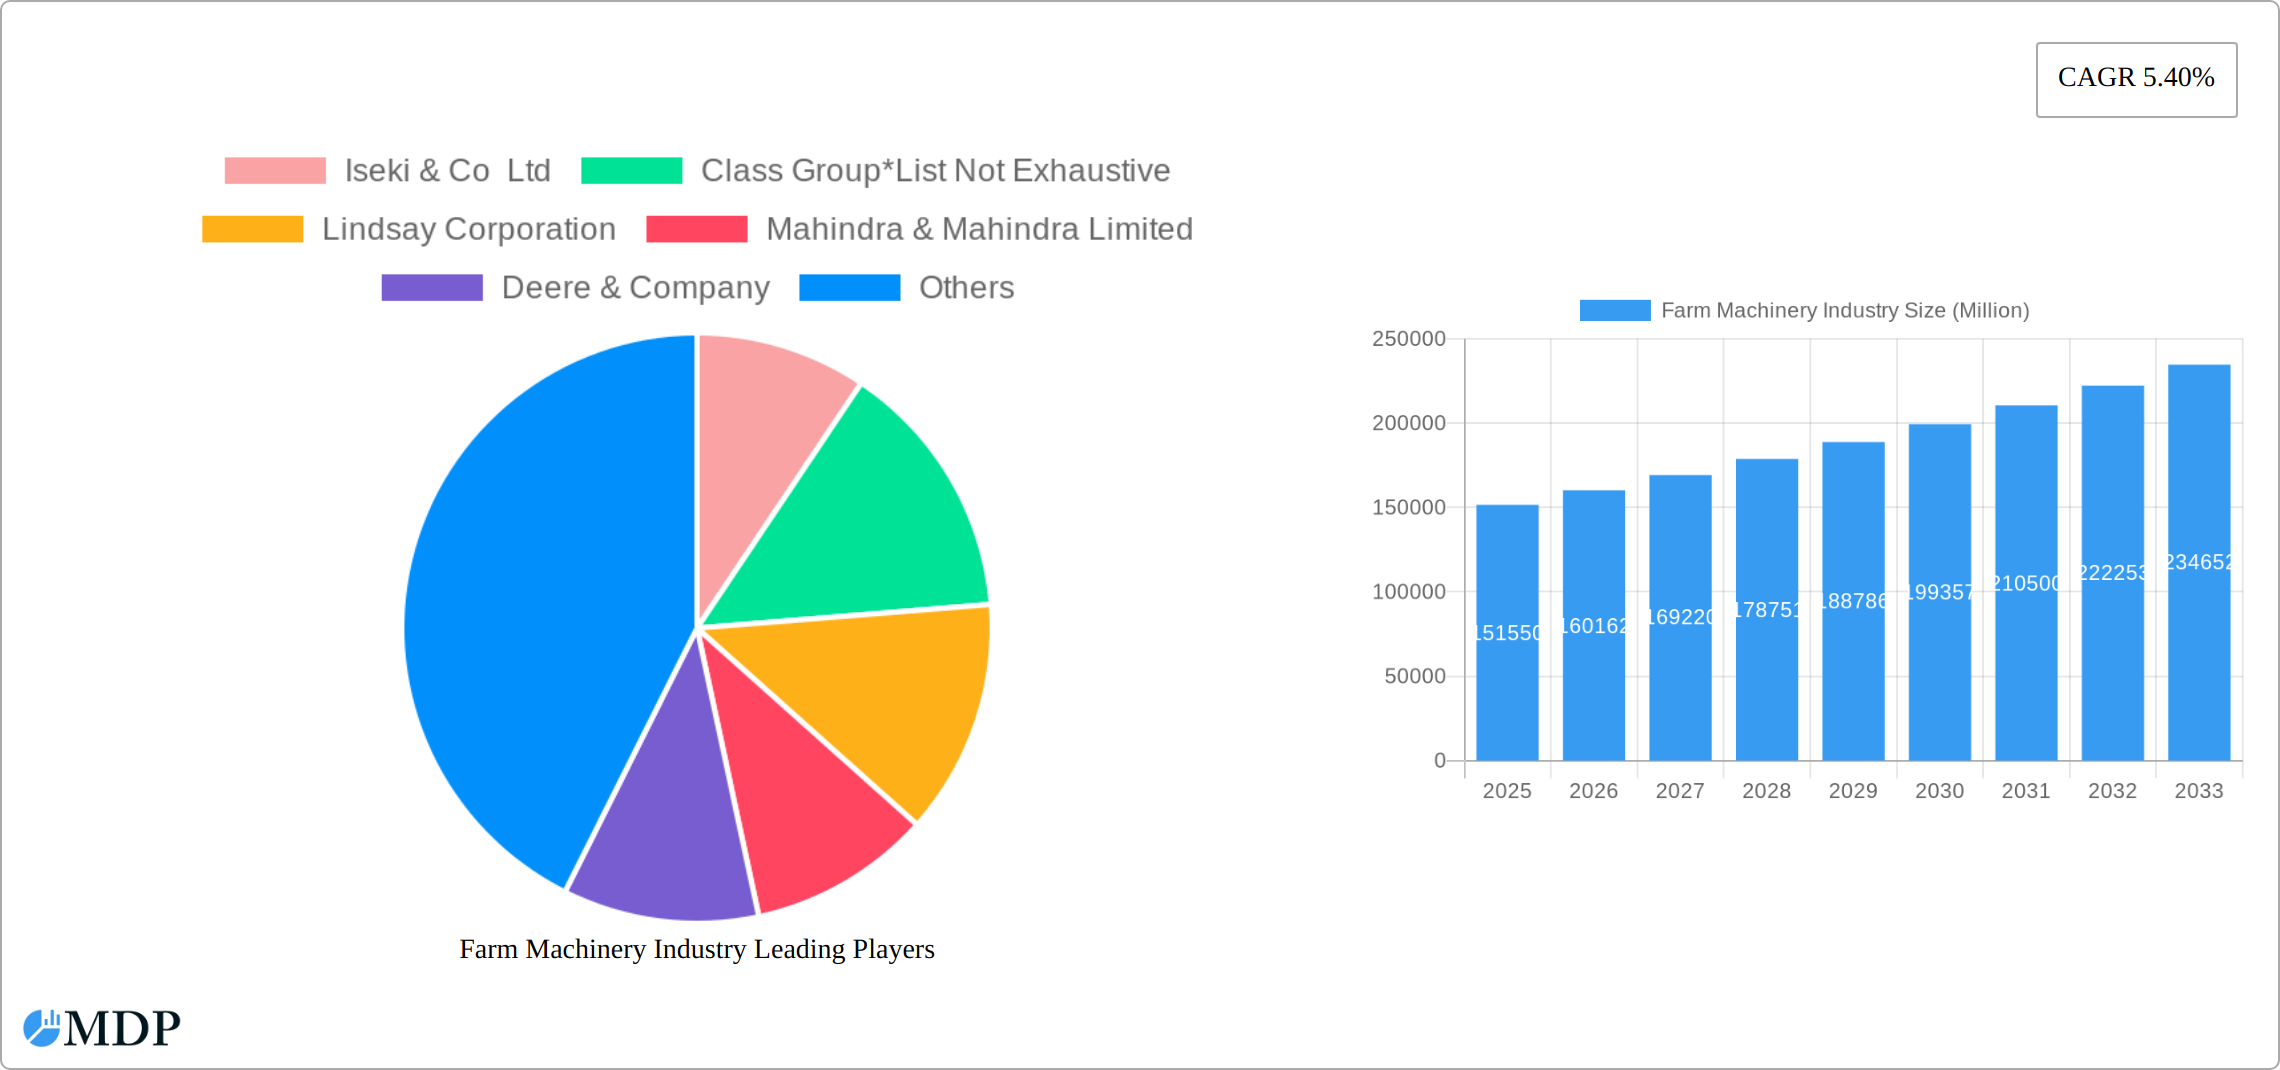
Farm Machinery Industry Market Size (In Billion)
While the North American market currently holds a significant share, the Asia-Pacific region is poised for substantial growth, driven by increasing agricultural intensification and government support for agricultural modernization in countries like India and China. Europe also maintains a substantial market presence, with a focus on high-efficiency and sustainable farming practices. Market segmentation by horsepower reveals a growing preference for higher horsepower tractors in large-scale farming operations, especially in regions with vast arable land. The ongoing trend toward precision agriculture and the increasing adoption of data-driven farming techniques are expected to further propel the market's growth trajectory in the coming years. Furthermore, the growing focus on sustainable agriculture and environmentally friendly farming practices will likely shape product development and market strategies in the years to come. Competition among major players is intense, leading to continuous product innovation and strategic partnerships to capture market share.
Farm Machinery Industry Company Market Share
Farm Machinery Industry Market Report: 2019-2033
This comprehensive report provides a detailed analysis of the global farm machinery industry, offering invaluable insights for stakeholders, investors, and industry professionals. The report covers the period 2019-2033, with a focus on the forecast period 2025-2033 and a base year of 2025. Expect in-depth analysis of market dynamics, leading players, technological advancements, and future growth prospects. The market is valued at $xx Million in 2025 and is projected to reach $xx Million by 2033, exhibiting a CAGR of xx%.
Farm Machinery Industry Market Dynamics & Concentration
The global farm machinery market exhibits a moderately concentrated landscape, with several key players commanding significant market share. While precise figures vary, estimates suggest the top 5 players hold approximately [Insert Updated Percentage]% of the market, indicating a competitive yet consolidated environment. Driving this market is a relentless focus on innovation, with substantial R&D investments fueling the development of cutting-edge technologies such as autonomous machinery, precision farming solutions, and sustainable agricultural practices. Stringent regulatory frameworks, encompassing emission standards and safety regulations, profoundly influence market dynamics. While limited, product substitutes exist in the form of manual labor and older, less efficient equipment. However, the escalating cost of labor and the burgeoning demand for increased productivity are powerful catalysts for the adoption of modern farm machinery. End-user trends reveal a clear preference for technologically advanced, fuel-efficient, and environmentally responsible equipment.
Mergers and acquisitions (M&A) activity within the sector remains moderate, with [Insert Updated Number] major deals recorded over the past five years, fostering both consolidation and market expansion. This activity reflects strategic efforts by industry leaders to broaden their product portfolios, enhance their technological capabilities, and gain access to new markets. The competitive landscape is further shaped by factors such as fluctuating commodity prices, economic conditions, and evolving consumer preferences. Furthermore, the increasing focus on data analytics and the Internet of Things (IoT) is transforming how farm machinery is designed, operated, and maintained, creating new opportunities and challenges for industry players.
- Market Concentration: Top 5 players hold approximately [Insert Updated Percentage]% market share.
- Innovation Drivers: Autonomous systems, precision agriculture technologies, sustainable solutions, data analytics, and IoT integration.
- Regulatory Frameworks: Emission standards, safety regulations, government subsidies, and trade policies.
- M&A Activity: [Insert Updated Number] major deals in the past five years.
Farm Machinery Industry Industry Trends & Analysis
The farm machinery industry is experiencing significant transformation driven by technological advancements, evolving consumer preferences, and intensifying competitive pressures. Market growth is fueled by rising global food demand, increasing farm sizes, and the adoption of precision farming techniques. Technological disruptions, including the integration of AI, IoT, and automation, are revolutionizing farm operations, enhancing efficiency, and reducing labor costs. Consumers are increasingly demanding machines with improved fuel efficiency, enhanced precision, and lower environmental impact. The competitive landscape is dynamic, with established players and emerging companies vying for market share through product innovation, strategic partnerships, and geographic expansion. This results in a healthy market with a projected CAGR of xx% from 2025 to 2033, with a market penetration of xx% by 2033.
Leading Markets & Segments in Farm Machinery Industry
North America remains a dominant force in the global farm machinery industry, fueled by large-scale farming operations, high mechanization rates, and supportive government policies. However, significant growth potential is emerging from developing economies in Asia and Latin America, driven by factors such as rising agricultural output, increasing disposable incomes, and government initiatives to modernize agricultural practices. These regions present exciting opportunities for farm machinery manufacturers to expand their reach and capitalize on the increasing demand for efficient and technologically advanced equipment.
Dominant Segments:
- By Type: Tractors (particularly high-horsepower models) constitute the largest segment, followed by plowing and cultivating machinery, harvesting equipment, and planting machinery. The market is also witnessing growth in specialized equipment for specific crops and farming practices.
- By Horsepower: The segment of tractors exceeding 100 HP continues to experience rapid growth, reflecting the trend towards larger-scale farming operations and the need for increased efficiency.
Key Drivers:
- North America: High mechanization rates, large farm sizes, favorable government support, and technological advancements.
- Asia-Pacific: Increasing agricultural land under cultivation, government initiatives to modernize farming practices, and rising disposable incomes.
- Europe: Focus on precision agriculture, sustainable farming technologies, and stringent environmental regulations.
- Latin America: Growing agricultural production, government investments in agricultural infrastructure, and increasing demand for efficient farm machinery.
Farm Machinery Industry Product Developments
Recent product innovations showcase a significant push towards autonomy, precision, and sustainability. The market is witnessing the emergence of autonomous tractors, GPS-guided machinery, electric-powered sprayers, and advanced sensor technologies. These advancements directly address the growing demand for efficient and eco-friendly farming solutions. Key competitive advantages are increasingly centered around superior technology, fuel efficiency, durability, ease of operation, connectivity features, and data-driven insights that enable improved decision-making and optimized farm management.
Key Drivers of Farm Machinery Industry Growth
Technological advancements, particularly in automation and precision agriculture, are the primary drivers of industry growth. Economic factors like rising food demand and increasing farm profitability further fuel market expansion. Supportive government policies and subsidies also play a crucial role. The increasing adoption of precision farming techniques and the demand for efficient, sustainable, and cost-effective machinery are also contributing factors.
Challenges in the Farm Machinery Industry Market
The farm machinery industry faces ongoing challenges, including supply chain disruptions affecting the availability of crucial components and raw materials. Regulatory hurdles, particularly those concerning emissions and safety standards, continue to pose significant challenges. Increasing competition from both established players and new market entrants further complicates the landscape. Economic fluctuations, fluctuating commodity prices, and the need for continuous technological innovation also present considerable headwinds. These factors collectively contribute to a [Insert Updated Percentage]% reduction in projected market value over the next 5 years, highlighting the need for adaptive strategies and innovative solutions.
Emerging Opportunities in Farm Machinery Industry
The long-term growth of the farm machinery industry is driven by several key factors. Technological advancements like AI-powered machinery and data analytics continue to open new avenues, alongside the growing focus on sustainable farming practices. Strategic partnerships between farm machinery manufacturers and technology providers are creating innovative solutions and enhancing efficiency. Expanding into emerging markets with significant agricultural potential presents further opportunities for growth.
Leading Players in the Farm Machinery Industry Sector
Key Milestones in Farm Machinery Industry Industry
- February 2024: John Deere and GUSS Automation unveiled the Electric GUSS, the world's first fully electric autonomous herbicide orchard sprayer. This significantly advances precision agriculture and sustainability.
- February 2024: John Deere launched autonomy-ready tractors, air carts, and weed-sensing sprayers at the Commodity Classic, showcasing a commitment to technological advancement and enhanced productivity.
- February 2024: Mahindra introduced two new tractor models at the National Farm Machinery Show, focusing on improved user experience and enhanced features.
Strategic Outlook for Farm Machinery Industry Market
The future of the farm machinery industry is bright, driven by continued technological advancements, growing global food demand, and the increasing adoption of sustainable agricultural practices. Strategic partnerships, expansion into new markets, and a focus on developing innovative solutions will be key to success. The market is poised for significant growth, presenting lucrative opportunities for industry players.
Farm Machinery Industry Segmentation
- 1. Production Analysis
- 2. Consumption Analysis
- 3. Import Market Analysis (Value & Volume)
- 4. Export Market Analysis (Value & Volume)
- 5. Price Trend Analysis
Farm Machinery Industry Segmentation By Geography
-
1. North America
- 1.1. United States
- 1.2. Canada
- 1.3. Mexico
-
2. South America
- 2.1. Brazil
- 2.2. Argentina
- 2.3. Rest of South America
-
3. Europe
- 3.1. United Kingdom
- 3.2. Germany
- 3.3. France
- 3.4. Italy
- 3.5. Spain
- 3.6. Russia
- 3.7. Benelux
- 3.8. Nordics
- 3.9. Rest of Europe
-
4. Middle East & Africa
- 4.1. Turkey
- 4.2. Israel
- 4.3. GCC
- 4.4. North Africa
- 4.5. South Africa
- 4.6. Rest of Middle East & Africa
-
5. Asia Pacific
- 5.1. China
- 5.2. India
- 5.3. Japan
- 5.4. South Korea
- 5.5. ASEAN
- 5.6. Oceania
- 5.7. Rest of Asia Pacific
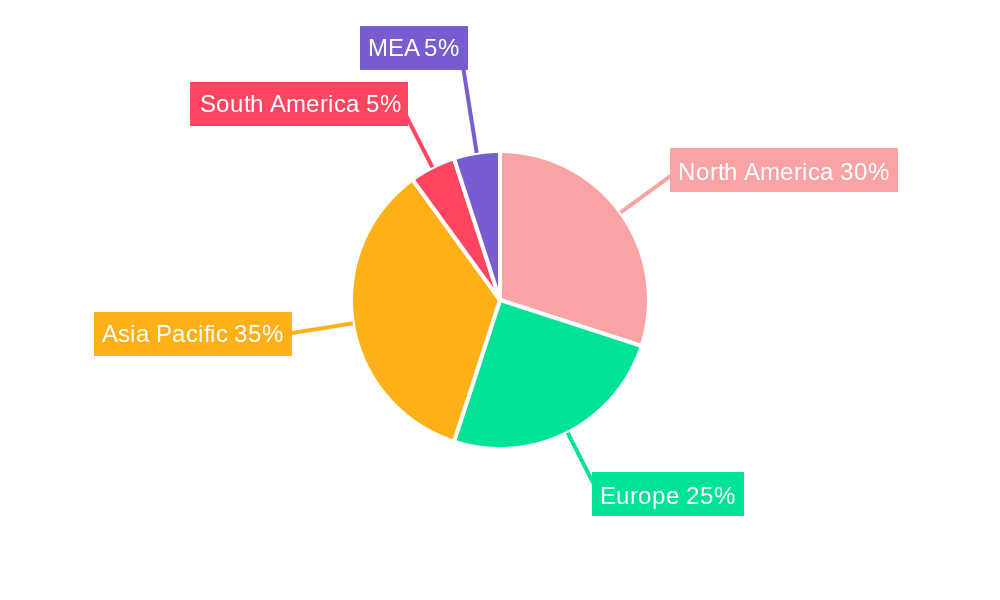
Farm Machinery Industry Regional Market Share
Geographic Coverage of Farm Machinery Industry
Farm Machinery Industry REPORT HIGHLIGHTS
| Aspects | Details |
|---|---|
| Study Period | 2020-2034 |
| Base Year | 2025 |
| Estimated Year | 2026 |
| Forecast Period | 2026-2034 |
| Historical Period | 2020-2025 |
| Growth Rate | CAGR of 5.40% from 2020-2034 |
| Segmentation |
|
Table of Contents
- 1. Introduction
- 1.1. Research Scope
- 1.2. Market Segmentation
- 1.3. Research Methodology
- 1.4. Definitions and Assumptions
- 2. Executive Summary
- 2.1. Introduction
- 3. Market Dynamics
- 3.1. Introduction
- 3.2. Market Drivers
- 3.2.1. Low Availability of Skilled Labor; Technological Advancements
- 3.3. Market Restrains
- 3.3.1. Increasing Farm Expenditure; Security Concerns in Modern Farming Machinery
- 3.4. Market Trends
- 3.4.1. Low Availability of Skilled Labor
- 4. Market Factor Analysis
- 4.1. Porters Five Forces
- 4.2. Supply/Value Chain
- 4.3. PESTEL analysis
- 4.4. Market Entropy
- 4.5. Patent/Trademark Analysis
- 5. Global Farm Machinery Industry Analysis, Insights and Forecast, 2020-2032
- 5.1. Market Analysis, Insights and Forecast - by Production Analysis
- 5.2. Market Analysis, Insights and Forecast - by Consumption Analysis
- 5.3. Market Analysis, Insights and Forecast - by Import Market Analysis (Value & Volume)
- 5.4. Market Analysis, Insights and Forecast - by Export Market Analysis (Value & Volume)
- 5.5. Market Analysis, Insights and Forecast - by Price Trend Analysis
- 5.6. Market Analysis, Insights and Forecast - by Region
- 5.6.1. North America
- 5.6.2. South America
- 5.6.3. Europe
- 5.6.4. Middle East & Africa
- 5.6.5. Asia Pacific
- 5.1. Market Analysis, Insights and Forecast - by Production Analysis
- 6. North America Farm Machinery Industry Analysis, Insights and Forecast, 2020-2032
- 6.1. Market Analysis, Insights and Forecast - by Production Analysis
- 6.2. Market Analysis, Insights and Forecast - by Consumption Analysis
- 6.3. Market Analysis, Insights and Forecast - by Import Market Analysis (Value & Volume)
- 6.4. Market Analysis, Insights and Forecast - by Export Market Analysis (Value & Volume)
- 6.5. Market Analysis, Insights and Forecast - by Price Trend Analysis
- 6.1. Market Analysis, Insights and Forecast - by Production Analysis
- 7. South America Farm Machinery Industry Analysis, Insights and Forecast, 2020-2032
- 7.1. Market Analysis, Insights and Forecast - by Production Analysis
- 7.2. Market Analysis, Insights and Forecast - by Consumption Analysis
- 7.3. Market Analysis, Insights and Forecast - by Import Market Analysis (Value & Volume)
- 7.4. Market Analysis, Insights and Forecast - by Export Market Analysis (Value & Volume)
- 7.5. Market Analysis, Insights and Forecast - by Price Trend Analysis
- 7.1. Market Analysis, Insights and Forecast - by Production Analysis
- 8. Europe Farm Machinery Industry Analysis, Insights and Forecast, 2020-2032
- 8.1. Market Analysis, Insights and Forecast - by Production Analysis
- 8.2. Market Analysis, Insights and Forecast - by Consumption Analysis
- 8.3. Market Analysis, Insights and Forecast - by Import Market Analysis (Value & Volume)
- 8.4. Market Analysis, Insights and Forecast - by Export Market Analysis (Value & Volume)
- 8.5. Market Analysis, Insights and Forecast - by Price Trend Analysis
- 8.1. Market Analysis, Insights and Forecast - by Production Analysis
- 9. Middle East & Africa Farm Machinery Industry Analysis, Insights and Forecast, 2020-2032
- 9.1. Market Analysis, Insights and Forecast - by Production Analysis
- 9.2. Market Analysis, Insights and Forecast - by Consumption Analysis
- 9.3. Market Analysis, Insights and Forecast - by Import Market Analysis (Value & Volume)
- 9.4. Market Analysis, Insights and Forecast - by Export Market Analysis (Value & Volume)
- 9.5. Market Analysis, Insights and Forecast - by Price Trend Analysis
- 9.1. Market Analysis, Insights and Forecast - by Production Analysis
- 10. Asia Pacific Farm Machinery Industry Analysis, Insights and Forecast, 2020-2032
- 10.1. Market Analysis, Insights and Forecast - by Production Analysis
- 10.2. Market Analysis, Insights and Forecast - by Consumption Analysis
- 10.3. Market Analysis, Insights and Forecast - by Import Market Analysis (Value & Volume)
- 10.4. Market Analysis, Insights and Forecast - by Export Market Analysis (Value & Volume)
- 10.5. Market Analysis, Insights and Forecast - by Price Trend Analysis
- 10.1. Market Analysis, Insights and Forecast - by Production Analysis
- 11. Competitive Analysis
- 11.1. Global Market Share Analysis 2025
- 11.2. Company Profiles
- 11.2.1 Iseki & Co Ltd
- 11.2.1.1. Overview
- 11.2.1.2. Products
- 11.2.1.3. SWOT Analysis
- 11.2.1.4. Recent Developments
- 11.2.1.5. Financials (Based on Availability)
- 11.2.2 Class Group*List Not Exhaustive
- 11.2.2.1. Overview
- 11.2.2.2. Products
- 11.2.2.3. SWOT Analysis
- 11.2.2.4. Recent Developments
- 11.2.2.5. Financials (Based on Availability)
- 11.2.3 Lindsay Corporation
- 11.2.3.1. Overview
- 11.2.3.2. Products
- 11.2.3.3. SWOT Analysis
- 11.2.3.4. Recent Developments
- 11.2.3.5. Financials (Based on Availability)
- 11.2.4 Mahindra & Mahindra Limited
- 11.2.4.1. Overview
- 11.2.4.2. Products
- 11.2.4.3. SWOT Analysis
- 11.2.4.4. Recent Developments
- 11.2.4.5. Financials (Based on Availability)
- 11.2.5 Deere & Company
- 11.2.5.1. Overview
- 11.2.5.2. Products
- 11.2.5.3. SWOT Analysis
- 11.2.5.4. Recent Developments
- 11.2.5.5. Financials (Based on Availability)
- 11.2.6 Daedong Industrial Co Ltd
- 11.2.6.1. Overview
- 11.2.6.2. Products
- 11.2.6.3. SWOT Analysis
- 11.2.6.4. Recent Developments
- 11.2.6.5. Financials (Based on Availability)
- 11.2.7 CNH Industrial NV
- 11.2.7.1. Overview
- 11.2.7.2. Products
- 11.2.7.3. SWOT Analysis
- 11.2.7.4. Recent Developments
- 11.2.7.5. Financials (Based on Availability)
- 11.2.8 Kubota Corporation
- 11.2.8.1. Overview
- 11.2.8.2. Products
- 11.2.8.3. SWOT Analysis
- 11.2.8.4. Recent Developments
- 11.2.8.5. Financials (Based on Availability)
- 11.2.9 JC Bamford Excavators Limited
- 11.2.9.1. Overview
- 11.2.9.2. Products
- 11.2.9.3. SWOT Analysis
- 11.2.9.4. Recent Developments
- 11.2.9.5. Financials (Based on Availability)
- 11.2.10 AGCO Corporation
- 11.2.10.1. Overview
- 11.2.10.2. Products
- 11.2.10.3. SWOT Analysis
- 11.2.10.4. Recent Developments
- 11.2.10.5. Financials (Based on Availability)
- 11.2.1 Iseki & Co Ltd
List of Figures
- Figure 1: Global Farm Machinery Industry Revenue Breakdown (Million, %) by Region 2025 & 2033
- Figure 2: North America Farm Machinery Industry Revenue (Million), by Production Analysis 2025 & 2033
- Figure 3: North America Farm Machinery Industry Revenue Share (%), by Production Analysis 2025 & 2033
- Figure 4: North America Farm Machinery Industry Revenue (Million), by Consumption Analysis 2025 & 2033
- Figure 5: North America Farm Machinery Industry Revenue Share (%), by Consumption Analysis 2025 & 2033
- Figure 6: North America Farm Machinery Industry Revenue (Million), by Import Market Analysis (Value & Volume) 2025 & 2033
- Figure 7: North America Farm Machinery Industry Revenue Share (%), by Import Market Analysis (Value & Volume) 2025 & 2033
- Figure 8: North America Farm Machinery Industry Revenue (Million), by Export Market Analysis (Value & Volume) 2025 & 2033
- Figure 9: North America Farm Machinery Industry Revenue Share (%), by Export Market Analysis (Value & Volume) 2025 & 2033
- Figure 10: North America Farm Machinery Industry Revenue (Million), by Price Trend Analysis 2025 & 2033
- Figure 11: North America Farm Machinery Industry Revenue Share (%), by Price Trend Analysis 2025 & 2033
- Figure 12: North America Farm Machinery Industry Revenue (Million), by Country 2025 & 2033
- Figure 13: North America Farm Machinery Industry Revenue Share (%), by Country 2025 & 2033
- Figure 14: South America Farm Machinery Industry Revenue (Million), by Production Analysis 2025 & 2033
- Figure 15: South America Farm Machinery Industry Revenue Share (%), by Production Analysis 2025 & 2033
- Figure 16: South America Farm Machinery Industry Revenue (Million), by Consumption Analysis 2025 & 2033
- Figure 17: South America Farm Machinery Industry Revenue Share (%), by Consumption Analysis 2025 & 2033
- Figure 18: South America Farm Machinery Industry Revenue (Million), by Import Market Analysis (Value & Volume) 2025 & 2033
- Figure 19: South America Farm Machinery Industry Revenue Share (%), by Import Market Analysis (Value & Volume) 2025 & 2033
- Figure 20: South America Farm Machinery Industry Revenue (Million), by Export Market Analysis (Value & Volume) 2025 & 2033
- Figure 21: South America Farm Machinery Industry Revenue Share (%), by Export Market Analysis (Value & Volume) 2025 & 2033
- Figure 22: South America Farm Machinery Industry Revenue (Million), by Price Trend Analysis 2025 & 2033
- Figure 23: South America Farm Machinery Industry Revenue Share (%), by Price Trend Analysis 2025 & 2033
- Figure 24: South America Farm Machinery Industry Revenue (Million), by Country 2025 & 2033
- Figure 25: South America Farm Machinery Industry Revenue Share (%), by Country 2025 & 2033
- Figure 26: Europe Farm Machinery Industry Revenue (Million), by Production Analysis 2025 & 2033
- Figure 27: Europe Farm Machinery Industry Revenue Share (%), by Production Analysis 2025 & 2033
- Figure 28: Europe Farm Machinery Industry Revenue (Million), by Consumption Analysis 2025 & 2033
- Figure 29: Europe Farm Machinery Industry Revenue Share (%), by Consumption Analysis 2025 & 2033
- Figure 30: Europe Farm Machinery Industry Revenue (Million), by Import Market Analysis (Value & Volume) 2025 & 2033
- Figure 31: Europe Farm Machinery Industry Revenue Share (%), by Import Market Analysis (Value & Volume) 2025 & 2033
- Figure 32: Europe Farm Machinery Industry Revenue (Million), by Export Market Analysis (Value & Volume) 2025 & 2033
- Figure 33: Europe Farm Machinery Industry Revenue Share (%), by Export Market Analysis (Value & Volume) 2025 & 2033
- Figure 34: Europe Farm Machinery Industry Revenue (Million), by Price Trend Analysis 2025 & 2033
- Figure 35: Europe Farm Machinery Industry Revenue Share (%), by Price Trend Analysis 2025 & 2033
- Figure 36: Europe Farm Machinery Industry Revenue (Million), by Country 2025 & 2033
- Figure 37: Europe Farm Machinery Industry Revenue Share (%), by Country 2025 & 2033
- Figure 38: Middle East & Africa Farm Machinery Industry Revenue (Million), by Production Analysis 2025 & 2033
- Figure 39: Middle East & Africa Farm Machinery Industry Revenue Share (%), by Production Analysis 2025 & 2033
- Figure 40: Middle East & Africa Farm Machinery Industry Revenue (Million), by Consumption Analysis 2025 & 2033
- Figure 41: Middle East & Africa Farm Machinery Industry Revenue Share (%), by Consumption Analysis 2025 & 2033
- Figure 42: Middle East & Africa Farm Machinery Industry Revenue (Million), by Import Market Analysis (Value & Volume) 2025 & 2033
- Figure 43: Middle East & Africa Farm Machinery Industry Revenue Share (%), by Import Market Analysis (Value & Volume) 2025 & 2033
- Figure 44: Middle East & Africa Farm Machinery Industry Revenue (Million), by Export Market Analysis (Value & Volume) 2025 & 2033
- Figure 45: Middle East & Africa Farm Machinery Industry Revenue Share (%), by Export Market Analysis (Value & Volume) 2025 & 2033
- Figure 46: Middle East & Africa Farm Machinery Industry Revenue (Million), by Price Trend Analysis 2025 & 2033
- Figure 47: Middle East & Africa Farm Machinery Industry Revenue Share (%), by Price Trend Analysis 2025 & 2033
- Figure 48: Middle East & Africa Farm Machinery Industry Revenue (Million), by Country 2025 & 2033
- Figure 49: Middle East & Africa Farm Machinery Industry Revenue Share (%), by Country 2025 & 2033
- Figure 50: Asia Pacific Farm Machinery Industry Revenue (Million), by Production Analysis 2025 & 2033
- Figure 51: Asia Pacific Farm Machinery Industry Revenue Share (%), by Production Analysis 2025 & 2033
- Figure 52: Asia Pacific Farm Machinery Industry Revenue (Million), by Consumption Analysis 2025 & 2033
- Figure 53: Asia Pacific Farm Machinery Industry Revenue Share (%), by Consumption Analysis 2025 & 2033
- Figure 54: Asia Pacific Farm Machinery Industry Revenue (Million), by Import Market Analysis (Value & Volume) 2025 & 2033
- Figure 55: Asia Pacific Farm Machinery Industry Revenue Share (%), by Import Market Analysis (Value & Volume) 2025 & 2033
- Figure 56: Asia Pacific Farm Machinery Industry Revenue (Million), by Export Market Analysis (Value & Volume) 2025 & 2033
- Figure 57: Asia Pacific Farm Machinery Industry Revenue Share (%), by Export Market Analysis (Value & Volume) 2025 & 2033
- Figure 58: Asia Pacific Farm Machinery Industry Revenue (Million), by Price Trend Analysis 2025 & 2033
- Figure 59: Asia Pacific Farm Machinery Industry Revenue Share (%), by Price Trend Analysis 2025 & 2033
- Figure 60: Asia Pacific Farm Machinery Industry Revenue (Million), by Country 2025 & 2033
- Figure 61: Asia Pacific Farm Machinery Industry Revenue Share (%), by Country 2025 & 2033
List of Tables
- Table 1: Global Farm Machinery Industry Revenue Million Forecast, by Production Analysis 2020 & 2033
- Table 2: Global Farm Machinery Industry Revenue Million Forecast, by Consumption Analysis 2020 & 2033
- Table 3: Global Farm Machinery Industry Revenue Million Forecast, by Import Market Analysis (Value & Volume) 2020 & 2033
- Table 4: Global Farm Machinery Industry Revenue Million Forecast, by Export Market Analysis (Value & Volume) 2020 & 2033
- Table 5: Global Farm Machinery Industry Revenue Million Forecast, by Price Trend Analysis 2020 & 2033
- Table 6: Global Farm Machinery Industry Revenue Million Forecast, by Region 2020 & 2033
- Table 7: Global Farm Machinery Industry Revenue Million Forecast, by Production Analysis 2020 & 2033
- Table 8: Global Farm Machinery Industry Revenue Million Forecast, by Consumption Analysis 2020 & 2033
- Table 9: Global Farm Machinery Industry Revenue Million Forecast, by Import Market Analysis (Value & Volume) 2020 & 2033
- Table 10: Global Farm Machinery Industry Revenue Million Forecast, by Export Market Analysis (Value & Volume) 2020 & 2033
- Table 11: Global Farm Machinery Industry Revenue Million Forecast, by Price Trend Analysis 2020 & 2033
- Table 12: Global Farm Machinery Industry Revenue Million Forecast, by Country 2020 & 2033
- Table 13: United States Farm Machinery Industry Revenue (Million) Forecast, by Application 2020 & 2033
- Table 14: Canada Farm Machinery Industry Revenue (Million) Forecast, by Application 2020 & 2033
- Table 15: Mexico Farm Machinery Industry Revenue (Million) Forecast, by Application 2020 & 2033
- Table 16: Global Farm Machinery Industry Revenue Million Forecast, by Production Analysis 2020 & 2033
- Table 17: Global Farm Machinery Industry Revenue Million Forecast, by Consumption Analysis 2020 & 2033
- Table 18: Global Farm Machinery Industry Revenue Million Forecast, by Import Market Analysis (Value & Volume) 2020 & 2033
- Table 19: Global Farm Machinery Industry Revenue Million Forecast, by Export Market Analysis (Value & Volume) 2020 & 2033
- Table 20: Global Farm Machinery Industry Revenue Million Forecast, by Price Trend Analysis 2020 & 2033
- Table 21: Global Farm Machinery Industry Revenue Million Forecast, by Country 2020 & 2033
- Table 22: Brazil Farm Machinery Industry Revenue (Million) Forecast, by Application 2020 & 2033
- Table 23: Argentina Farm Machinery Industry Revenue (Million) Forecast, by Application 2020 & 2033
- Table 24: Rest of South America Farm Machinery Industry Revenue (Million) Forecast, by Application 2020 & 2033
- Table 25: Global Farm Machinery Industry Revenue Million Forecast, by Production Analysis 2020 & 2033
- Table 26: Global Farm Machinery Industry Revenue Million Forecast, by Consumption Analysis 2020 & 2033
- Table 27: Global Farm Machinery Industry Revenue Million Forecast, by Import Market Analysis (Value & Volume) 2020 & 2033
- Table 28: Global Farm Machinery Industry Revenue Million Forecast, by Export Market Analysis (Value & Volume) 2020 & 2033
- Table 29: Global Farm Machinery Industry Revenue Million Forecast, by Price Trend Analysis 2020 & 2033
- Table 30: Global Farm Machinery Industry Revenue Million Forecast, by Country 2020 & 2033
- Table 31: United Kingdom Farm Machinery Industry Revenue (Million) Forecast, by Application 2020 & 2033
- Table 32: Germany Farm Machinery Industry Revenue (Million) Forecast, by Application 2020 & 2033
- Table 33: France Farm Machinery Industry Revenue (Million) Forecast, by Application 2020 & 2033
- Table 34: Italy Farm Machinery Industry Revenue (Million) Forecast, by Application 2020 & 2033
- Table 35: Spain Farm Machinery Industry Revenue (Million) Forecast, by Application 2020 & 2033
- Table 36: Russia Farm Machinery Industry Revenue (Million) Forecast, by Application 2020 & 2033
- Table 37: Benelux Farm Machinery Industry Revenue (Million) Forecast, by Application 2020 & 2033
- Table 38: Nordics Farm Machinery Industry Revenue (Million) Forecast, by Application 2020 & 2033
- Table 39: Rest of Europe Farm Machinery Industry Revenue (Million) Forecast, by Application 2020 & 2033
- Table 40: Global Farm Machinery Industry Revenue Million Forecast, by Production Analysis 2020 & 2033
- Table 41: Global Farm Machinery Industry Revenue Million Forecast, by Consumption Analysis 2020 & 2033
- Table 42: Global Farm Machinery Industry Revenue Million Forecast, by Import Market Analysis (Value & Volume) 2020 & 2033
- Table 43: Global Farm Machinery Industry Revenue Million Forecast, by Export Market Analysis (Value & Volume) 2020 & 2033
- Table 44: Global Farm Machinery Industry Revenue Million Forecast, by Price Trend Analysis 2020 & 2033
- Table 45: Global Farm Machinery Industry Revenue Million Forecast, by Country 2020 & 2033
- Table 46: Turkey Farm Machinery Industry Revenue (Million) Forecast, by Application 2020 & 2033
- Table 47: Israel Farm Machinery Industry Revenue (Million) Forecast, by Application 2020 & 2033
- Table 48: GCC Farm Machinery Industry Revenue (Million) Forecast, by Application 2020 & 2033
- Table 49: North Africa Farm Machinery Industry Revenue (Million) Forecast, by Application 2020 & 2033
- Table 50: South Africa Farm Machinery Industry Revenue (Million) Forecast, by Application 2020 & 2033
- Table 51: Rest of Middle East & Africa Farm Machinery Industry Revenue (Million) Forecast, by Application 2020 & 2033
- Table 52: Global Farm Machinery Industry Revenue Million Forecast, by Production Analysis 2020 & 2033
- Table 53: Global Farm Machinery Industry Revenue Million Forecast, by Consumption Analysis 2020 & 2033
- Table 54: Global Farm Machinery Industry Revenue Million Forecast, by Import Market Analysis (Value & Volume) 2020 & 2033
- Table 55: Global Farm Machinery Industry Revenue Million Forecast, by Export Market Analysis (Value & Volume) 2020 & 2033
- Table 56: Global Farm Machinery Industry Revenue Million Forecast, by Price Trend Analysis 2020 & 2033
- Table 57: Global Farm Machinery Industry Revenue Million Forecast, by Country 2020 & 2033
- Table 58: China Farm Machinery Industry Revenue (Million) Forecast, by Application 2020 & 2033
- Table 59: India Farm Machinery Industry Revenue (Million) Forecast, by Application 2020 & 2033
- Table 60: Japan Farm Machinery Industry Revenue (Million) Forecast, by Application 2020 & 2033
- Table 61: South Korea Farm Machinery Industry Revenue (Million) Forecast, by Application 2020 & 2033
- Table 62: ASEAN Farm Machinery Industry Revenue (Million) Forecast, by Application 2020 & 2033
- Table 63: Oceania Farm Machinery Industry Revenue (Million) Forecast, by Application 2020 & 2033
- Table 64: Rest of Asia Pacific Farm Machinery Industry Revenue (Million) Forecast, by Application 2020 & 2033
Frequently Asked Questions
1. What is the projected Compound Annual Growth Rate (CAGR) of the Farm Machinery Industry?
The projected CAGR is approximately 5.40%.
2. Which companies are prominent players in the Farm Machinery Industry?
Key companies in the market include Iseki & Co Ltd, Class Group*List Not Exhaustive, Lindsay Corporation, Mahindra & Mahindra Limited, Deere & Company, Daedong Industrial Co Ltd, CNH Industrial NV, Kubota Corporation, JC Bamford Excavators Limited, AGCO Corporation.
3. What are the main segments of the Farm Machinery Industry?
The market segments include Production Analysis, Consumption Analysis, Import Market Analysis (Value & Volume), Export Market Analysis (Value & Volume), Price Trend Analysis.
4. Can you provide details about the market size?
The market size is estimated to be USD 151.55 Million as of 2022.
5. What are some drivers contributing to market growth?
Low Availability of Skilled Labor; Technological Advancements.
6. What are the notable trends driving market growth?
Low Availability of Skilled Labor.
7. Are there any restraints impacting market growth?
Increasing Farm Expenditure; Security Concerns in Modern Farming Machinery.
8. Can you provide examples of recent developments in the market?
February 2024: John Deere and GUSS Automation unveiled the Electric GUSS, the world's first fully electric autonomous herbicide orchard sprayer. This innovative machine allows growers to control multiple sprayers remotely and features a sport spraying weed detection system that reduces herbicide use and increases sustainability. Electric gas is a significant development in precision agriculture.
9. What pricing options are available for accessing the report?
Pricing options include single-user, multi-user, and enterprise licenses priced at USD 4750, USD 5250, and USD 8750 respectively.
10. Is the market size provided in terms of value or volume?
The market size is provided in terms of value, measured in Million.
11. Are there any specific market keywords associated with the report?
Yes, the market keyword associated with the report is "Farm Machinery Industry," which aids in identifying and referencing the specific market segment covered.
12. How do I determine which pricing option suits my needs best?
The pricing options vary based on user requirements and access needs. Individual users may opt for single-user licenses, while businesses requiring broader access may choose multi-user or enterprise licenses for cost-effective access to the report.
13. Are there any additional resources or data provided in the Farm Machinery Industry report?
While the report offers comprehensive insights, it's advisable to review the specific contents or supplementary materials provided to ascertain if additional resources or data are available.
14. How can I stay updated on further developments or reports in the Farm Machinery Industry?
To stay informed about further developments, trends, and reports in the Farm Machinery Industry, consider subscribing to industry newsletters, following relevant companies and organizations, or regularly checking reputable industry news sources and publications.
Methodology
Step 1 - Identification of Relevant Samples Size from Population Database


Step 2 - Approaches for Defining Global Market Size (Value, Volume* & Price*)

Note*: In applicable scenarios
Step 3 - Data Sources
Primary Research
- Web Analytics
- Survey Reports
- Research Institute
- Latest Research Reports
- Opinion Leaders
Secondary Research
- Annual Reports
- White Paper
- Latest Press Release
- Industry Association
- Paid Database
- Investor Presentations

Step 4 - Data Triangulation
Involves using different sources of information in order to increase the validity of a study
These sources are likely to be stakeholders in a program - participants, other researchers, program staff, other community members, and so on.
Then we put all data in single framework & apply various statistical tools to find out the dynamic on the market.
During the analysis stage, feedback from the stakeholder groups would be compared to determine areas of agreement as well as areas of divergence