

Key Insights
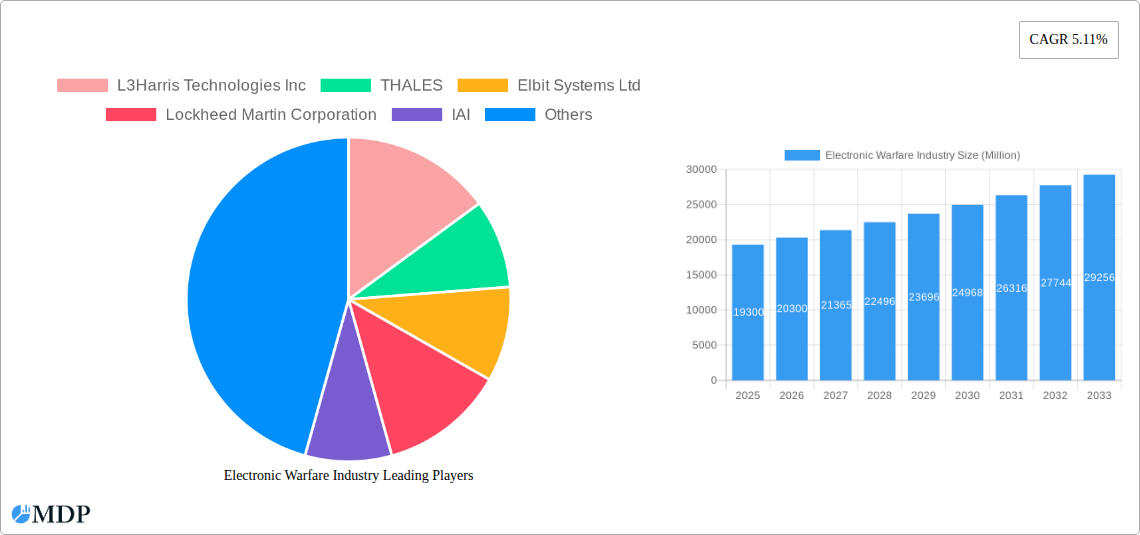
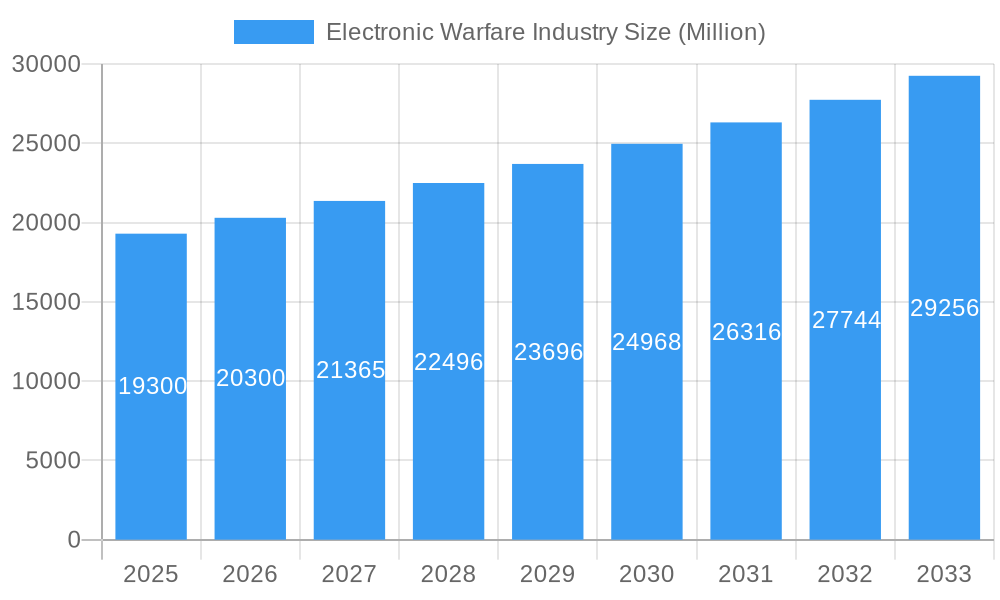
The Electronic Warfare (EW) market, valued at $19.30 billion in 2025, is poised for robust growth, exhibiting a Compound Annual Growth Rate (CAGR) of 5.11% from 2025 to 2033. This expansion is driven by escalating geopolitical tensions, the increasing sophistication of military technologies, and a growing need for advanced defense systems across various platforms – air, land, sea, and space. The market is segmented by capability (Electronic Attack, Electronic Protection, Electronic Support) and platform, reflecting the diverse applications of EW systems. Key drivers include the modernization of existing defense fleets, the development of autonomous weapon systems requiring robust EW countermeasures, and the rising demand for cybersecurity solutions to protect critical infrastructure against electronic threats. Government investments in research and development, particularly in areas like artificial intelligence (AI) and machine learning (ML) integrated into EW systems, further fuel this growth. However, the high cost of EW technology and the complexity of integrating these systems into existing defense platforms represent significant restraints. Competition among leading players like L3Harris Technologies Inc., Thales, Elbit Systems Ltd., and Lockheed Martin Corporation, is intense, driving innovation and pushing technological advancements. Regional variations exist, with North America and Europe currently dominating the market, but the Asia-Pacific region is expected to witness significant growth in the coming years fueled by increased military spending and modernization efforts in countries like China and India.
Electronic Warfare Industry Market Size (In Billion)
The forecast period from 2025 to 2033 suggests continued market expansion, with Electronic Attack capabilities witnessing higher demand driven by asymmetric warfare scenarios and the increasing use of drones and other unmanned aerial vehicles. The Electronic Protection segment is also expected to grow significantly as nations prioritize safeguarding their assets from electronic attacks. The development and deployment of advanced EW technologies, including directed energy weapons and AI-powered countermeasures, will reshape the market landscape. Growth will also be influenced by factors such as technological advancements, evolving defense budgets of major global powers, and the emergence of new geopolitical threats. The market's future trajectory will be a complex interplay of technological innovation, geopolitical dynamics, and the evolving defense strategies of nations worldwide.
Electronic Warfare Industry Company Market Share
Electronic Warfare Industry: A Comprehensive Market Report (2019-2033)
This in-depth report provides a comprehensive analysis of the Electronic Warfare (EW) industry, offering crucial insights for stakeholders seeking to navigate this dynamic market. From market size and leading players to technological advancements and future growth prospects, this report covers all essential aspects of the EW landscape. The study period spans 2019-2033, with a base year of 2025 and a forecast period of 2025-2033. The report is invaluable for strategic planning, investment decisions, and competitive analysis within the EW sector. The market size in 2025 is estimated at $xx Million, and is projected to reach $xx Million by 2033, exhibiting a CAGR of xx%.
Electronic Warfare Industry Market Dynamics & Concentration
The global Electronic Warfare market is characterized by a moderately concentrated landscape, with key players holding significant market share. In 2025, the top 5 companies—L3Harris Technologies Inc, THALES, Lockheed Martin Corporation, RTX Corporation, and BAE Systems plc—are estimated to collectively hold approximately 55% of the market. This concentration is driven by significant R&D investments, extensive product portfolios, and strong global presence. However, the market also shows potential for increased competition from smaller, specialized players, particularly in niche segments like space-based EW.
Innovation Drivers:
- Rapid advancements in AI, machine learning, and sensor technologies.
- Growing demand for advanced EW systems in both defense and commercial applications.
- Increased focus on developing cyber-resilient EW solutions.
Regulatory Frameworks & Product Substitutes:
Stringent export controls and regulations influence market dynamics, while the emergence of advanced communication jamming technologies poses a constant challenge to existing EW systems. The market is witnessing increased M&A activity, with xx major deals recorded between 2019 and 2024. This consolidation reflects the industry’s drive to achieve economies of scale and expand technological capabilities.
End-User Trends:
The increasing adoption of EW systems across various platforms (Air, Sea, Land, Space) drives market growth. Governments' prioritization of national security and defense modernization fuels demand for sophisticated EW capabilities.
Electronic Warfare Industry Industry Trends & Analysis
The Electronic Warfare market is experiencing robust growth, fueled by escalating geopolitical tensions and the rising demand for advanced defense systems. Technological disruptions, such as the integration of Artificial Intelligence (AI) and advanced signal processing techniques, are reshaping the competitive landscape. Consumer preferences are shifting towards more compact, versatile, and easily integrable EW solutions.
The market's growth is primarily driven by the increasing need for robust electronic protection against sophisticated threats. The adoption of electronic attack and support systems is also contributing significantly to market expansion. The CAGR for the forecast period (2025-2033) is projected to be xx%, indicating strong growth potential. Market penetration is currently estimated at xx% and is expected to increase to xx% by 2033 due to the increasing adoption of EW systems by both military and civilian sectors. The competitive dynamics are characterized by intense R&D activities, strategic partnerships, and the continuous development of new and improved EW technologies.
Leading Markets & Segments in Electronic Warfare Industry
Dominant Regions/Segments:
The North American region currently dominates the EW market, driven by substantial defense budgets and robust technological advancements. However, the Asia-Pacific region is witnessing rapid growth, fueled by increasing military modernization efforts and the rise of regional conflicts.
Capability Segments:
- Electronic Attack: This segment holds the largest market share, driven by the increasing need for effective countermeasures against sophisticated enemy systems. Key drivers include:
- Growing demand for advanced jamming and deception technologies.
- Increased investments in cyber warfare capabilities.
- Electronic Protection: This segment is experiencing significant growth due to the rising need to safeguard critical infrastructure and military assets from electronic attacks.
- Electronic Support: This segment is crucial for situational awareness and intelligence gathering, leading to consistent demand.
Platform Segments:
- Air: The air platform segment dominates due to the significant integration of EW systems in modern fighter jets and airborne surveillance platforms.
- Land: The land platform segment demonstrates significant growth due to the increased demand for EW systems in ground-based defense systems.
- Sea: The sea platform segment is experiencing moderate growth, driven by the need for electronic protection of naval vessels.
- Space: This segment is emerging as a key growth area, driven by the increasing reliance on satellite-based communication and navigation systems.
Electronic Warfare Industry Product Developments
Recent product innovations focus on miniaturization, increased power efficiency, and the integration of AI-powered algorithms for improved threat detection and response. These advancements cater to the evolving needs of modern warfare, offering enhanced situational awareness, improved target discrimination, and greater countermeasure effectiveness. The integration of advanced software-defined radio (SDR) technologies allows for greater flexibility and adaptability of EW systems, enhancing their operational effectiveness. Companies are increasingly focusing on developing modular and scalable systems that can be easily adapted to various platforms and operational requirements.
Key Drivers of Electronic Warfare Industry Growth
Technological advancements in areas such as AI, machine learning, and high-frequency electronics are significantly driving market growth. Furthermore, the increasing need for robust cybersecurity and the rising global demand for advanced defense systems contribute to the expansion of the EW market. Favorable government policies and increasing defense budgets further stimulate growth in this sector. Specific examples include the development of advanced radar jamming technologies and AI-driven signal processing for improved threat detection.
Challenges in the Electronic Warfare Industry Market
The Electronic Warfare industry faces challenges such as stringent regulatory hurdles regarding the export of advanced EW technologies, which limit market expansion in some regions. Supply chain disruptions and complexities in the procurement process can also negatively impact the market. Furthermore, intense competition from established players and emerging companies leads to price pressures and the need for continuous innovation. The estimated impact of these challenges on market growth is around xx% per annum.
Emerging Opportunities in Electronic Warfare Industry
The integration of artificial intelligence and machine learning into EW systems presents significant long-term growth opportunities. Strategic partnerships between defense contractors and technology companies are fostering innovation and accelerating the development of new EW capabilities. The expansion of the EW market into new applications, such as cybersecurity and commercial sectors, offers promising avenues for future growth.
Leading Players in the Electronic Warfare Industry Sector
Key Milestones in Electronic Warfare Industry Industry
- 2020: Successful testing of AI-powered electronic warfare system by Lockheed Martin.
- 2021: Launch of a new generation of electronic protection systems by Thales.
- 2022: Strategic partnership between L3Harris and a leading AI company for advanced EW solutions.
- 2023: Acquisition of a smaller EW company by BAE Systems, expanding its product portfolio.
- 2024: Successful deployment of space-based EW system by a major defense contractor.
Strategic Outlook for Electronic Warfare Industry Market
The Electronic Warfare market is poised for continued growth, driven by advancements in AI, the integration of advanced sensors, and the increasing demand for advanced defense solutions. Strategic partnerships and investments in R&D will further accelerate market expansion. Companies that adapt to emerging technologies and successfully navigate regulatory hurdles are best positioned to capitalize on the significant growth opportunities within this sector.
Electronic Warfare Industry Segmentation
-
1. Capability
- 1.1. Electronic Attack
- 1.2. Electronic Protection
- 1.3. Electronic Support
-
2. Platform
- 2.1. Air
- 2.2. Sea
- 2.3. Land
- 2.4. Space
Electronic Warfare Industry Segmentation By Geography
-
1. North America
- 1.1. United States
- 1.2. Canda
-
2. Europe
- 2.1. United Kingdom
- 2.2. Germany
- 2.3. France
- 2.4. Russia
- 2.5. Rest of Europe
-
3. Asia Pacific
- 3.1. China
- 3.2. India
- 3.3. Japan
- 3.4. South Korea
- 3.5. Rest of Asia Pacific
-
4. Latin America
- 4.1. Brazil
- 4.2. Mexico
- 4.3. Rest of Latin America
-
5. Middle East and Africa
- 5.1. Saudi Arabia
- 5.2. United Arab Emirates
- 5.3. Rest of Middle East and Africa
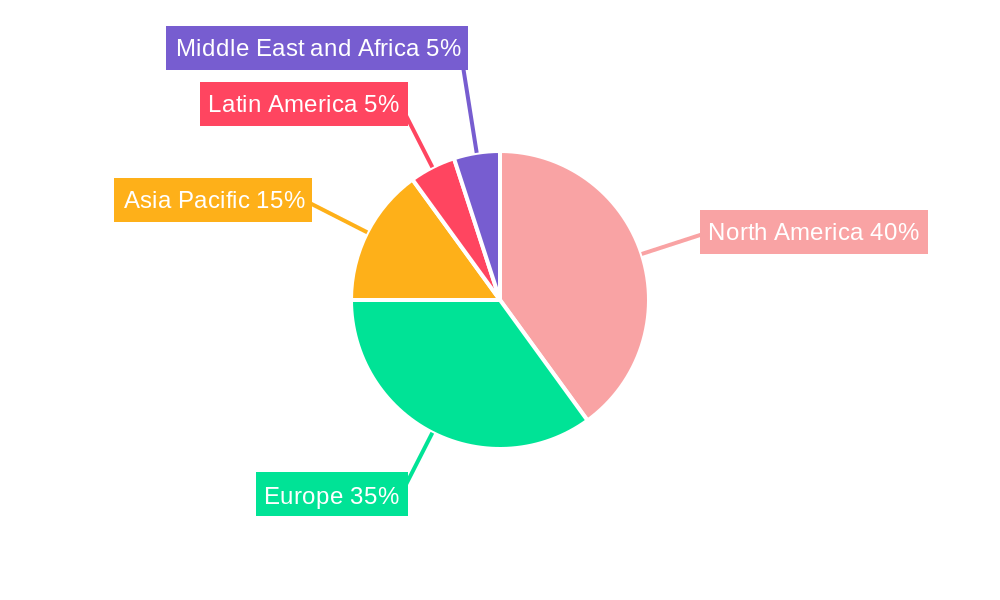
Electronic Warfare Industry Regional Market Share
Geographic Coverage of Electronic Warfare Industry
Electronic Warfare Industry REPORT HIGHLIGHTS
| Aspects | Details |
|---|---|
| Study Period | 2020-2034 |
| Base Year | 2025 |
| Estimated Year | 2026 |
| Forecast Period | 2026-2034 |
| Historical Period | 2020-2025 |
| Growth Rate | CAGR of 5.11% from 2020-2034 |
| Segmentation |
|
Table of Contents
- 1. Introduction
- 1.1. Research Scope
- 1.2. Market Segmentation
- 1.3. Research Objective
- 1.4. Definitions and Assumptions
- 2. Executive Summary
- 2.1. Market Snapshot
- 3. Market Dynamics
- 3.1. Market Drivers
- 3.2. Market Restrains
- 3.3. Market Trends
- 3.4. Market Opportunities
- 4. Market Factor Analysis
- 4.1. Porters Five Forces
- 4.1.1. Bargaining Power of Suppliers
- 4.1.2. Bargaining Power of Buyers
- 4.1.3. Threat of New Entrants
- 4.1.4. Threat of Substitutes
- 4.1.5. Competitive Rivalry
- 4.2. PESTEL analysis
- 4.3. BCG Analysis
- 4.3.1. Stars (High Growth, High Market Share)
- 4.3.2. Cash Cows (Low Growth, High Market Share)
- 4.3.3. Question Mark (High Growth, Low Market Share)
- 4.3.4. Dogs (Low Growth, Low Market Share)
- 4.4. Ansoff Matrix Analysis
- 4.5. Supply Chain Analysis
- 4.6. Regulatory Landscape
- 4.7. Current Market Potential and Opportunity Assessment (TAM–SAM–SOM Framework)
- 4.8. MDP Analyst Note
- 4.1. Porters Five Forces
- 5. Market Analysis, Insights and Forecast 2021-2033
- 5.1. Market Analysis, Insights and Forecast - by Capability
- 5.1.1. Electronic Attack
- 5.1.2. Electronic Protection
- 5.1.3. Electronic Support
- 5.2. Market Analysis, Insights and Forecast - by Platform
- 5.2.1. Air
- 5.2.2. Sea
- 5.2.3. Land
- 5.2.4. Space
- 5.3. Market Analysis, Insights and Forecast - by Region
- 5.3.1. North America
- 5.3.2. Europe
- 5.3.3. Asia Pacific
- 5.3.4. Latin America
- 5.3.5. Middle East and Africa
- 5.1. Market Analysis, Insights and Forecast - by Capability
- 6. Global Electronic Warfare Industry Analysis, Insights and Forecast, 2021-2033
- 6.1. Market Analysis, Insights and Forecast - by Capability
- 6.1.1. Electronic Attack
- 6.1.2. Electronic Protection
- 6.1.3. Electronic Support
- 6.2. Market Analysis, Insights and Forecast - by Platform
- 6.2.1. Air
- 6.2.2. Sea
- 6.2.3. Land
- 6.2.4. Space
- 6.1. Market Analysis, Insights and Forecast - by Capability
- 7. North America Electronic Warfare Industry Analysis, Insights and Forecast, 2020-2032
- 7.1. Market Analysis, Insights and Forecast - by Capability
- 7.1.1. Electronic Attack
- 7.1.2. Electronic Protection
- 7.1.3. Electronic Support
- 7.2. Market Analysis, Insights and Forecast - by Platform
- 7.2.1. Air
- 7.2.2. Sea
- 7.2.3. Land
- 7.2.4. Space
- 7.1. Market Analysis, Insights and Forecast - by Capability
- 8. Europe Electronic Warfare Industry Analysis, Insights and Forecast, 2020-2032
- 8.1. Market Analysis, Insights and Forecast - by Capability
- 8.1.1. Electronic Attack
- 8.1.2. Electronic Protection
- 8.1.3. Electronic Support
- 8.2. Market Analysis, Insights and Forecast - by Platform
- 8.2.1. Air
- 8.2.2. Sea
- 8.2.3. Land
- 8.2.4. Space
- 8.1. Market Analysis, Insights and Forecast - by Capability
- 9. Asia Pacific Electronic Warfare Industry Analysis, Insights and Forecast, 2020-2032
- 9.1. Market Analysis, Insights and Forecast - by Capability
- 9.1.1. Electronic Attack
- 9.1.2. Electronic Protection
- 9.1.3. Electronic Support
- 9.2. Market Analysis, Insights and Forecast - by Platform
- 9.2.1. Air
- 9.2.2. Sea
- 9.2.3. Land
- 9.2.4. Space
- 9.1. Market Analysis, Insights and Forecast - by Capability
- 10. Latin America Electronic Warfare Industry Analysis, Insights and Forecast, 2020-2032
- 10.1. Market Analysis, Insights and Forecast - by Capability
- 10.1.1. Electronic Attack
- 10.1.2. Electronic Protection
- 10.1.3. Electronic Support
- 10.2. Market Analysis, Insights and Forecast - by Platform
- 10.2.1. Air
- 10.2.2. Sea
- 10.2.3. Land
- 10.2.4. Space
- 10.1. Market Analysis, Insights and Forecast - by Capability
- 11. Middle East and Africa Electronic Warfare Industry Analysis, Insights and Forecast, 2020-2032
- 11.1. Market Analysis, Insights and Forecast - by Capability
- 11.1.1. Electronic Attack
- 11.1.2. Electronic Protection
- 11.1.3. Electronic Support
- 11.2. Market Analysis, Insights and Forecast - by Platform
- 11.2.1. Air
- 11.2.2. Sea
- 11.2.3. Land
- 11.2.4. Space
- 11.1. Market Analysis, Insights and Forecast - by Capability
- 12. Competitive Analysis
- 12.1. Company Profiles
- 12.1.1 L3Harris Technologies Inc
- 12.1.1.1. Company Overview
- 12.1.1.2. Products
- 12.1.1.3. Company Financials
- 12.1.1.4. SWOT Analysis
- 12.1.2 THALES
- 12.1.2.1. Company Overview
- 12.1.2.2. Products
- 12.1.2.3. Company Financials
- 12.1.2.4. SWOT Analysis
- 12.1.3 Elbit Systems Ltd
- 12.1.3.1. Company Overview
- 12.1.3.2. Products
- 12.1.3.3. Company Financials
- 12.1.3.4. SWOT Analysis
- 12.1.4 Lockheed Martin Corporation
- 12.1.4.1. Company Overview
- 12.1.4.2. Products
- 12.1.4.3. Company Financials
- 12.1.4.4. SWOT Analysis
- 12.1.5 IAI
- 12.1.5.1. Company Overview
- 12.1.5.2. Products
- 12.1.5.3. Company Financials
- 12.1.5.4. SWOT Analysis
- 12.1.6 RTX Corporation
- 12.1.6.1. Company Overview
- 12.1.6.2. Products
- 12.1.6.3. Company Financials
- 12.1.6.4. SWOT Analysis
- 12.1.7 ASELSAN A S
- 12.1.7.1. Company Overview
- 12.1.7.2. Products
- 12.1.7.3. Company Financials
- 12.1.7.4. SWOT Analysis
- 12.1.8 Leonardo S p A
- 12.1.8.1. Company Overview
- 12.1.8.2. Products
- 12.1.8.3. Company Financials
- 12.1.8.4. SWOT Analysis
- 12.1.9 BAE Systems plc
- 12.1.9.1. Company Overview
- 12.1.9.2. Products
- 12.1.9.3. Company Financials
- 12.1.9.4. SWOT Analysis
- 12.1.10 Northrop Grumman Corporation
- 12.1.10.1. Company Overview
- 12.1.10.2. Products
- 12.1.10.3. Company Financials
- 12.1.10.4. SWOT Analysis
- 12.1.11 Saab AB
- 12.1.11.1. Company Overview
- 12.1.11.2. Products
- 12.1.11.3. Company Financials
- 12.1.11.4. SWOT Analysis
- 12.1.12 HENSOLDT A
- 12.1.12.1. Company Overview
- 12.1.12.2. Products
- 12.1.12.3. Company Financials
- 12.1.12.4. SWOT Analysis
- 12.1.1 L3Harris Technologies Inc
- 12.2. Market Entropy
- 12.2.1 Company's Key Areas Served
- 12.2.2 Recent Developments
- 12.3. Company Market Share Analysis 2025
- 12.3.1 Top 5 Companies Market Share Analysis
- 12.3.2 Top 3 Companies Market Share Analysis
- 12.4. List of Potential Customers
- 13. Research Methodology
List of Figures
- Figure 1: Global Electronic Warfare Industry Revenue Breakdown (Million, %) by Region 2025 & 2033
- Figure 2: North America Electronic Warfare Industry Revenue (Million), by Capability 2025 & 2033
- Figure 3: North America Electronic Warfare Industry Revenue Share (%), by Capability 2025 & 2033
- Figure 4: North America Electronic Warfare Industry Revenue (Million), by Platform 2025 & 2033
- Figure 5: North America Electronic Warfare Industry Revenue Share (%), by Platform 2025 & 2033
- Figure 6: North America Electronic Warfare Industry Revenue (Million), by Country 2025 & 2033
- Figure 7: North America Electronic Warfare Industry Revenue Share (%), by Country 2025 & 2033
- Figure 8: Europe Electronic Warfare Industry Revenue (Million), by Capability 2025 & 2033
- Figure 9: Europe Electronic Warfare Industry Revenue Share (%), by Capability 2025 & 2033
- Figure 10: Europe Electronic Warfare Industry Revenue (Million), by Platform 2025 & 2033
- Figure 11: Europe Electronic Warfare Industry Revenue Share (%), by Platform 2025 & 2033
- Figure 12: Europe Electronic Warfare Industry Revenue (Million), by Country 2025 & 2033
- Figure 13: Europe Electronic Warfare Industry Revenue Share (%), by Country 2025 & 2033
- Figure 14: Asia Pacific Electronic Warfare Industry Revenue (Million), by Capability 2025 & 2033
- Figure 15: Asia Pacific Electronic Warfare Industry Revenue Share (%), by Capability 2025 & 2033
- Figure 16: Asia Pacific Electronic Warfare Industry Revenue (Million), by Platform 2025 & 2033
- Figure 17: Asia Pacific Electronic Warfare Industry Revenue Share (%), by Platform 2025 & 2033
- Figure 18: Asia Pacific Electronic Warfare Industry Revenue (Million), by Country 2025 & 2033
- Figure 19: Asia Pacific Electronic Warfare Industry Revenue Share (%), by Country 2025 & 2033
- Figure 20: Latin America Electronic Warfare Industry Revenue (Million), by Capability 2025 & 2033
- Figure 21: Latin America Electronic Warfare Industry Revenue Share (%), by Capability 2025 & 2033
- Figure 22: Latin America Electronic Warfare Industry Revenue (Million), by Platform 2025 & 2033
- Figure 23: Latin America Electronic Warfare Industry Revenue Share (%), by Platform 2025 & 2033
- Figure 24: Latin America Electronic Warfare Industry Revenue (Million), by Country 2025 & 2033
- Figure 25: Latin America Electronic Warfare Industry Revenue Share (%), by Country 2025 & 2033
- Figure 26: Middle East and Africa Electronic Warfare Industry Revenue (Million), by Capability 2025 & 2033
- Figure 27: Middle East and Africa Electronic Warfare Industry Revenue Share (%), by Capability 2025 & 2033
- Figure 28: Middle East and Africa Electronic Warfare Industry Revenue (Million), by Platform 2025 & 2033
- Figure 29: Middle East and Africa Electronic Warfare Industry Revenue Share (%), by Platform 2025 & 2033
- Figure 30: Middle East and Africa Electronic Warfare Industry Revenue (Million), by Country 2025 & 2033
- Figure 31: Middle East and Africa Electronic Warfare Industry Revenue Share (%), by Country 2025 & 2033
List of Tables
- Table 1: Global Electronic Warfare Industry Revenue Million Forecast, by Capability 2020 & 2033
- Table 2: Global Electronic Warfare Industry Revenue Million Forecast, by Platform 2020 & 2033
- Table 3: Global Electronic Warfare Industry Revenue Million Forecast, by Region 2020 & 2033
- Table 4: Global Electronic Warfare Industry Revenue Million Forecast, by Capability 2020 & 2033
- Table 5: Global Electronic Warfare Industry Revenue Million Forecast, by Platform 2020 & 2033
- Table 6: Global Electronic Warfare Industry Revenue Million Forecast, by Country 2020 & 2033
- Table 7: United States Electronic Warfare Industry Revenue (Million) Forecast, by Application 2020 & 2033
- Table 8: Canda Electronic Warfare Industry Revenue (Million) Forecast, by Application 2020 & 2033
- Table 9: Global Electronic Warfare Industry Revenue Million Forecast, by Capability 2020 & 2033
- Table 10: Global Electronic Warfare Industry Revenue Million Forecast, by Platform 2020 & 2033
- Table 11: Global Electronic Warfare Industry Revenue Million Forecast, by Country 2020 & 2033
- Table 12: United Kingdom Electronic Warfare Industry Revenue (Million) Forecast, by Application 2020 & 2033
- Table 13: Germany Electronic Warfare Industry Revenue (Million) Forecast, by Application 2020 & 2033
- Table 14: France Electronic Warfare Industry Revenue (Million) Forecast, by Application 2020 & 2033
- Table 15: Russia Electronic Warfare Industry Revenue (Million) Forecast, by Application 2020 & 2033
- Table 16: Rest of Europe Electronic Warfare Industry Revenue (Million) Forecast, by Application 2020 & 2033
- Table 17: Global Electronic Warfare Industry Revenue Million Forecast, by Capability 2020 & 2033
- Table 18: Global Electronic Warfare Industry Revenue Million Forecast, by Platform 2020 & 2033
- Table 19: Global Electronic Warfare Industry Revenue Million Forecast, by Country 2020 & 2033
- Table 20: China Electronic Warfare Industry Revenue (Million) Forecast, by Application 2020 & 2033
- Table 21: India Electronic Warfare Industry Revenue (Million) Forecast, by Application 2020 & 2033
- Table 22: Japan Electronic Warfare Industry Revenue (Million) Forecast, by Application 2020 & 2033
- Table 23: South Korea Electronic Warfare Industry Revenue (Million) Forecast, by Application 2020 & 2033
- Table 24: Rest of Asia Pacific Electronic Warfare Industry Revenue (Million) Forecast, by Application 2020 & 2033
- Table 25: Global Electronic Warfare Industry Revenue Million Forecast, by Capability 2020 & 2033
- Table 26: Global Electronic Warfare Industry Revenue Million Forecast, by Platform 2020 & 2033
- Table 27: Global Electronic Warfare Industry Revenue Million Forecast, by Country 2020 & 2033
- Table 28: Brazil Electronic Warfare Industry Revenue (Million) Forecast, by Application 2020 & 2033
- Table 29: Mexico Electronic Warfare Industry Revenue (Million) Forecast, by Application 2020 & 2033
- Table 30: Rest of Latin America Electronic Warfare Industry Revenue (Million) Forecast, by Application 2020 & 2033
- Table 31: Global Electronic Warfare Industry Revenue Million Forecast, by Capability 2020 & 2033
- Table 32: Global Electronic Warfare Industry Revenue Million Forecast, by Platform 2020 & 2033
- Table 33: Global Electronic Warfare Industry Revenue Million Forecast, by Country 2020 & 2033
- Table 34: Saudi Arabia Electronic Warfare Industry Revenue (Million) Forecast, by Application 2020 & 2033
- Table 35: United Arab Emirates Electronic Warfare Industry Revenue (Million) Forecast, by Application 2020 & 2033
- Table 36: Rest of Middle East and Africa Electronic Warfare Industry Revenue (Million) Forecast, by Application 2020 & 2033
Frequently Asked Questions
1. What is the projected Compound Annual Growth Rate (CAGR) of the Electronic Warfare Industry?
The projected CAGR is approximately 5.11%.
2. Which companies are prominent players in the Electronic Warfare Industry?
Key companies in the market include L3Harris Technologies Inc, THALES, Elbit Systems Ltd, Lockheed Martin Corporation, IAI, RTX Corporation, ASELSAN A S, Leonardo S p A, BAE Systems plc, Northrop Grumman Corporation, Saab AB, HENSOLDT A.
3. What are the main segments of the Electronic Warfare Industry?
The market segments include Capability, Platform.
4. Can you provide details about the market size?
The market size is estimated to be USD 19.30 Million as of 2022.
5. What are some drivers contributing to market growth?
Increase in Internet of Things (IoT) and Autonomous Systems; Rise in Demand for Military and Defense Satellite Communication Solutions.
6. What are the notable trends driving market growth?
Sea Segment Will Showcase Remarkable Growth During the Forecast Period.
7. Are there any restraints impacting market growth?
Cybersecurity Threats to Satellite Communication; Interference in Transmission of Data.
8. Can you provide examples of recent developments in the market?
N/A
9. What pricing options are available for accessing the report?
Pricing options include single-user, multi-user, and enterprise licenses priced at USD 4750, USD 5250, and USD 8750 respectively.
10. Is the market size provided in terms of value or volume?
The market size is provided in terms of value, measured in Million.
11. Are there any specific market keywords associated with the report?
Yes, the market keyword associated with the report is "Electronic Warfare Industry," which aids in identifying and referencing the specific market segment covered.
12. How do I determine which pricing option suits my needs best?
The pricing options vary based on user requirements and access needs. Individual users may opt for single-user licenses, while businesses requiring broader access may choose multi-user or enterprise licenses for cost-effective access to the report.
13. Are there any additional resources or data provided in the Electronic Warfare Industry report?
While the report offers comprehensive insights, it's advisable to review the specific contents or supplementary materials provided to ascertain if additional resources or data are available.
14. How can I stay updated on further developments or reports in the Electronic Warfare Industry?
To stay informed about further developments, trends, and reports in the Electronic Warfare Industry, consider subscribing to industry newsletters, following relevant companies and organizations, or regularly checking reputable industry news sources and publications.
Methodology
Step 1 - Identification of Relevant Samples Size from Population Database


Step 2 - Approaches for Defining Global Market Size (Value, Volume* & Price*)

Note*: In applicable scenarios
Step 3 - Data Sources
Primary Research
- Web Analytics
- Survey Reports
- Research Institute
- Latest Research Reports
- Opinion Leaders
Secondary Research
- Annual Reports
- White Paper
- Latest Press Release
- Industry Association
- Paid Database
- Investor Presentations

Step 4 - Data Triangulation
Involves using different sources of information in order to increase the validity of a study
These sources are likely to be stakeholders in a program - participants, other researchers, program staff, other community members, and so on.
Then we put all data in single framework & apply various statistical tools to find out the dynamic on the market.
During the analysis stage, feedback from the stakeholder groups would be compared to determine areas of agreement as well as areas of divergence