

Key Insights
The electric propulsion systems market is experiencing robust growth, projected to reach \$10.94 billion in 2025 and maintain a Compound Annual Growth Rate (CAGR) of 6.09% from 2025 to 2033. This expansion is driven by several key factors. The increasing demand for energy-efficient and environmentally friendly transportation solutions across airborne, terrestrial, marine, and space applications is a primary catalyst. Government regulations aimed at reducing carbon emissions are further accelerating adoption. Technological advancements, such as improved battery technology and more efficient motor designs, are also contributing to market growth. The market is segmented by type (hybrid and full-electric) and application, with the aerospace sector currently representing a significant portion of the demand, followed by the marine and terrestrial sectors. Competition is intense, with major players like Airbus SE, Safran SA, and Northrop Grumman Corporation alongside innovative companies like Accion Systems and Busek Co Inc. actively developing and deploying advanced electric propulsion systems. The Asia-Pacific region, particularly China and Japan, is expected to demonstrate significant growth owing to substantial investments in electric vehicle infrastructure and the expansion of the aerospace industry.
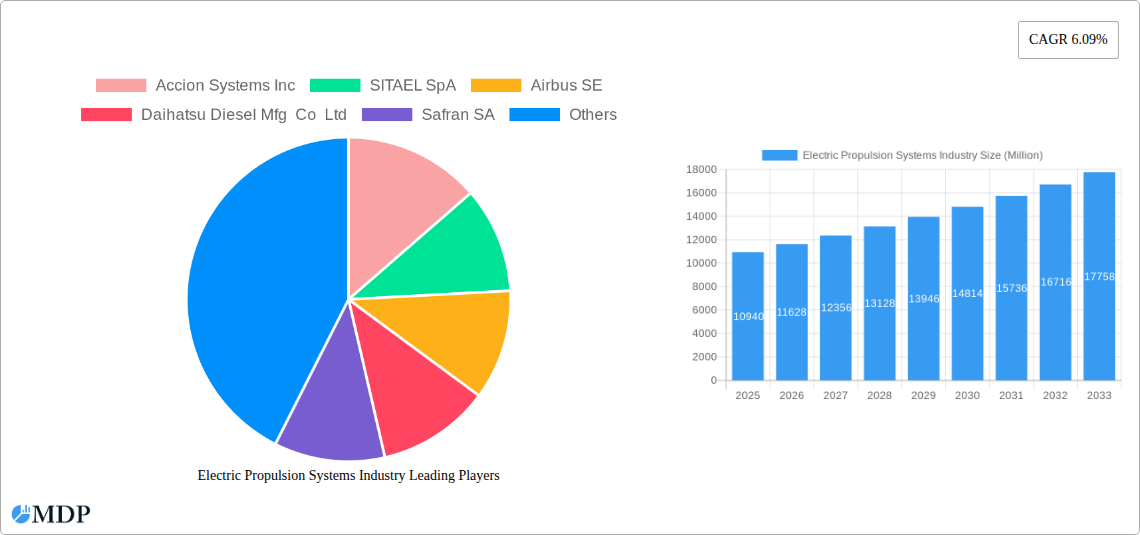
Electric Propulsion Systems Industry Market Size (In Billion)
The future of the electric propulsion systems market looks bright, with several emerging trends shaping its trajectory. The integration of artificial intelligence and machine learning for optimized power management and predictive maintenance is gaining traction. Furthermore, the development of solid-state batteries promises to enhance energy density and safety, driving further market penetration. However, challenges remain, including the high initial cost of electric propulsion systems compared to traditional counterparts and the need for improved charging infrastructure, particularly for terrestrial applications. Despite these hurdles, the long-term prospects for this market remain positive, fueled by the overarching global push toward sustainable transportation and the continued innovation in electric propulsion technology. The market is likely to witness further consolidation as larger companies acquire smaller, specialized firms to enhance their technological capabilities and market reach.
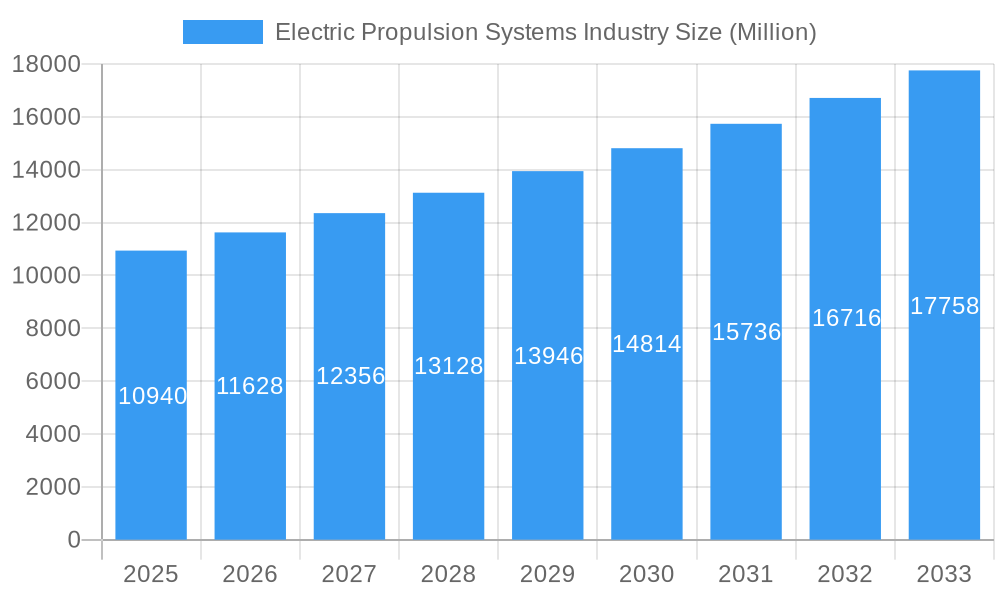
Electric Propulsion Systems Industry Company Market Share
Electric Propulsion Systems Industry: A Comprehensive Market Report (2019-2033)
This in-depth report provides a comprehensive analysis of the Electric Propulsion Systems industry, offering invaluable insights for stakeholders, investors, and industry professionals. Covering the period 2019-2033, with a focus on 2025, this report forecasts significant growth driven by technological advancements and increasing demand across diverse applications. The global market is projected to reach xx Million by 2033, exhibiting a CAGR of xx% during the forecast period (2025-2033).
Electric Propulsion Systems Industry Market Dynamics & Concentration
The electric propulsion systems market is characterized by a moderately concentrated landscape, with key players like Airbus SE, Safran SA, The Boeing Company, and Northrop Grumman Corporation (formerly Orbital ATK) holding significant market share. However, the entry of innovative startups like Accion Systems Inc and Busek Co Inc is increasing competition and fostering innovation. Market concentration is further influenced by ongoing mergers and acquisitions (M&A) activities. Between 2019 and 2024, approximately xx M&A deals were recorded, primarily driven by the need to expand technological capabilities and market reach. Regulatory frameworks, particularly those focused on reducing emissions in the aerospace and marine sectors, are major drivers of market growth. The increasing adoption of electric propulsion systems is fueled by consumer demand for cleaner and more efficient transportation solutions. Substitute technologies, such as traditional combustion engines, are facing increasing pressure due to environmental concerns and rising fuel costs. End-user trends indicate a strong preference for sustainable and cost-effective propulsion systems, further driving market expansion.
- Market Concentration: Moderately concentrated, with a few major players dominating.
- Innovation Drivers: Government regulations, technological advancements, and increasing demand for sustainable solutions.
- Regulatory Frameworks: Stringent emission norms in several sectors are driving adoption.
- Product Substitutes: Traditional combustion engines face growing competition.
- M&A Activity: Significant M&A activity is reshaping the market landscape. xx deals observed in the historical period.
- End-User Trends: Growing preference for electric propulsion for its efficiency and environmental benefits.
Electric Propulsion Systems Industry Industry Trends & Analysis
The electric propulsion systems market is experiencing robust growth, propelled by several key factors. Technological advancements, such as improvements in battery technology and power electronics, are enhancing the performance and efficiency of electric propulsion systems. This, coupled with decreasing costs, is making them increasingly attractive to various sectors. Consumer preference for environmentally friendly technologies is also a major driver, pushing industries to adopt cleaner solutions. The competitive landscape is dynamic, with established players facing competition from innovative startups. This intense competition is fostering innovation and driving down costs. The market is segmented by type (hybrid, full-electric) and application (airborne, terrestrial, marine, space), each exhibiting unique growth trajectories. The market is expected to witness a significant increase in penetration across all segments, particularly in airborne and marine applications due to rising environmental concerns and government regulations. The CAGR for the full-electric segment is projected to be higher than that of the hybrid segment due to advancements in battery technology and increased demand for zero-emission solutions. Market penetration for full electric in the airborne segment is expected to reach xx% by 2033.
Leading Markets & Segments in Electric Propulsion Systems Industry
The airborne segment currently holds the largest market share, driven by the increasing demand for electric vertical takeoff and landing (eVTOL) aircraft and electric propulsion systems in other aviation applications. However, the marine and terrestrial segments are expected to experience significant growth in the coming years, driven by factors such as:
Airborne:
- Key Drivers: Growing demand for eVTOL aircraft, stringent emission regulations, and advancements in battery technology.
- Dominance Analysis: High market share due to the early adoption of electric propulsion in this sector.
Marine:
- Key Drivers: Environmental regulations, the need for reduced emissions in maritime transport, and advancements in electric motor technology.
- Dominance Analysis: Rapid growth expected due to the increasing adoption of electric ferries and other marine vessels.
Terrestrial:
- Key Drivers: Government incentives for electric vehicles, improving battery technology, and advancements in electric motor design.
- Dominance Analysis: Steady growth expected, driven primarily by the increasing adoption of electric buses and trains.
Space:
- Key Drivers: Advancements in electric propulsion technologies for satellite and spacecraft applications. Reduced weight and increased efficiency compared to traditional propulsion systems.
- Dominance Analysis: Steady growth expected as electric propulsion becomes more cost-effective and reliable for various space missions.
The full-electric segment is projected to surpass the hybrid segment in terms of market share due to technological advancements and increasing environmental concerns. North America and Europe are currently the leading markets, driven by supportive government policies and a strong focus on sustainability.
Electric Propulsion Systems Industry Product Developments
Recent product innovations focus on improving efficiency, power density, and reliability of electric propulsion systems. Advancements in motor technology, power electronics, and battery technology are enabling the development of lighter, more compact, and more powerful systems. These advancements are driving broader adoption across various applications, including electric aircraft, marine vessels, and terrestrial vehicles. Companies are also focusing on developing integrated propulsion systems, combining multiple components to offer improved performance and simplified installation. This integration is particularly important for applications where space is limited or weight is a critical factor.
Key Drivers of Electric Propulsion Systems Industry Growth
Several key factors are driving the growth of the electric propulsion systems market. These include:
- Technological Advancements: Improvements in battery technology, electric motors, and power electronics are enhancing the efficiency and performance of electric propulsion systems.
- Stringent Environmental Regulations: Governments worldwide are implementing stricter emission regulations, promoting the adoption of cleaner propulsion technologies.
- Rising Fuel Costs: The increasing cost of fossil fuels is making electric propulsion systems a more cost-effective alternative.
- Government Incentives: Several governments are offering financial incentives to encourage the adoption of electric propulsion technologies.
Challenges in the Electric Propulsion Systems Industry Market
Despite the significant growth potential, the electric propulsion systems market faces certain challenges:
- High Initial Costs: The initial investment for electric propulsion systems is often higher compared to traditional propulsion systems.
- Limited Infrastructure: The lack of adequate charging infrastructure can hinder the widespread adoption of electric vehicles and other electric-powered equipment.
- Battery Life and Performance: The lifespan and performance of batteries are crucial factors affecting the adoption of electric propulsion systems.
- Competition from Traditional Propulsion Systems: Established players offering traditional propulsion systems pose a significant competitive challenge.
Emerging Opportunities in Electric Propulsion Systems Industry
Significant opportunities exist for growth in the electric propulsion systems market. Technological breakthroughs in battery technology and power electronics are expected to further enhance the performance and reduce the cost of electric propulsion systems. Strategic partnerships between established players and innovative startups can foster innovation and accelerate market penetration. The expansion into new markets, particularly in developing countries, offers substantial growth potential.
Leading Players in the Electric Propulsion Systems Industry Sector
- Accion Systems Inc
- SITAEL SpA
- Airbus SE
- Daihatsu Diesel Mfg Co Ltd
- Safran SA
- Aerojet Rocketdyne Holdings Inc
- Northrop Grumman Corporation (formerly Orbital ATK)
- Efficient Drivetrains Inc (Cummins Inc)
- Collins Aerospace (RTX Corporation)
- Busek Co Inc
- Thales Alenia Space
- General Electric Company
- The Boeing Company
Key Milestones in Electric Propulsion Systems Industry Industry
- 2020: Significant advancements in solid-state battery technology.
- 2021: Several major companies announce investments in electric propulsion research and development.
- 2022: Launch of several electric aircraft prototypes.
- 2023: Increased government regulations on emissions in the marine sector.
- 2024: Several M&A deals consolidate market share.
Strategic Outlook for Electric Propulsion Systems Market
The electric propulsion systems market is poised for significant growth in the coming years. Continued technological advancements, supportive government policies, and increasing consumer demand for sustainable transportation solutions will drive market expansion. Strategic partnerships and investments in research and development will be crucial for companies to maintain a competitive edge. The focus on developing efficient, cost-effective, and reliable electric propulsion systems will be vital for capturing a substantial share of this rapidly expanding market. The market is expected to witness substantial growth driven by continuous technological advancements and supportive government policies.
Electric Propulsion Systems Industry Segmentation
- 1. Production Analysis
- 2. Consumption Analysis
- 3. Import Market Analysis (Value & Volume)
- 4. Export Market Analysis (Value & Volume)
- 5. Price Trend Analysis
Electric Propulsion Systems Industry Segmentation By Geography
-
1. North America
- 1.1. United States
- 1.2. Canada
- 1.3. Mexico
-
2. South America
- 2.1. Brazil
- 2.2. Argentina
- 2.3. Rest of South America
-
3. Europe
- 3.1. United Kingdom
- 3.2. Germany
- 3.3. France
- 3.4. Italy
- 3.5. Spain
- 3.6. Russia
- 3.7. Benelux
- 3.8. Nordics
- 3.9. Rest of Europe
-
4. Middle East & Africa
- 4.1. Turkey
- 4.2. Israel
- 4.3. GCC
- 4.4. North Africa
- 4.5. South Africa
- 4.6. Rest of Middle East & Africa
-
5. Asia Pacific
- 5.1. China
- 5.2. India
- 5.3. Japan
- 5.4. South Korea
- 5.5. ASEAN
- 5.6. Oceania
- 5.7. Rest of Asia Pacific
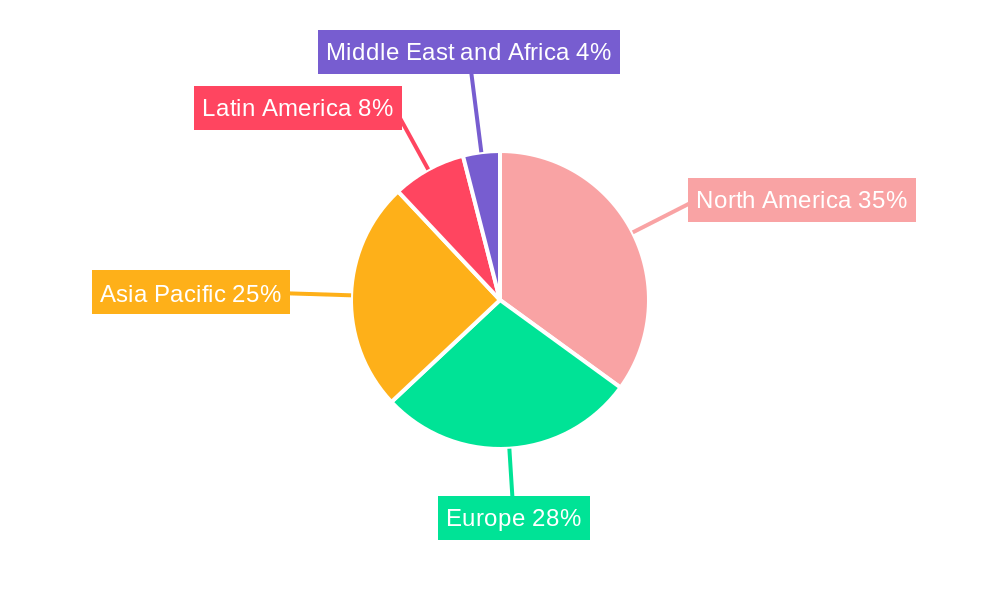
Electric Propulsion Systems Industry Regional Market Share
Geographic Coverage of Electric Propulsion Systems Industry
Electric Propulsion Systems Industry REPORT HIGHLIGHTS
| Aspects | Details |
|---|---|
| Study Period | 2020-2034 |
| Base Year | 2025 |
| Estimated Year | 2026 |
| Forecast Period | 2026-2034 |
| Historical Period | 2020-2025 |
| Growth Rate | CAGR of 6.09% from 2020-2034 |
| Segmentation |
|
Table of Contents
- 1. Introduction
- 1.1. Research Scope
- 1.2. Market Segmentation
- 1.3. Research Objective
- 1.4. Definitions and Assumptions
- 2. Executive Summary
- 2.1. Market Snapshot
- 3. Market Dynamics
- 3.1. Market Drivers
- 3.2. Market Restrains
- 3.3. Market Trends
- 3.4. Market Opportunities
- 4. Market Factor Analysis
- 4.1. Porters Five Forces
- 4.1.1. Bargaining Power of Suppliers
- 4.1.2. Bargaining Power of Buyers
- 4.1.3. Threat of New Entrants
- 4.1.4. Threat of Substitutes
- 4.1.5. Competitive Rivalry
- 4.2. PESTEL analysis
- 4.3. BCG Analysis
- 4.3.1. Stars (High Growth, High Market Share)
- 4.3.2. Cash Cows (Low Growth, High Market Share)
- 4.3.3. Question Mark (High Growth, Low Market Share)
- 4.3.4. Dogs (Low Growth, Low Market Share)
- 4.4. Ansoff Matrix Analysis
- 4.5. Supply Chain Analysis
- 4.6. Regulatory Landscape
- 4.7. Current Market Potential and Opportunity Assessment (TAM–SAM–SOM Framework)
- 4.8. MDP Analyst Note
- 4.1. Porters Five Forces
- 5. Market Analysis, Insights and Forecast 2021-2033
- 5.1. Market Analysis, Insights and Forecast - by Production Analysis
- 5.2. Market Analysis, Insights and Forecast - by Consumption Analysis
- 5.3. Market Analysis, Insights and Forecast - by Import Market Analysis (Value & Volume)
- 5.4. Market Analysis, Insights and Forecast - by Export Market Analysis (Value & Volume)
- 5.5. Market Analysis, Insights and Forecast - by Price Trend Analysis
- 5.6. Market Analysis, Insights and Forecast - by Region
- 5.6.1. North America
- 5.6.2. South America
- 5.6.3. Europe
- 5.6.4. Middle East & Africa
- 5.6.5. Asia Pacific
- 6. Global Electric Propulsion Systems Industry Analysis, Insights and Forecast, 2021-2033
- 6.1. Market Analysis, Insights and Forecast - by Production Analysis
- 6.2. Market Analysis, Insights and Forecast - by Consumption Analysis
- 6.3. Market Analysis, Insights and Forecast - by Import Market Analysis (Value & Volume)
- 6.4. Market Analysis, Insights and Forecast - by Export Market Analysis (Value & Volume)
- 6.5. Market Analysis, Insights and Forecast - by Price Trend Analysis
- 7. North America Electric Propulsion Systems Industry Analysis, Insights and Forecast, 2020-2032
- 7.1. Market Analysis, Insights and Forecast - by Production Analysis
- 7.2. Market Analysis, Insights and Forecast - by Consumption Analysis
- 7.3. Market Analysis, Insights and Forecast - by Import Market Analysis (Value & Volume)
- 7.4. Market Analysis, Insights and Forecast - by Export Market Analysis (Value & Volume)
- 7.5. Market Analysis, Insights and Forecast - by Price Trend Analysis
- 8. South America Electric Propulsion Systems Industry Analysis, Insights and Forecast, 2020-2032
- 8.1. Market Analysis, Insights and Forecast - by Production Analysis
- 8.2. Market Analysis, Insights and Forecast - by Consumption Analysis
- 8.3. Market Analysis, Insights and Forecast - by Import Market Analysis (Value & Volume)
- 8.4. Market Analysis, Insights and Forecast - by Export Market Analysis (Value & Volume)
- 8.5. Market Analysis, Insights and Forecast - by Price Trend Analysis
- 9. Europe Electric Propulsion Systems Industry Analysis, Insights and Forecast, 2020-2032
- 9.1. Market Analysis, Insights and Forecast - by Production Analysis
- 9.2. Market Analysis, Insights and Forecast - by Consumption Analysis
- 9.3. Market Analysis, Insights and Forecast - by Import Market Analysis (Value & Volume)
- 9.4. Market Analysis, Insights and Forecast - by Export Market Analysis (Value & Volume)
- 9.5. Market Analysis, Insights and Forecast - by Price Trend Analysis
- 10. Middle East & Africa Electric Propulsion Systems Industry Analysis, Insights and Forecast, 2020-2032
- 10.1. Market Analysis, Insights and Forecast - by Production Analysis
- 10.2. Market Analysis, Insights and Forecast - by Consumption Analysis
- 10.3. Market Analysis, Insights and Forecast - by Import Market Analysis (Value & Volume)
- 10.4. Market Analysis, Insights and Forecast - by Export Market Analysis (Value & Volume)
- 10.5. Market Analysis, Insights and Forecast - by Price Trend Analysis
- 11. Asia Pacific Electric Propulsion Systems Industry Analysis, Insights and Forecast, 2020-2032
- 11.1. Market Analysis, Insights and Forecast - by Production Analysis
- 11.2. Market Analysis, Insights and Forecast - by Consumption Analysis
- 11.3. Market Analysis, Insights and Forecast - by Import Market Analysis (Value & Volume)
- 11.4. Market Analysis, Insights and Forecast - by Export Market Analysis (Value & Volume)
- 11.5. Market Analysis, Insights and Forecast - by Price Trend Analysis
- 12. Competitive Analysis
- 12.1. Company Profiles
- 12.1.1 Accion Systems Inc
- 12.1.1.1. Company Overview
- 12.1.1.2. Products
- 12.1.1.3. Company Financials
- 12.1.1.4. SWOT Analysis
- 12.1.2 SITAEL SpA
- 12.1.2.1. Company Overview
- 12.1.2.2. Products
- 12.1.2.3. Company Financials
- 12.1.2.4. SWOT Analysis
- 12.1.3 Airbus SE
- 12.1.3.1. Company Overview
- 12.1.3.2. Products
- 12.1.3.3. Company Financials
- 12.1.3.4. SWOT Analysis
- 12.1.4 Daihatsu Diesel Mfg Co Ltd
- 12.1.4.1. Company Overview
- 12.1.4.2. Products
- 12.1.4.3. Company Financials
- 12.1.4.4. SWOT Analysis
- 12.1.5 Safran SA
- 12.1.5.1. Company Overview
- 12.1.5.2. Products
- 12.1.5.3. Company Financials
- 12.1.5.4. SWOT Analysis
- 12.1.6 Aerojet Rocketdyne Holdings Inc
- 12.1.6.1. Company Overview
- 12.1.6.2. Products
- 12.1.6.3. Company Financials
- 12.1.6.4. SWOT Analysis
- 12.1.7 Orbital ATK (Northrop Grumman Corporation)
- 12.1.7.1. Company Overview
- 12.1.7.2. Products
- 12.1.7.3. Company Financials
- 12.1.7.4. SWOT Analysis
- 12.1.8 Efficient Drivetrains Inc (Cummins Inc )
- 12.1.8.1. Company Overview
- 12.1.8.2. Products
- 12.1.8.3. Company Financials
- 12.1.8.4. SWOT Analysis
- 12.1.9 Collins Aerospace (RTX Corporation
- 12.1.9.1. Company Overview
- 12.1.9.2. Products
- 12.1.9.3. Company Financials
- 12.1.9.4. SWOT Analysis
- 12.1.10 Busek Co Inc
- 12.1.10.1. Company Overview
- 12.1.10.2. Products
- 12.1.10.3. Company Financials
- 12.1.10.4. SWOT Analysis
- 12.1.11 Thales Alenia Space
- 12.1.11.1. Company Overview
- 12.1.11.2. Products
- 12.1.11.3. Company Financials
- 12.1.11.4. SWOT Analysis
- 12.1.12 General Electric Company
- 12.1.12.1. Company Overview
- 12.1.12.2. Products
- 12.1.12.3. Company Financials
- 12.1.12.4. SWOT Analysis
- 12.1.13 The Boeing Company
- 12.1.13.1. Company Overview
- 12.1.13.2. Products
- 12.1.13.3. Company Financials
- 12.1.13.4. SWOT Analysis
- 12.1.1 Accion Systems Inc
- 12.2. Market Entropy
- 12.2.1 Company's Key Areas Served
- 12.2.2 Recent Developments
- 12.3. Company Market Share Analysis 2025
- 12.3.1 Top 5 Companies Market Share Analysis
- 12.3.2 Top 3 Companies Market Share Analysis
- 12.4. List of Potential Customers
- 13. Research Methodology
List of Figures
- Figure 1: Global Electric Propulsion Systems Industry Revenue Breakdown (Million, %) by Region 2025 & 2033
- Figure 2: North America Electric Propulsion Systems Industry Revenue (Million), by Production Analysis 2025 & 2033
- Figure 3: North America Electric Propulsion Systems Industry Revenue Share (%), by Production Analysis 2025 & 2033
- Figure 4: North America Electric Propulsion Systems Industry Revenue (Million), by Consumption Analysis 2025 & 2033
- Figure 5: North America Electric Propulsion Systems Industry Revenue Share (%), by Consumption Analysis 2025 & 2033
- Figure 6: North America Electric Propulsion Systems Industry Revenue (Million), by Import Market Analysis (Value & Volume) 2025 & 2033
- Figure 7: North America Electric Propulsion Systems Industry Revenue Share (%), by Import Market Analysis (Value & Volume) 2025 & 2033
- Figure 8: North America Electric Propulsion Systems Industry Revenue (Million), by Export Market Analysis (Value & Volume) 2025 & 2033
- Figure 9: North America Electric Propulsion Systems Industry Revenue Share (%), by Export Market Analysis (Value & Volume) 2025 & 2033
- Figure 10: North America Electric Propulsion Systems Industry Revenue (Million), by Price Trend Analysis 2025 & 2033
- Figure 11: North America Electric Propulsion Systems Industry Revenue Share (%), by Price Trend Analysis 2025 & 2033
- Figure 12: North America Electric Propulsion Systems Industry Revenue (Million), by Country 2025 & 2033
- Figure 13: North America Electric Propulsion Systems Industry Revenue Share (%), by Country 2025 & 2033
- Figure 14: South America Electric Propulsion Systems Industry Revenue (Million), by Production Analysis 2025 & 2033
- Figure 15: South America Electric Propulsion Systems Industry Revenue Share (%), by Production Analysis 2025 & 2033
- Figure 16: South America Electric Propulsion Systems Industry Revenue (Million), by Consumption Analysis 2025 & 2033
- Figure 17: South America Electric Propulsion Systems Industry Revenue Share (%), by Consumption Analysis 2025 & 2033
- Figure 18: South America Electric Propulsion Systems Industry Revenue (Million), by Import Market Analysis (Value & Volume) 2025 & 2033
- Figure 19: South America Electric Propulsion Systems Industry Revenue Share (%), by Import Market Analysis (Value & Volume) 2025 & 2033
- Figure 20: South America Electric Propulsion Systems Industry Revenue (Million), by Export Market Analysis (Value & Volume) 2025 & 2033
- Figure 21: South America Electric Propulsion Systems Industry Revenue Share (%), by Export Market Analysis (Value & Volume) 2025 & 2033
- Figure 22: South America Electric Propulsion Systems Industry Revenue (Million), by Price Trend Analysis 2025 & 2033
- Figure 23: South America Electric Propulsion Systems Industry Revenue Share (%), by Price Trend Analysis 2025 & 2033
- Figure 24: South America Electric Propulsion Systems Industry Revenue (Million), by Country 2025 & 2033
- Figure 25: South America Electric Propulsion Systems Industry Revenue Share (%), by Country 2025 & 2033
- Figure 26: Europe Electric Propulsion Systems Industry Revenue (Million), by Production Analysis 2025 & 2033
- Figure 27: Europe Electric Propulsion Systems Industry Revenue Share (%), by Production Analysis 2025 & 2033
- Figure 28: Europe Electric Propulsion Systems Industry Revenue (Million), by Consumption Analysis 2025 & 2033
- Figure 29: Europe Electric Propulsion Systems Industry Revenue Share (%), by Consumption Analysis 2025 & 2033
- Figure 30: Europe Electric Propulsion Systems Industry Revenue (Million), by Import Market Analysis (Value & Volume) 2025 & 2033
- Figure 31: Europe Electric Propulsion Systems Industry Revenue Share (%), by Import Market Analysis (Value & Volume) 2025 & 2033
- Figure 32: Europe Electric Propulsion Systems Industry Revenue (Million), by Export Market Analysis (Value & Volume) 2025 & 2033
- Figure 33: Europe Electric Propulsion Systems Industry Revenue Share (%), by Export Market Analysis (Value & Volume) 2025 & 2033
- Figure 34: Europe Electric Propulsion Systems Industry Revenue (Million), by Price Trend Analysis 2025 & 2033
- Figure 35: Europe Electric Propulsion Systems Industry Revenue Share (%), by Price Trend Analysis 2025 & 2033
- Figure 36: Europe Electric Propulsion Systems Industry Revenue (Million), by Country 2025 & 2033
- Figure 37: Europe Electric Propulsion Systems Industry Revenue Share (%), by Country 2025 & 2033
- Figure 38: Middle East & Africa Electric Propulsion Systems Industry Revenue (Million), by Production Analysis 2025 & 2033
- Figure 39: Middle East & Africa Electric Propulsion Systems Industry Revenue Share (%), by Production Analysis 2025 & 2033
- Figure 40: Middle East & Africa Electric Propulsion Systems Industry Revenue (Million), by Consumption Analysis 2025 & 2033
- Figure 41: Middle East & Africa Electric Propulsion Systems Industry Revenue Share (%), by Consumption Analysis 2025 & 2033
- Figure 42: Middle East & Africa Electric Propulsion Systems Industry Revenue (Million), by Import Market Analysis (Value & Volume) 2025 & 2033
- Figure 43: Middle East & Africa Electric Propulsion Systems Industry Revenue Share (%), by Import Market Analysis (Value & Volume) 2025 & 2033
- Figure 44: Middle East & Africa Electric Propulsion Systems Industry Revenue (Million), by Export Market Analysis (Value & Volume) 2025 & 2033
- Figure 45: Middle East & Africa Electric Propulsion Systems Industry Revenue Share (%), by Export Market Analysis (Value & Volume) 2025 & 2033
- Figure 46: Middle East & Africa Electric Propulsion Systems Industry Revenue (Million), by Price Trend Analysis 2025 & 2033
- Figure 47: Middle East & Africa Electric Propulsion Systems Industry Revenue Share (%), by Price Trend Analysis 2025 & 2033
- Figure 48: Middle East & Africa Electric Propulsion Systems Industry Revenue (Million), by Country 2025 & 2033
- Figure 49: Middle East & Africa Electric Propulsion Systems Industry Revenue Share (%), by Country 2025 & 2033
- Figure 50: Asia Pacific Electric Propulsion Systems Industry Revenue (Million), by Production Analysis 2025 & 2033
- Figure 51: Asia Pacific Electric Propulsion Systems Industry Revenue Share (%), by Production Analysis 2025 & 2033
- Figure 52: Asia Pacific Electric Propulsion Systems Industry Revenue (Million), by Consumption Analysis 2025 & 2033
- Figure 53: Asia Pacific Electric Propulsion Systems Industry Revenue Share (%), by Consumption Analysis 2025 & 2033
- Figure 54: Asia Pacific Electric Propulsion Systems Industry Revenue (Million), by Import Market Analysis (Value & Volume) 2025 & 2033
- Figure 55: Asia Pacific Electric Propulsion Systems Industry Revenue Share (%), by Import Market Analysis (Value & Volume) 2025 & 2033
- Figure 56: Asia Pacific Electric Propulsion Systems Industry Revenue (Million), by Export Market Analysis (Value & Volume) 2025 & 2033
- Figure 57: Asia Pacific Electric Propulsion Systems Industry Revenue Share (%), by Export Market Analysis (Value & Volume) 2025 & 2033
- Figure 58: Asia Pacific Electric Propulsion Systems Industry Revenue (Million), by Price Trend Analysis 2025 & 2033
- Figure 59: Asia Pacific Electric Propulsion Systems Industry Revenue Share (%), by Price Trend Analysis 2025 & 2033
- Figure 60: Asia Pacific Electric Propulsion Systems Industry Revenue (Million), by Country 2025 & 2033
- Figure 61: Asia Pacific Electric Propulsion Systems Industry Revenue Share (%), by Country 2025 & 2033
List of Tables
- Table 1: Global Electric Propulsion Systems Industry Revenue Million Forecast, by Production Analysis 2020 & 2033
- Table 2: Global Electric Propulsion Systems Industry Revenue Million Forecast, by Consumption Analysis 2020 & 2033
- Table 3: Global Electric Propulsion Systems Industry Revenue Million Forecast, by Import Market Analysis (Value & Volume) 2020 & 2033
- Table 4: Global Electric Propulsion Systems Industry Revenue Million Forecast, by Export Market Analysis (Value & Volume) 2020 & 2033
- Table 5: Global Electric Propulsion Systems Industry Revenue Million Forecast, by Price Trend Analysis 2020 & 2033
- Table 6: Global Electric Propulsion Systems Industry Revenue Million Forecast, by Region 2020 & 2033
- Table 7: Global Electric Propulsion Systems Industry Revenue Million Forecast, by Production Analysis 2020 & 2033
- Table 8: Global Electric Propulsion Systems Industry Revenue Million Forecast, by Consumption Analysis 2020 & 2033
- Table 9: Global Electric Propulsion Systems Industry Revenue Million Forecast, by Import Market Analysis (Value & Volume) 2020 & 2033
- Table 10: Global Electric Propulsion Systems Industry Revenue Million Forecast, by Export Market Analysis (Value & Volume) 2020 & 2033
- Table 11: Global Electric Propulsion Systems Industry Revenue Million Forecast, by Price Trend Analysis 2020 & 2033
- Table 12: Global Electric Propulsion Systems Industry Revenue Million Forecast, by Country 2020 & 2033
- Table 13: United States Electric Propulsion Systems Industry Revenue (Million) Forecast, by Application 2020 & 2033
- Table 14: Canada Electric Propulsion Systems Industry Revenue (Million) Forecast, by Application 2020 & 2033
- Table 15: Mexico Electric Propulsion Systems Industry Revenue (Million) Forecast, by Application 2020 & 2033
- Table 16: Global Electric Propulsion Systems Industry Revenue Million Forecast, by Production Analysis 2020 & 2033
- Table 17: Global Electric Propulsion Systems Industry Revenue Million Forecast, by Consumption Analysis 2020 & 2033
- Table 18: Global Electric Propulsion Systems Industry Revenue Million Forecast, by Import Market Analysis (Value & Volume) 2020 & 2033
- Table 19: Global Electric Propulsion Systems Industry Revenue Million Forecast, by Export Market Analysis (Value & Volume) 2020 & 2033
- Table 20: Global Electric Propulsion Systems Industry Revenue Million Forecast, by Price Trend Analysis 2020 & 2033
- Table 21: Global Electric Propulsion Systems Industry Revenue Million Forecast, by Country 2020 & 2033
- Table 22: Brazil Electric Propulsion Systems Industry Revenue (Million) Forecast, by Application 2020 & 2033
- Table 23: Argentina Electric Propulsion Systems Industry Revenue (Million) Forecast, by Application 2020 & 2033
- Table 24: Rest of South America Electric Propulsion Systems Industry Revenue (Million) Forecast, by Application 2020 & 2033
- Table 25: Global Electric Propulsion Systems Industry Revenue Million Forecast, by Production Analysis 2020 & 2033
- Table 26: Global Electric Propulsion Systems Industry Revenue Million Forecast, by Consumption Analysis 2020 & 2033
- Table 27: Global Electric Propulsion Systems Industry Revenue Million Forecast, by Import Market Analysis (Value & Volume) 2020 & 2033
- Table 28: Global Electric Propulsion Systems Industry Revenue Million Forecast, by Export Market Analysis (Value & Volume) 2020 & 2033
- Table 29: Global Electric Propulsion Systems Industry Revenue Million Forecast, by Price Trend Analysis 2020 & 2033
- Table 30: Global Electric Propulsion Systems Industry Revenue Million Forecast, by Country 2020 & 2033
- Table 31: United Kingdom Electric Propulsion Systems Industry Revenue (Million) Forecast, by Application 2020 & 2033
- Table 32: Germany Electric Propulsion Systems Industry Revenue (Million) Forecast, by Application 2020 & 2033
- Table 33: France Electric Propulsion Systems Industry Revenue (Million) Forecast, by Application 2020 & 2033
- Table 34: Italy Electric Propulsion Systems Industry Revenue (Million) Forecast, by Application 2020 & 2033
- Table 35: Spain Electric Propulsion Systems Industry Revenue (Million) Forecast, by Application 2020 & 2033
- Table 36: Russia Electric Propulsion Systems Industry Revenue (Million) Forecast, by Application 2020 & 2033
- Table 37: Benelux Electric Propulsion Systems Industry Revenue (Million) Forecast, by Application 2020 & 2033
- Table 38: Nordics Electric Propulsion Systems Industry Revenue (Million) Forecast, by Application 2020 & 2033
- Table 39: Rest of Europe Electric Propulsion Systems Industry Revenue (Million) Forecast, by Application 2020 & 2033
- Table 40: Global Electric Propulsion Systems Industry Revenue Million Forecast, by Production Analysis 2020 & 2033
- Table 41: Global Electric Propulsion Systems Industry Revenue Million Forecast, by Consumption Analysis 2020 & 2033
- Table 42: Global Electric Propulsion Systems Industry Revenue Million Forecast, by Import Market Analysis (Value & Volume) 2020 & 2033
- Table 43: Global Electric Propulsion Systems Industry Revenue Million Forecast, by Export Market Analysis (Value & Volume) 2020 & 2033
- Table 44: Global Electric Propulsion Systems Industry Revenue Million Forecast, by Price Trend Analysis 2020 & 2033
- Table 45: Global Electric Propulsion Systems Industry Revenue Million Forecast, by Country 2020 & 2033
- Table 46: Turkey Electric Propulsion Systems Industry Revenue (Million) Forecast, by Application 2020 & 2033
- Table 47: Israel Electric Propulsion Systems Industry Revenue (Million) Forecast, by Application 2020 & 2033
- Table 48: GCC Electric Propulsion Systems Industry Revenue (Million) Forecast, by Application 2020 & 2033
- Table 49: North Africa Electric Propulsion Systems Industry Revenue (Million) Forecast, by Application 2020 & 2033
- Table 50: South Africa Electric Propulsion Systems Industry Revenue (Million) Forecast, by Application 2020 & 2033
- Table 51: Rest of Middle East & Africa Electric Propulsion Systems Industry Revenue (Million) Forecast, by Application 2020 & 2033
- Table 52: Global Electric Propulsion Systems Industry Revenue Million Forecast, by Production Analysis 2020 & 2033
- Table 53: Global Electric Propulsion Systems Industry Revenue Million Forecast, by Consumption Analysis 2020 & 2033
- Table 54: Global Electric Propulsion Systems Industry Revenue Million Forecast, by Import Market Analysis (Value & Volume) 2020 & 2033
- Table 55: Global Electric Propulsion Systems Industry Revenue Million Forecast, by Export Market Analysis (Value & Volume) 2020 & 2033
- Table 56: Global Electric Propulsion Systems Industry Revenue Million Forecast, by Price Trend Analysis 2020 & 2033
- Table 57: Global Electric Propulsion Systems Industry Revenue Million Forecast, by Country 2020 & 2033
- Table 58: China Electric Propulsion Systems Industry Revenue (Million) Forecast, by Application 2020 & 2033
- Table 59: India Electric Propulsion Systems Industry Revenue (Million) Forecast, by Application 2020 & 2033
- Table 60: Japan Electric Propulsion Systems Industry Revenue (Million) Forecast, by Application 2020 & 2033
- Table 61: South Korea Electric Propulsion Systems Industry Revenue (Million) Forecast, by Application 2020 & 2033
- Table 62: ASEAN Electric Propulsion Systems Industry Revenue (Million) Forecast, by Application 2020 & 2033
- Table 63: Oceania Electric Propulsion Systems Industry Revenue (Million) Forecast, by Application 2020 & 2033
- Table 64: Rest of Asia Pacific Electric Propulsion Systems Industry Revenue (Million) Forecast, by Application 2020 & 2033
Frequently Asked Questions
1. What is the projected Compound Annual Growth Rate (CAGR) of the Electric Propulsion Systems Industry?
The projected CAGR is approximately 6.09%.
2. Which companies are prominent players in the Electric Propulsion Systems Industry?
Key companies in the market include Accion Systems Inc, SITAEL SpA, Airbus SE, Daihatsu Diesel Mfg Co Ltd, Safran SA, Aerojet Rocketdyne Holdings Inc, Orbital ATK (Northrop Grumman Corporation), Efficient Drivetrains Inc (Cummins Inc ), Collins Aerospace (RTX Corporation, Busek Co Inc, Thales Alenia Space, General Electric Company, The Boeing Company.
3. What are the main segments of the Electric Propulsion Systems Industry?
The market segments include Production Analysis, Consumption Analysis, Import Market Analysis (Value & Volume), Export Market Analysis (Value & Volume), Price Trend Analysis.
4. Can you provide details about the market size?
The market size is estimated to be USD 10.94 Million as of 2022.
5. What are some drivers contributing to market growth?
; Increased Seaborne Threats And Ambiguous Maritime Security Policies; Increasing Adoption Of Security Technologies In Bric Countries.
6. What are the notable trends driving market growth?
Space Segment Envisioned to Experience Highest Growth During the Forecast Period.
7. Are there any restraints impacting market growth?
; High Risk Rate In Ungoverned Zones; Unstructured Security Standards And Technologies.
8. Can you provide examples of recent developments in the market?
N/A
9. What pricing options are available for accessing the report?
Pricing options include single-user, multi-user, and enterprise licenses priced at USD 4750, USD 5250, and USD 8750 respectively.
10. Is the market size provided in terms of value or volume?
The market size is provided in terms of value, measured in Million.
11. Are there any specific market keywords associated with the report?
Yes, the market keyword associated with the report is "Electric Propulsion Systems Industry," which aids in identifying and referencing the specific market segment covered.
12. How do I determine which pricing option suits my needs best?
The pricing options vary based on user requirements and access needs. Individual users may opt for single-user licenses, while businesses requiring broader access may choose multi-user or enterprise licenses for cost-effective access to the report.
13. Are there any additional resources or data provided in the Electric Propulsion Systems Industry report?
While the report offers comprehensive insights, it's advisable to review the specific contents or supplementary materials provided to ascertain if additional resources or data are available.
14. How can I stay updated on further developments or reports in the Electric Propulsion Systems Industry?
To stay informed about further developments, trends, and reports in the Electric Propulsion Systems Industry, consider subscribing to industry newsletters, following relevant companies and organizations, or regularly checking reputable industry news sources and publications.
Methodology
Step 1 - Identification of Relevant Samples Size from Population Database


Step 2 - Approaches for Defining Global Market Size (Value, Volume* & Price*)

Note*: In applicable scenarios
Step 3 - Data Sources
Primary Research
- Web Analytics
- Survey Reports
- Research Institute
- Latest Research Reports
- Opinion Leaders
Secondary Research
- Annual Reports
- White Paper
- Latest Press Release
- Industry Association
- Paid Database
- Investor Presentations

Step 4 - Data Triangulation
Involves using different sources of information in order to increase the validity of a study
These sources are likely to be stakeholders in a program - participants, other researchers, program staff, other community members, and so on.
Then we put all data in single framework & apply various statistical tools to find out the dynamic on the market.
During the analysis stage, feedback from the stakeholder groups would be compared to determine areas of agreement as well as areas of divergence