

Key Insights
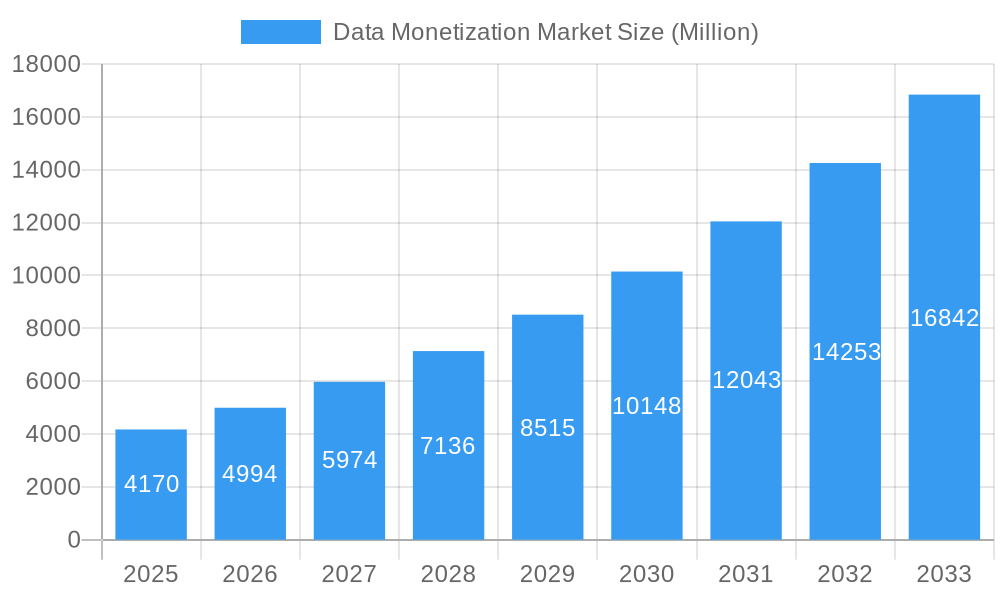
The global data monetization market is experiencing robust growth, projected to reach \$4.17 billion in 2025 and expand at a compound annual growth rate (CAGR) of 19.94% from 2025 to 2033. This expansion is driven by several key factors. Firstly, the exponential increase in data volume generated across various sectors, coupled with advancements in data analytics and AI, creates immense opportunities for extracting valuable insights and generating revenue streams. Secondly, increasing regulatory pressures around data privacy, such as GDPR and CCPA, are prompting organizations to develop sophisticated data monetization strategies to comply with regulations while capitalizing on their data assets. Thirdly, the rising adoption of cloud computing and big data technologies provides the necessary infrastructure for efficient data processing, analysis, and distribution, facilitating data monetization initiatives. The BFSI, telecom and IT, and healthcare sectors are currently leading adopters, leveraging data monetization for personalized services, targeted advertising, and improved operational efficiency. However, challenges remain, including concerns around data security, ethical considerations, and the need for robust data governance frameworks. These challenges are being actively addressed through the development of innovative solutions focused on data anonymization, encryption, and transparent data usage policies.
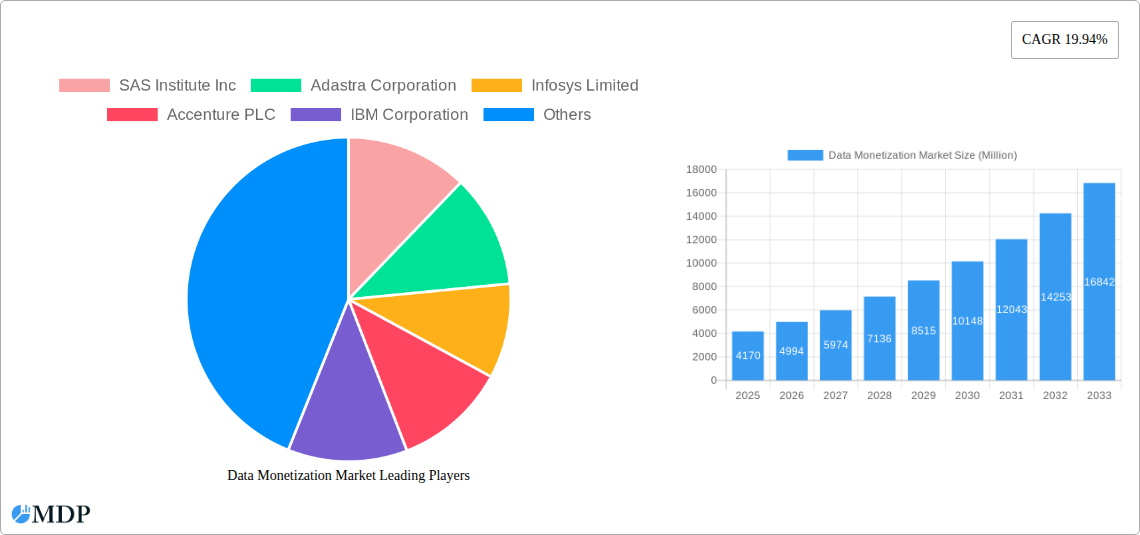
Data Monetization Market Market Size (In Billion)
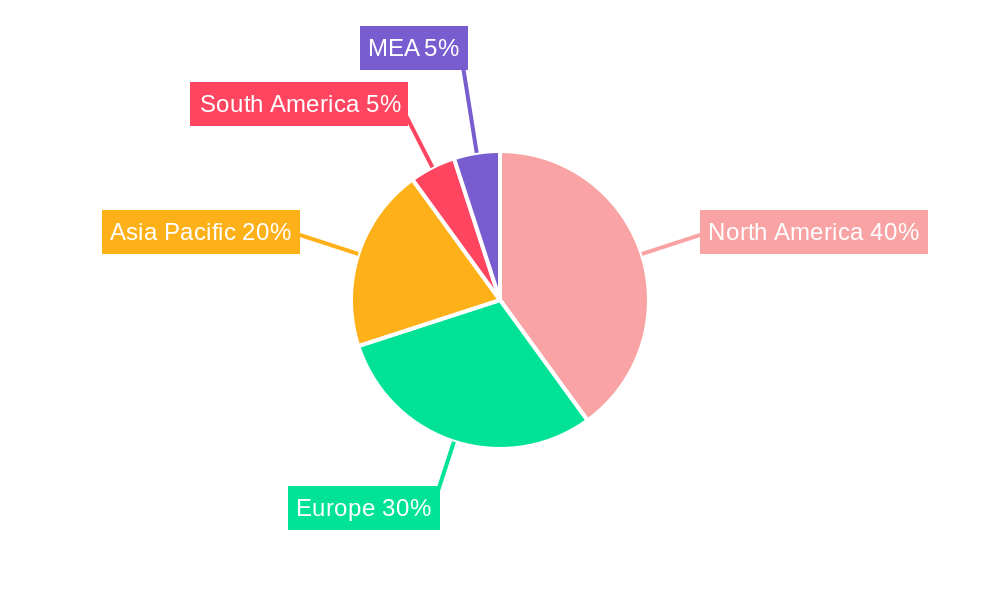
The market is segmented by organization size (SMEs and large enterprises) and end-user industry (BFSI, Telecom & IT, Manufacturing, Healthcare, Retail, and Others). Large enterprises are currently driving significant market share due to their substantial data resources and advanced analytical capabilities. However, SMEs are showing increasing adoption rates as they recognize the potential for data monetization to improve competitiveness and generate new revenue streams. Geographically, North America holds a substantial market share, owing to early adoption of advanced technologies and strong regulatory frameworks. However, Asia-Pacific is expected to witness rapid growth in the coming years due to the expanding digital economy and increasing data generation from emerging markets like India and China. Europe, driven by strong data privacy regulations and a robust IT infrastructure, is also expected to contribute substantially to the market's growth. The competitive landscape includes a mix of established players like SAS Institute, IBM, and Accenture, as well as emerging technology providers specializing in data anonymization and monetization platforms. This dynamic environment will continue to drive innovation and market expansion.
Data Monetization Market Company Market Share
Data Monetization Market Report: Unlocking Value from Data Assets (2019-2033)
This comprehensive report provides a detailed analysis of the Data Monetization Market, projecting robust growth and significant opportunities for stakeholders. Covering the period from 2019 to 2033, with a focus on 2025, this study delves into market dynamics, key players, and future trends, offering actionable insights for strategic decision-making.
Data Monetization Market Market Dynamics & Concentration
The Data Monetization Market is experiencing a period of rapid expansion, driven by increasing data volumes, advancements in data analytics, and a growing awareness of the commercial value of data assets. Market concentration is currently moderate, with several large players holding significant market share, but a fragmented landscape also exists, particularly among smaller, specialized firms. The market is characterized by intense competition, leading to frequent mergers and acquisitions (M&A) activity. Over the historical period (2019-2024), we observed approximately xx M&A deals annually, with an upward trend projected for the forecast period (2025-2033).
- Market Concentration: The top 5 players hold approximately xx% of the market share in 2025.
- Innovation Drivers: AI, machine learning, and blockchain technologies are key innovation drivers, enabling more sophisticated data processing and monetization strategies.
- Regulatory Frameworks: Evolving data privacy regulations (e.g., GDPR, CCPA) are shaping market practices and influencing the development of compliant monetization solutions.
- Product Substitutes: The absence of direct substitutes strengthens the market's growth trajectory. Data monetization itself is a service rather than a product and is usually integrated into businesses. However, the lack of a complete solution that would encompass all data monetization aspects makes it open to competition.
- End-User Trends: The increasing adoption of cloud computing and big data analytics solutions is fueling demand for data monetization services across various industries.
Data Monetization Market Industry Trends & Analysis
The Data Monetization Market is experiencing significant growth, with a projected Compound Annual Growth Rate (CAGR) of xx% during the forecast period (2025-2033). Market penetration is currently at xx%, expected to increase to xx% by 2033, driven by several factors. The rising adoption of data-driven decision-making across industries is a significant catalyst, along with the increasing availability of advanced analytics tools and a growing understanding of the value of data as a strategic asset. The growing prevalence of cloud-based services, the expansion of the IoT market, and the rise of advanced technologies such as AI and machine learning are further stimulating market expansion. The competitive landscape is characterized by intense rivalry among established players and a steady influx of innovative startups, which is enhancing the development of various data monetization technologies and services. Consumer preferences are increasingly shifting towards personalized and contextualized services, creating further demand for effective data monetization strategies.
Leading Markets & Segments in Data Monetization Market
The North American region is currently the leading market for data monetization, followed by Europe and Asia Pacific. Within these regions, significant growth is observed across various segments.
By Organization Size:
- Large Enterprises: This segment dominates the market due to their higher data volumes and greater resources for implementing data monetization strategies. Key drivers include robust IT infrastructure and the ability to make significant investments in specialized software and services.
- Small and Medium-sized Enterprises (SMEs): This segment is experiencing significant growth, driven by increasing accessibility to affordable data monetization solutions and the growing awareness of the benefits of data-driven decision-making. Challenges include limited resources and expertise, although cloud-based services are enabling access for even small companies.
By End-user Industry:
- BFSI (Banking, Financial Services, and Insurance): This sector is a major driver, leveraging data for risk management, fraud detection, and personalized customer services.
- Telecom and IT: This industry is a key adopter, with vast amounts of data generated and monetized through targeted advertising, personalized services, and network optimization.
- Manufacturing: Data from production processes is used for predictive maintenance, optimizing operations, and developing new products.
- Healthcare: Data is used for personalized medicine, improved diagnostics, and more efficient healthcare delivery.
- Retail: Data provides insight into consumer behavior, enabling targeted marketing, personalized recommendations, and optimized supply chains.
Data Monetization Market Product Developments
Recent product innovations focus on enhancing data security, improving analytical capabilities, and simplifying data monetization workflows. The market is seeing the rise of cloud-based platforms, AI-powered analytics tools, and blockchain-based solutions that address privacy concerns while enabling secure and transparent data exchange. These developments are enabling organizations of all sizes to effectively monetize their data assets and gain a competitive advantage.
Key Drivers of Data Monetization Market Growth
Several factors fuel the growth of the data monetization market. Technological advancements, including AI and machine learning, are creating new opportunities for data analysis and monetization. The increasing availability of large datasets and the growing demand for personalized customer experiences are also significant drivers. Government initiatives promoting data sharing and open data policies create further opportunities. Finally, the economic benefits of effective data monetization strategies, including revenue generation and cost reduction, are compelling businesses to invest in this area.
Challenges in the Data Monetization Market Market
Challenges include the complexity of data governance, regulatory compliance (including data privacy laws like GDPR and CCPA), and concerns over data security and privacy. The high cost of data management and analytics infrastructure can also be a barrier, particularly for SMEs. Competition from established technology providers and new entrants further adds to the market's challenges. For instance, the compliance needs alone may cost companies an estimated xx Million annually in operational expenditure.
Emerging Opportunities in Data Monetization Market
Emerging opportunities lie in the expansion of data monetization solutions into new industries and geographical markets. Technological advancements, like the integration of AI, blockchain, and IoT technologies, will create new revenue streams and business models. Strategic partnerships between data providers and technology companies are further enabling innovative data monetization strategies. Finally, the potential for creating new markets, for example in data marketplaces, presents considerable long-term growth prospects.
Leading Players in the Data Monetization Market Sector
- SAS Institute Inc
- Adastra Corporation
- Infosys Limited
- Accenture PLC
- IBM Corporation
- NetScout Systems Inc
- Dawex Systems SAS
- Ness Technologies Inc
- Google LLC (Alphabet Inc)
- Thales Group
- Cisco Systems Inc
- Openwave Mobility Inc (ENEA)
- SAP SE
- Emu Analytics Ltd
Key Milestones in Data Monetization Market Industry
- April 2024: Carv secures USD 10 Million in Series A funding, highlighting investor confidence in the growing data ownership and monetization sector. This signifies a positive trend towards user-centric data strategies.
- February 2024: Tecnotree's partnership with BytePlus showcases the potential of AI and API monetization in the B2B2X ecosystem, indicating a significant shift towards collaborative data monetization approaches.
Strategic Outlook for Data Monetization Market Market
The Data Monetization Market is poised for continued growth, driven by technological innovation, expanding data volumes, and increased awareness of the commercial value of data. Strategic opportunities exist in developing innovative data monetization solutions, building strategic partnerships, and expanding into new geographic markets. Companies that effectively address data privacy concerns and build trust with users will be best positioned for success in this rapidly evolving market. The market is expected to reach xx Million by 2033.
Data Monetization Market Segmentation
-
1. Organization Size
- 1.1. Small and Medium-sized Enterprises
- 1.2. Large Enterprises
-
2. End-user Industry
- 2.1. BFSI
- 2.2. Telecom and IT
- 2.3. Manufacturing
- 2.4. Healthcare
- 2.5. Retail
- 2.6. Other End-user Industries
Data Monetization Market Segmentation By Geography
- 1. North America
- 2. Europe
- 3. Asia
- 4. Australia and New Zealand
- 5. Latin America
- 6. Middle East and Africa
Data Monetization Market Regional Market Share
Geographic Coverage of Data Monetization Market
Data Monetization Market REPORT HIGHLIGHTS
| Aspects | Details |
|---|---|
| Study Period | 2020-2034 |
| Base Year | 2025 |
| Estimated Year | 2026 |
| Forecast Period | 2026-2034 |
| Historical Period | 2020-2025 |
| Growth Rate | CAGR of 19.94% from 2020-2034 |
| Segmentation |
|
Table of Contents
- 1. Introduction
- 1.1. Research Scope
- 1.2. Market Segmentation
- 1.3. Research Methodology
- 1.4. Definitions and Assumptions
- 2. Executive Summary
- 2.1. Introduction
- 3. Market Dynamics
- 3.1. Introduction
- 3.2. Market Drivers
- 3.2.1. Rapid Adoption of Advanced Analytics and Visualization; Increasing Volume and Variety of Business Data
- 3.3. Market Restrains
- 3.3.1. Interoperability With Existing Systems; Varying Structure of Regulatory Policies
- 3.4. Market Trends
- 3.4.1. Large Enterprises to Hold Major Market Share
- 4. Market Factor Analysis
- 4.1. Porters Five Forces
- 4.2. Supply/Value Chain
- 4.3. PESTEL analysis
- 4.4. Market Entropy
- 4.5. Patent/Trademark Analysis
- 5. Global Data Monetization Market Analysis, Insights and Forecast, 2020-2032
- 5.1. Market Analysis, Insights and Forecast - by Organization Size
- 5.1.1. Small and Medium-sized Enterprises
- 5.1.2. Large Enterprises
- 5.2. Market Analysis, Insights and Forecast - by End-user Industry
- 5.2.1. BFSI
- 5.2.2. Telecom and IT
- 5.2.3. Manufacturing
- 5.2.4. Healthcare
- 5.2.5. Retail
- 5.2.6. Other End-user Industries
- 5.3. Market Analysis, Insights and Forecast - by Region
- 5.3.1. North America
- 5.3.2. Europe
- 5.3.3. Asia
- 5.3.4. Australia and New Zealand
- 5.3.5. Latin America
- 5.3.6. Middle East and Africa
- 5.1. Market Analysis, Insights and Forecast - by Organization Size
- 6. North America Data Monetization Market Analysis, Insights and Forecast, 2020-2032
- 6.1. Market Analysis, Insights and Forecast - by Organization Size
- 6.1.1. Small and Medium-sized Enterprises
- 6.1.2. Large Enterprises
- 6.2. Market Analysis, Insights and Forecast - by End-user Industry
- 6.2.1. BFSI
- 6.2.2. Telecom and IT
- 6.2.3. Manufacturing
- 6.2.4. Healthcare
- 6.2.5. Retail
- 6.2.6. Other End-user Industries
- 6.1. Market Analysis, Insights and Forecast - by Organization Size
- 7. Europe Data Monetization Market Analysis, Insights and Forecast, 2020-2032
- 7.1. Market Analysis, Insights and Forecast - by Organization Size
- 7.1.1. Small and Medium-sized Enterprises
- 7.1.2. Large Enterprises
- 7.2. Market Analysis, Insights and Forecast - by End-user Industry
- 7.2.1. BFSI
- 7.2.2. Telecom and IT
- 7.2.3. Manufacturing
- 7.2.4. Healthcare
- 7.2.5. Retail
- 7.2.6. Other End-user Industries
- 7.1. Market Analysis, Insights and Forecast - by Organization Size
- 8. Asia Data Monetization Market Analysis, Insights and Forecast, 2020-2032
- 8.1. Market Analysis, Insights and Forecast - by Organization Size
- 8.1.1. Small and Medium-sized Enterprises
- 8.1.2. Large Enterprises
- 8.2. Market Analysis, Insights and Forecast - by End-user Industry
- 8.2.1. BFSI
- 8.2.2. Telecom and IT
- 8.2.3. Manufacturing
- 8.2.4. Healthcare
- 8.2.5. Retail
- 8.2.6. Other End-user Industries
- 8.1. Market Analysis, Insights and Forecast - by Organization Size
- 9. Australia and New Zealand Data Monetization Market Analysis, Insights and Forecast, 2020-2032
- 9.1. Market Analysis, Insights and Forecast - by Organization Size
- 9.1.1. Small and Medium-sized Enterprises
- 9.1.2. Large Enterprises
- 9.2. Market Analysis, Insights and Forecast - by End-user Industry
- 9.2.1. BFSI
- 9.2.2. Telecom and IT
- 9.2.3. Manufacturing
- 9.2.4. Healthcare
- 9.2.5. Retail
- 9.2.6. Other End-user Industries
- 9.1. Market Analysis, Insights and Forecast - by Organization Size
- 10. Latin America Data Monetization Market Analysis, Insights and Forecast, 2020-2032
- 10.1. Market Analysis, Insights and Forecast - by Organization Size
- 10.1.1. Small and Medium-sized Enterprises
- 10.1.2. Large Enterprises
- 10.2. Market Analysis, Insights and Forecast - by End-user Industry
- 10.2.1. BFSI
- 10.2.2. Telecom and IT
- 10.2.3. Manufacturing
- 10.2.4. Healthcare
- 10.2.5. Retail
- 10.2.6. Other End-user Industries
- 10.1. Market Analysis, Insights and Forecast - by Organization Size
- 11. Middle East and Africa Data Monetization Market Analysis, Insights and Forecast, 2020-2032
- 11.1. Market Analysis, Insights and Forecast - by Organization Size
- 11.1.1. Small and Medium-sized Enterprises
- 11.1.2. Large Enterprises
- 11.2. Market Analysis, Insights and Forecast - by End-user Industry
- 11.2.1. BFSI
- 11.2.2. Telecom and IT
- 11.2.3. Manufacturing
- 11.2.4. Healthcare
- 11.2.5. Retail
- 11.2.6. Other End-user Industries
- 11.1. Market Analysis, Insights and Forecast - by Organization Size
- 12. Competitive Analysis
- 12.1. Global Market Share Analysis 2025
- 12.2. Company Profiles
- 12.2.1 SAS Institute Inc
- 12.2.1.1. Overview
- 12.2.1.2. Products
- 12.2.1.3. SWOT Analysis
- 12.2.1.4. Recent Developments
- 12.2.1.5. Financials (Based on Availability)
- 12.2.2 Adastra Corporation
- 12.2.2.1. Overview
- 12.2.2.2. Products
- 12.2.2.3. SWOT Analysis
- 12.2.2.4. Recent Developments
- 12.2.2.5. Financials (Based on Availability)
- 12.2.3 Infosys Limited
- 12.2.3.1. Overview
- 12.2.3.2. Products
- 12.2.3.3. SWOT Analysis
- 12.2.3.4. Recent Developments
- 12.2.3.5. Financials (Based on Availability)
- 12.2.4 Accenture PLC
- 12.2.4.1. Overview
- 12.2.4.2. Products
- 12.2.4.3. SWOT Analysis
- 12.2.4.4. Recent Developments
- 12.2.4.5. Financials (Based on Availability)
- 12.2.5 IBM Corporation
- 12.2.5.1. Overview
- 12.2.5.2. Products
- 12.2.5.3. SWOT Analysis
- 12.2.5.4. Recent Developments
- 12.2.5.5. Financials (Based on Availability)
- 12.2.6 NetScout Systems Inc
- 12.2.6.1. Overview
- 12.2.6.2. Products
- 12.2.6.3. SWOT Analysis
- 12.2.6.4. Recent Developments
- 12.2.6.5. Financials (Based on Availability)
- 12.2.7 Dawex Systems SAS
- 12.2.7.1. Overview
- 12.2.7.2. Products
- 12.2.7.3. SWOT Analysis
- 12.2.7.4. Recent Developments
- 12.2.7.5. Financials (Based on Availability)
- 12.2.8 Ness Technologies Inc
- 12.2.8.1. Overview
- 12.2.8.2. Products
- 12.2.8.3. SWOT Analysis
- 12.2.8.4. Recent Developments
- 12.2.8.5. Financials (Based on Availability)
- 12.2.9 Google LLC (Alphabet Inc )
- 12.2.9.1. Overview
- 12.2.9.2. Products
- 12.2.9.3. SWOT Analysis
- 12.2.9.4. Recent Developments
- 12.2.9.5. Financials (Based on Availability)
- 12.2.10 Thales Group
- 12.2.10.1. Overview
- 12.2.10.2. Products
- 12.2.10.3. SWOT Analysis
- 12.2.10.4. Recent Developments
- 12.2.10.5. Financials (Based on Availability)
- 12.2.11 Cisco Systems Inc
- 12.2.11.1. Overview
- 12.2.11.2. Products
- 12.2.11.3. SWOT Analysis
- 12.2.11.4. Recent Developments
- 12.2.11.5. Financials (Based on Availability)
- 12.2.12 Openwave Mobility Inc (ENEA)
- 12.2.12.1. Overview
- 12.2.12.2. Products
- 12.2.12.3. SWOT Analysis
- 12.2.12.4. Recent Developments
- 12.2.12.5. Financials (Based on Availability)
- 12.2.13 SAP SE
- 12.2.13.1. Overview
- 12.2.13.2. Products
- 12.2.13.3. SWOT Analysis
- 12.2.13.4. Recent Developments
- 12.2.13.5. Financials (Based on Availability)
- 12.2.14 Emu Analytics Ltd
- 12.2.14.1. Overview
- 12.2.14.2. Products
- 12.2.14.3. SWOT Analysis
- 12.2.14.4. Recent Developments
- 12.2.14.5. Financials (Based on Availability)
- 12.2.1 SAS Institute Inc
List of Figures
- Figure 1: Global Data Monetization Market Revenue Breakdown (Million, %) by Region 2025 & 2033
- Figure 2: Global Data Monetization Market Volume Breakdown (K Unit, %) by Region 2025 & 2033
- Figure 3: North America Data Monetization Market Revenue (Million), by Organization Size 2025 & 2033
- Figure 4: North America Data Monetization Market Volume (K Unit), by Organization Size 2025 & 2033
- Figure 5: North America Data Monetization Market Revenue Share (%), by Organization Size 2025 & 2033
- Figure 6: North America Data Monetization Market Volume Share (%), by Organization Size 2025 & 2033
- Figure 7: North America Data Monetization Market Revenue (Million), by End-user Industry 2025 & 2033
- Figure 8: North America Data Monetization Market Volume (K Unit), by End-user Industry 2025 & 2033
- Figure 9: North America Data Monetization Market Revenue Share (%), by End-user Industry 2025 & 2033
- Figure 10: North America Data Monetization Market Volume Share (%), by End-user Industry 2025 & 2033
- Figure 11: North America Data Monetization Market Revenue (Million), by Country 2025 & 2033
- Figure 12: North America Data Monetization Market Volume (K Unit), by Country 2025 & 2033
- Figure 13: North America Data Monetization Market Revenue Share (%), by Country 2025 & 2033
- Figure 14: North America Data Monetization Market Volume Share (%), by Country 2025 & 2033
- Figure 15: Europe Data Monetization Market Revenue (Million), by Organization Size 2025 & 2033
- Figure 16: Europe Data Monetization Market Volume (K Unit), by Organization Size 2025 & 2033
- Figure 17: Europe Data Monetization Market Revenue Share (%), by Organization Size 2025 & 2033
- Figure 18: Europe Data Monetization Market Volume Share (%), by Organization Size 2025 & 2033
- Figure 19: Europe Data Monetization Market Revenue (Million), by End-user Industry 2025 & 2033
- Figure 20: Europe Data Monetization Market Volume (K Unit), by End-user Industry 2025 & 2033
- Figure 21: Europe Data Monetization Market Revenue Share (%), by End-user Industry 2025 & 2033
- Figure 22: Europe Data Monetization Market Volume Share (%), by End-user Industry 2025 & 2033
- Figure 23: Europe Data Monetization Market Revenue (Million), by Country 2025 & 2033
- Figure 24: Europe Data Monetization Market Volume (K Unit), by Country 2025 & 2033
- Figure 25: Europe Data Monetization Market Revenue Share (%), by Country 2025 & 2033
- Figure 26: Europe Data Monetization Market Volume Share (%), by Country 2025 & 2033
- Figure 27: Asia Data Monetization Market Revenue (Million), by Organization Size 2025 & 2033
- Figure 28: Asia Data Monetization Market Volume (K Unit), by Organization Size 2025 & 2033
- Figure 29: Asia Data Monetization Market Revenue Share (%), by Organization Size 2025 & 2033
- Figure 30: Asia Data Monetization Market Volume Share (%), by Organization Size 2025 & 2033
- Figure 31: Asia Data Monetization Market Revenue (Million), by End-user Industry 2025 & 2033
- Figure 32: Asia Data Monetization Market Volume (K Unit), by End-user Industry 2025 & 2033
- Figure 33: Asia Data Monetization Market Revenue Share (%), by End-user Industry 2025 & 2033
- Figure 34: Asia Data Monetization Market Volume Share (%), by End-user Industry 2025 & 2033
- Figure 35: Asia Data Monetization Market Revenue (Million), by Country 2025 & 2033
- Figure 36: Asia Data Monetization Market Volume (K Unit), by Country 2025 & 2033
- Figure 37: Asia Data Monetization Market Revenue Share (%), by Country 2025 & 2033
- Figure 38: Asia Data Monetization Market Volume Share (%), by Country 2025 & 2033
- Figure 39: Australia and New Zealand Data Monetization Market Revenue (Million), by Organization Size 2025 & 2033
- Figure 40: Australia and New Zealand Data Monetization Market Volume (K Unit), by Organization Size 2025 & 2033
- Figure 41: Australia and New Zealand Data Monetization Market Revenue Share (%), by Organization Size 2025 & 2033
- Figure 42: Australia and New Zealand Data Monetization Market Volume Share (%), by Organization Size 2025 & 2033
- Figure 43: Australia and New Zealand Data Monetization Market Revenue (Million), by End-user Industry 2025 & 2033
- Figure 44: Australia and New Zealand Data Monetization Market Volume (K Unit), by End-user Industry 2025 & 2033
- Figure 45: Australia and New Zealand Data Monetization Market Revenue Share (%), by End-user Industry 2025 & 2033
- Figure 46: Australia and New Zealand Data Monetization Market Volume Share (%), by End-user Industry 2025 & 2033
- Figure 47: Australia and New Zealand Data Monetization Market Revenue (Million), by Country 2025 & 2033
- Figure 48: Australia and New Zealand Data Monetization Market Volume (K Unit), by Country 2025 & 2033
- Figure 49: Australia and New Zealand Data Monetization Market Revenue Share (%), by Country 2025 & 2033
- Figure 50: Australia and New Zealand Data Monetization Market Volume Share (%), by Country 2025 & 2033
- Figure 51: Latin America Data Monetization Market Revenue (Million), by Organization Size 2025 & 2033
- Figure 52: Latin America Data Monetization Market Volume (K Unit), by Organization Size 2025 & 2033
- Figure 53: Latin America Data Monetization Market Revenue Share (%), by Organization Size 2025 & 2033
- Figure 54: Latin America Data Monetization Market Volume Share (%), by Organization Size 2025 & 2033
- Figure 55: Latin America Data Monetization Market Revenue (Million), by End-user Industry 2025 & 2033
- Figure 56: Latin America Data Monetization Market Volume (K Unit), by End-user Industry 2025 & 2033
- Figure 57: Latin America Data Monetization Market Revenue Share (%), by End-user Industry 2025 & 2033
- Figure 58: Latin America Data Monetization Market Volume Share (%), by End-user Industry 2025 & 2033
- Figure 59: Latin America Data Monetization Market Revenue (Million), by Country 2025 & 2033
- Figure 60: Latin America Data Monetization Market Volume (K Unit), by Country 2025 & 2033
- Figure 61: Latin America Data Monetization Market Revenue Share (%), by Country 2025 & 2033
- Figure 62: Latin America Data Monetization Market Volume Share (%), by Country 2025 & 2033
- Figure 63: Middle East and Africa Data Monetization Market Revenue (Million), by Organization Size 2025 & 2033
- Figure 64: Middle East and Africa Data Monetization Market Volume (K Unit), by Organization Size 2025 & 2033
- Figure 65: Middle East and Africa Data Monetization Market Revenue Share (%), by Organization Size 2025 & 2033
- Figure 66: Middle East and Africa Data Monetization Market Volume Share (%), by Organization Size 2025 & 2033
- Figure 67: Middle East and Africa Data Monetization Market Revenue (Million), by End-user Industry 2025 & 2033
- Figure 68: Middle East and Africa Data Monetization Market Volume (K Unit), by End-user Industry 2025 & 2033
- Figure 69: Middle East and Africa Data Monetization Market Revenue Share (%), by End-user Industry 2025 & 2033
- Figure 70: Middle East and Africa Data Monetization Market Volume Share (%), by End-user Industry 2025 & 2033
- Figure 71: Middle East and Africa Data Monetization Market Revenue (Million), by Country 2025 & 2033
- Figure 72: Middle East and Africa Data Monetization Market Volume (K Unit), by Country 2025 & 2033
- Figure 73: Middle East and Africa Data Monetization Market Revenue Share (%), by Country 2025 & 2033
- Figure 74: Middle East and Africa Data Monetization Market Volume Share (%), by Country 2025 & 2033
List of Tables
- Table 1: Global Data Monetization Market Revenue Million Forecast, by Organization Size 2020 & 2033
- Table 2: Global Data Monetization Market Volume K Unit Forecast, by Organization Size 2020 & 2033
- Table 3: Global Data Monetization Market Revenue Million Forecast, by End-user Industry 2020 & 2033
- Table 4: Global Data Monetization Market Volume K Unit Forecast, by End-user Industry 2020 & 2033
- Table 5: Global Data Monetization Market Revenue Million Forecast, by Region 2020 & 2033
- Table 6: Global Data Monetization Market Volume K Unit Forecast, by Region 2020 & 2033
- Table 7: Global Data Monetization Market Revenue Million Forecast, by Organization Size 2020 & 2033
- Table 8: Global Data Monetization Market Volume K Unit Forecast, by Organization Size 2020 & 2033
- Table 9: Global Data Monetization Market Revenue Million Forecast, by End-user Industry 2020 & 2033
- Table 10: Global Data Monetization Market Volume K Unit Forecast, by End-user Industry 2020 & 2033
- Table 11: Global Data Monetization Market Revenue Million Forecast, by Country 2020 & 2033
- Table 12: Global Data Monetization Market Volume K Unit Forecast, by Country 2020 & 2033
- Table 13: Global Data Monetization Market Revenue Million Forecast, by Organization Size 2020 & 2033
- Table 14: Global Data Monetization Market Volume K Unit Forecast, by Organization Size 2020 & 2033
- Table 15: Global Data Monetization Market Revenue Million Forecast, by End-user Industry 2020 & 2033
- Table 16: Global Data Monetization Market Volume K Unit Forecast, by End-user Industry 2020 & 2033
- Table 17: Global Data Monetization Market Revenue Million Forecast, by Country 2020 & 2033
- Table 18: Global Data Monetization Market Volume K Unit Forecast, by Country 2020 & 2033
- Table 19: Global Data Monetization Market Revenue Million Forecast, by Organization Size 2020 & 2033
- Table 20: Global Data Monetization Market Volume K Unit Forecast, by Organization Size 2020 & 2033
- Table 21: Global Data Monetization Market Revenue Million Forecast, by End-user Industry 2020 & 2033
- Table 22: Global Data Monetization Market Volume K Unit Forecast, by End-user Industry 2020 & 2033
- Table 23: Global Data Monetization Market Revenue Million Forecast, by Country 2020 & 2033
- Table 24: Global Data Monetization Market Volume K Unit Forecast, by Country 2020 & 2033
- Table 25: Global Data Monetization Market Revenue Million Forecast, by Organization Size 2020 & 2033
- Table 26: Global Data Monetization Market Volume K Unit Forecast, by Organization Size 2020 & 2033
- Table 27: Global Data Monetization Market Revenue Million Forecast, by End-user Industry 2020 & 2033
- Table 28: Global Data Monetization Market Volume K Unit Forecast, by End-user Industry 2020 & 2033
- Table 29: Global Data Monetization Market Revenue Million Forecast, by Country 2020 & 2033
- Table 30: Global Data Monetization Market Volume K Unit Forecast, by Country 2020 & 2033
- Table 31: Global Data Monetization Market Revenue Million Forecast, by Organization Size 2020 & 2033
- Table 32: Global Data Monetization Market Volume K Unit Forecast, by Organization Size 2020 & 2033
- Table 33: Global Data Monetization Market Revenue Million Forecast, by End-user Industry 2020 & 2033
- Table 34: Global Data Monetization Market Volume K Unit Forecast, by End-user Industry 2020 & 2033
- Table 35: Global Data Monetization Market Revenue Million Forecast, by Country 2020 & 2033
- Table 36: Global Data Monetization Market Volume K Unit Forecast, by Country 2020 & 2033
- Table 37: Global Data Monetization Market Revenue Million Forecast, by Organization Size 2020 & 2033
- Table 38: Global Data Monetization Market Volume K Unit Forecast, by Organization Size 2020 & 2033
- Table 39: Global Data Monetization Market Revenue Million Forecast, by End-user Industry 2020 & 2033
- Table 40: Global Data Monetization Market Volume K Unit Forecast, by End-user Industry 2020 & 2033
- Table 41: Global Data Monetization Market Revenue Million Forecast, by Country 2020 & 2033
- Table 42: Global Data Monetization Market Volume K Unit Forecast, by Country 2020 & 2033
Frequently Asked Questions
1. What is the projected Compound Annual Growth Rate (CAGR) of the Data Monetization Market?
The projected CAGR is approximately 19.94%.
2. Which companies are prominent players in the Data Monetization Market?
Key companies in the market include SAS Institute Inc, Adastra Corporation, Infosys Limited, Accenture PLC, IBM Corporation, NetScout Systems Inc, Dawex Systems SAS, Ness Technologies Inc, Google LLC (Alphabet Inc ), Thales Group, Cisco Systems Inc, Openwave Mobility Inc (ENEA), SAP SE, Emu Analytics Ltd.
3. What are the main segments of the Data Monetization Market?
The market segments include Organization Size, End-user Industry.
4. Can you provide details about the market size?
The market size is estimated to be USD 4.17 Million as of 2022.
5. What are some drivers contributing to market growth?
Rapid Adoption of Advanced Analytics and Visualization; Increasing Volume and Variety of Business Data.
6. What are the notable trends driving market growth?
Large Enterprises to Hold Major Market Share.
7. Are there any restraints impacting market growth?
Interoperability With Existing Systems; Varying Structure of Regulatory Policies.
8. Can you provide examples of recent developments in the market?
April 2024: Carv, a data layer platform that lets web3 gaming apps, AI companies, and gamers control and monetize their data, raised a USD 10 million series A round led by Tribe Capital and IOSG Ventures. The company differentiates itself by empowering users with data ownership and monetization rights, which are expected to support the market growth during the forecast period.
9. What pricing options are available for accessing the report?
Pricing options include single-user, multi-user, and enterprise licenses priced at USD 4750, USD 5250, and USD 8750 respectively.
10. Is the market size provided in terms of value or volume?
The market size is provided in terms of value, measured in Million and volume, measured in K Unit.
11. Are there any specific market keywords associated with the report?
Yes, the market keyword associated with the report is "Data Monetization Market," which aids in identifying and referencing the specific market segment covered.
12. How do I determine which pricing option suits my needs best?
The pricing options vary based on user requirements and access needs. Individual users may opt for single-user licenses, while businesses requiring broader access may choose multi-user or enterprise licenses for cost-effective access to the report.
13. Are there any additional resources or data provided in the Data Monetization Market report?
While the report offers comprehensive insights, it's advisable to review the specific contents or supplementary materials provided to ascertain if additional resources or data are available.
14. How can I stay updated on further developments or reports in the Data Monetization Market?
To stay informed about further developments, trends, and reports in the Data Monetization Market, consider subscribing to industry newsletters, following relevant companies and organizations, or regularly checking reputable industry news sources and publications.
Methodology
Step 1 - Identification of Relevant Samples Size from Population Database


Step 2 - Approaches for Defining Global Market Size (Value, Volume* & Price*)

Note*: In applicable scenarios
Step 3 - Data Sources
Primary Research
- Web Analytics
- Survey Reports
- Research Institute
- Latest Research Reports
- Opinion Leaders
Secondary Research
- Annual Reports
- White Paper
- Latest Press Release
- Industry Association
- Paid Database
- Investor Presentations

Step 4 - Data Triangulation
Involves using different sources of information in order to increase the validity of a study
These sources are likely to be stakeholders in a program - participants, other researchers, program staff, other community members, and so on.
Then we put all data in single framework & apply various statistical tools to find out the dynamic on the market.
During the analysis stage, feedback from the stakeholder groups would be compared to determine areas of agreement as well as areas of divergence