

Key Insights
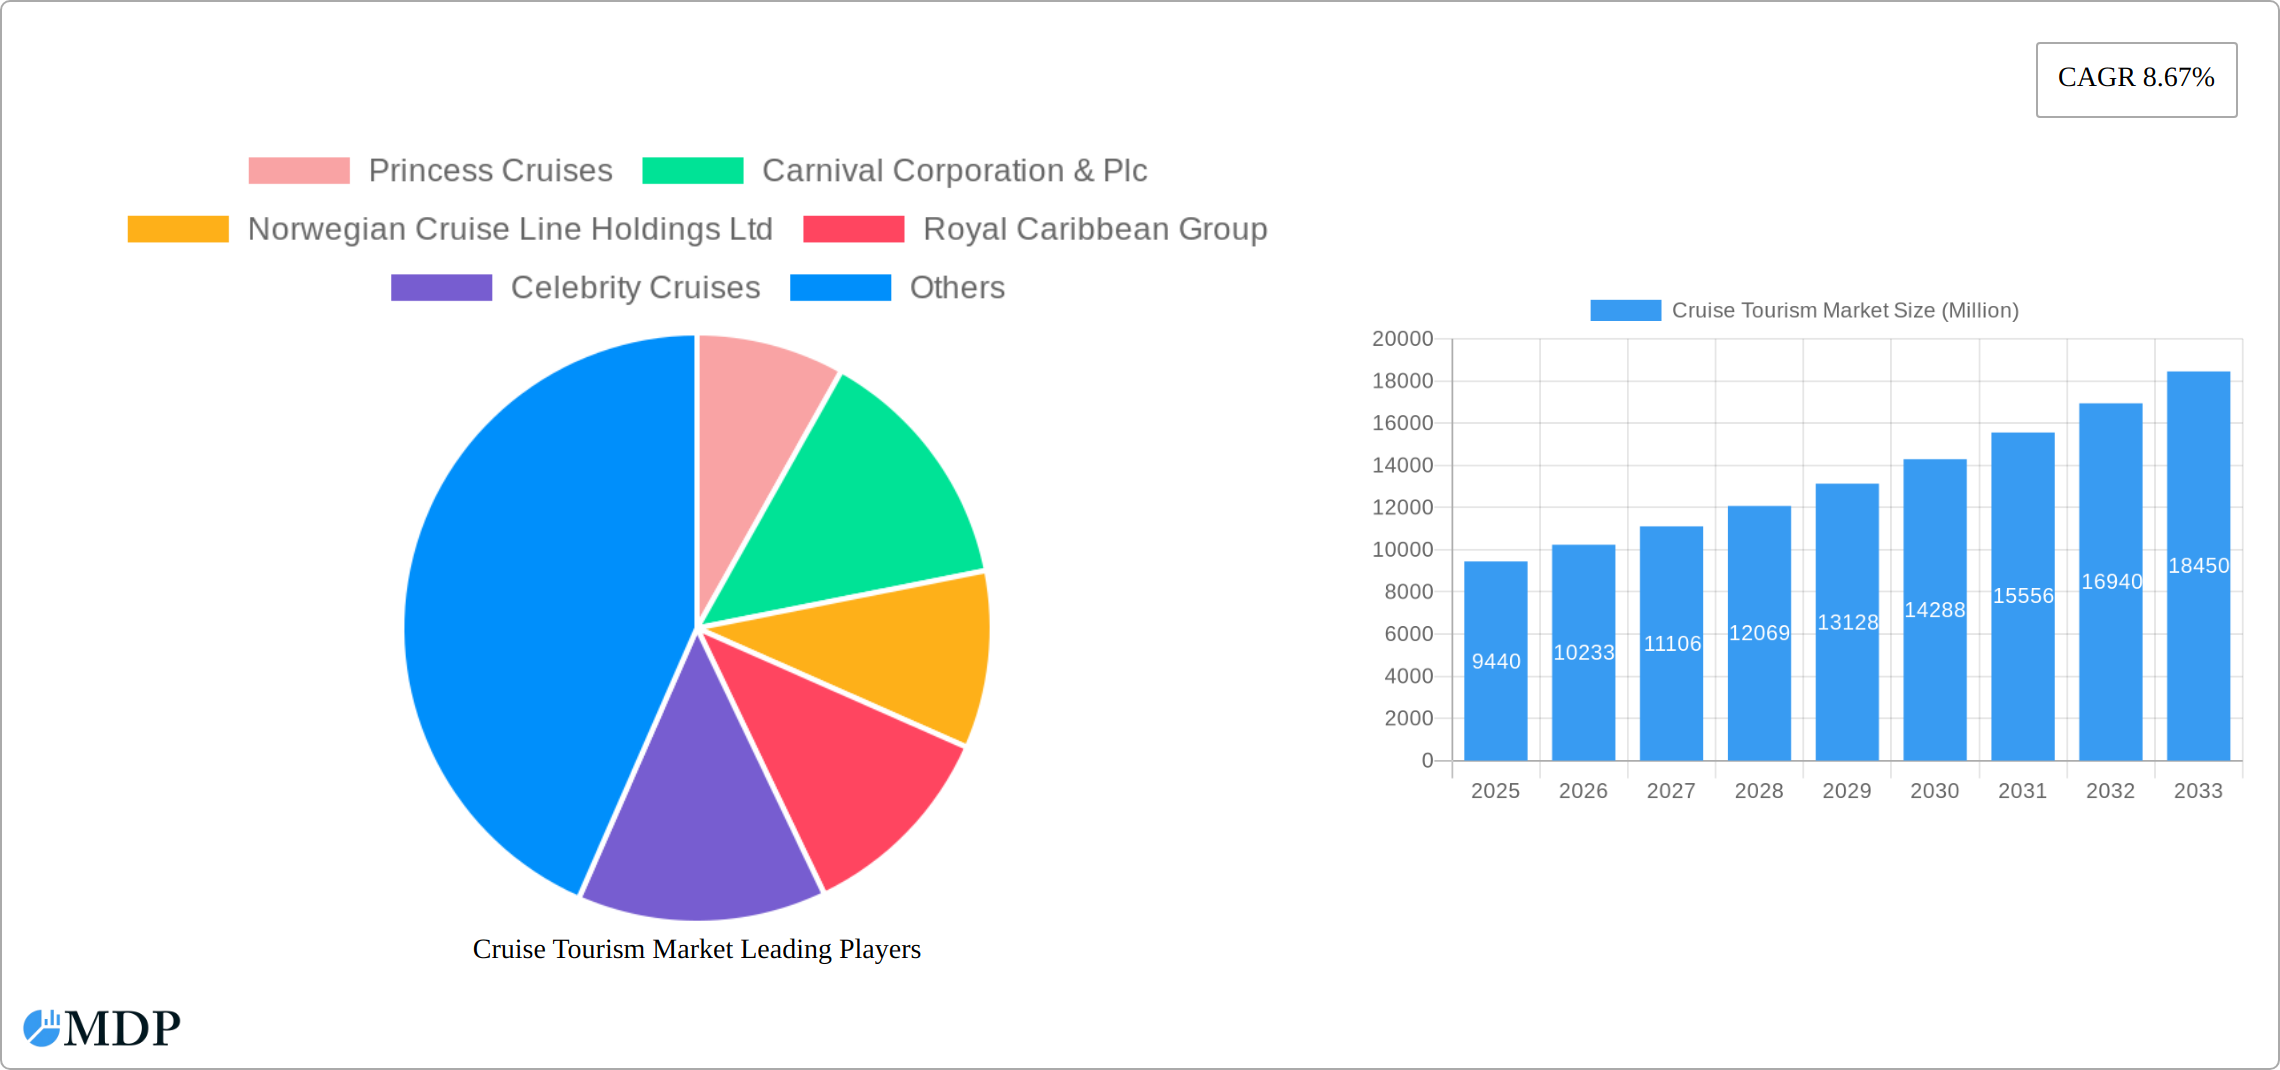
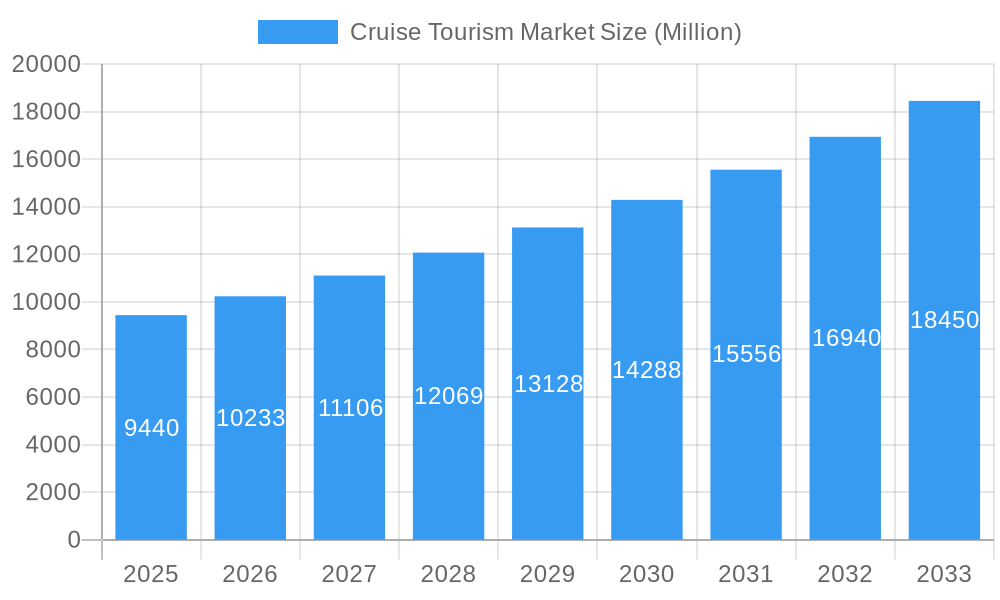
The global cruise tourism market, valued at $9.44 billion in 2025, is projected to experience robust growth, exhibiting a compound annual growth rate (CAGR) of 8.67% from 2025 to 2033. This expansion is driven by several factors. Increased disposable incomes, particularly in emerging economies, are fueling demand for leisure travel, with cruises offering an attractive all-inclusive vacation package. The rising popularity of experiential travel, a preference for unique and memorable vacations, further boosts the sector. Technological advancements in cruise ship design and onboard amenities enhance the overall passenger experience, attracting a wider demographic. Furthermore, the strategic marketing efforts of major cruise lines, offering diverse itineraries and targeted promotions, contribute significantly to market growth. The market is segmented by passenger age, cruise type (river, ocean, expedition, theme, adventure), and trip duration, providing insights into specific consumer preferences and market opportunities. The North American market currently holds a significant share, followed by Europe and the Asia-Pacific region, though the latter is expected to witness faster growth driven by rising middle-class incomes and increased tourism infrastructure.
Cruise Tourism Market Market Size (In Billion)
However, the cruise tourism market also faces certain restraints. Environmental concerns, particularly regarding pollution and its impact on marine ecosystems, are prompting stricter regulations and increasing scrutiny from environmentally conscious travelers. Economic downturns and geopolitical instability can significantly affect travel patterns, impacting demand. Fluctuations in fuel prices and currency exchange rates also pose challenges to the industry's profitability. Competition among established cruise lines remains intense, necessitating continuous innovation and strategic partnerships to maintain market share. Successfully navigating these challenges requires a focus on sustainable practices, flexible pricing strategies, and a commitment to providing exceptional customer experiences. The cruise industry’s resilience and adaptability will be critical in sustaining its projected growth trajectory over the forecast period.
Cruise Tourism Market Company Market Share
Cruise Tourism Market Report: A Comprehensive Analysis (2019-2033)
This in-depth report provides a comprehensive analysis of the global cruise tourism market, offering invaluable insights for industry stakeholders, investors, and strategic decision-makers. With a detailed study period spanning from 2019 to 2033 (Base Year: 2025, Estimated Year: 2025, Forecast Period: 2025-2033, Historical Period: 2019-2024), this report unveils the market's dynamics, trends, and future potential. The market is projected to reach xx Million by 2033, exhibiting a CAGR of xx% during the forecast period. Key players such as Princess Cruises, Carnival Corporation & Plc, Norwegian Cruise Line Holdings Ltd, Royal Caribbean Group, and many more are analyzed, providing a clear picture of the competitive landscape.
Cruise Tourism Market Dynamics & Concentration
The cruise tourism market is characterized by moderate concentration, with a few major players holding significant market share. The market share of the top 5 players is estimated at xx% in 2025. Innovation is a key driver, with companies constantly introducing new itineraries, ships, and onboard experiences to cater to evolving consumer preferences. Regulatory frameworks, including safety regulations and environmental concerns, significantly impact market operations. Product substitutes, such as land-based vacations and other forms of travel, pose a competitive challenge. End-user trends, such as a preference for luxury experiences and sustainable travel, shape market demand. M&A activities have played a role in consolidating the market, with xx major deals recorded between 2019 and 2024.
- Market Concentration: Top 5 players hold approximately xx% of the market share in 2025.
- Innovation Drivers: Introduction of new ship designs, sustainable technologies, and immersive experiences.
- Regulatory Frameworks: International Maritime Organization (IMO) regulations, port regulations, and environmental protection laws.
- Product Substitutes: Land-based tourism, all-inclusive resorts, and adventure travel.
- End-User Trends: Growing demand for luxury cruises, personalized experiences, and sustainable travel options.
- M&A Activities: xx major mergers and acquisitions recorded from 2019 to 2024.
Cruise Tourism Market Industry Trends & Analysis
The global cruise tourism market is experiencing robust growth, driven by factors such as rising disposable incomes, increased leisure time, and a growing preference for experiential travel. Technological disruptions, including the adoption of digital booking platforms and enhanced onboard technologies, are transforming the customer experience. Consumer preferences are shifting towards personalized itineraries, sustainable practices, and unique destination experiences. Competitive dynamics are intense, with companies focusing on differentiation through innovative offerings and strategic partnerships. The market penetration of cruise tourism is estimated at xx% in 2025, with an anticipated growth to xx% by 2033.
Leading Markets & Segments in Cruise Tourism Market
The North American market currently dominates the global cruise tourism sector, followed by Europe. Within passenger age segments, the 40-59 years age group represents the largest market share, followed closely by the 20-39 years age group. Ocean cruises account for the largest share of the cruise type segment, while cruises lasting 8-14 days are most prevalent.
- Dominant Region: North America, followed by Europe.
- Dominant Passenger Age Segment: 40-59 years, followed by 20-39 years.
- Dominant Cruise Type: Ocean cruises.
- Dominant Cruise Duration: 8-14 days.
- Key Drivers:
- Economic Factors: Rising disposable incomes, increased tourism spending.
- Infrastructure: Development of cruise ports and improved accessibility.
Cruise Tourism Market Product Developments
The cruise tourism market is witnessing a dynamic evolution in its product offerings, driven by an unwavering commitment to elevating passenger experiences, optimizing operational efficiencies, and championing environmental stewardship. This forward-thinking approach manifests in the integration of cutting-edge onboard technologies, from hyper-personalized entertainment platforms and immersive augmented reality adventures to sophisticated AI-powered concierges. Concurrently, a significant shift towards more sustainable ship designs is evident, incorporating advanced energy-efficient propulsion systems, eco-friendly waste management solutions, and the utilization of cleaner fuels. These innovations collectively aim to deliver an unparalleled value proposition to discerning travelers while actively addressing and mitigating the environmental footprint of the cruise industry, setting new benchmarks for responsible and enriching voyages.
Key Drivers of Cruise Tourism Market Growth
The cruise tourism market's robust expansion is propelled by a confluence of powerful forces. Technologically, the market is being reshaped by sophisticated booking platforms, seamless digital integration onboard, and innovative passenger-facing applications that significantly enhance convenience and personalization. Economically, a global surge in disposable incomes and a growing middle class in emerging economies are making cruising more accessible and desirable. Favorable geopolitical landscapes, coupled with the strategic relaxation of travel regulations, are further unlocking new markets and encouraging international travel. Moreover, substantial investments in port infrastructure and destination development are creating more diverse and appealing itineraries, directly fueling market growth.
Challenges in the Cruise Tourism Market
The cruise tourism market faces several challenges, including stringent environmental regulations that require costly investments in sustainable technologies. Supply chain disruptions from global events can cause operational difficulties and price volatility. Intense competition among cruise lines necessitates differentiation and efficient cost management. The overall effect of these challenges is estimated to impact annual revenue by approximately xx Million.
Emerging Opportunities in Cruise Tourism Market
The cruise tourism landscape is brimming with exciting new avenues for growth. Beyond traditional destinations, there's a significant push towards exploring and developing markets in underexplored regions, offering unique cultural and geographical experiences. The rise of specialized and niche cruise offerings is a major trend, catering to diverse passenger interests such as expeditionary adventures to remote locales, ultra-luxury private yacht-style experiences, immersive wellness and mindfulness retreats at sea, and educational voyages focused on specific historical or scientific themes. Furthermore, the strategic adoption of advanced technologies, including blockchain for secure passenger identification and personalized data analytics for bespoke itinerary planning, is opening up new frontiers for customer engagement and service delivery. Synergistic collaborations between cruise lines, destination management organizations, and local experience providers are also crucial for unlocking innovative package deals and enhancing the overall vacation offering.
Leading Players in the Cruise Tourism Market Sector
Key Milestones in Cruise Tourism Market Industry
- November 2023: TravClan and Resorts World Cruises forged a strategic partnership, aiming to democratize cruise tourism in India by enhancing accessibility and affordability for a wider segment of the population.
- October 2023: Traveltek and Cruise Planners solidified a significant alliance, designed to leverage their combined expertise and technological capabilities to revolutionize and streamline the national cruise booking experience for both consumers and travel agents.
Strategic Outlook for Cruise Tourism Market
The future of the cruise tourism market appears promising, with continued growth driven by technological innovations, expanding tourism infrastructure, and increasing consumer demand for unique travel experiences. Strategic partnerships, targeted marketing, and a focus on sustainable practices will be crucial for companies to thrive in this dynamic market. The market is expected to see significant expansion in Asia-Pacific and emerging markets in the coming years.
Cruise Tourism Market Segmentation
-
1. Type
- 1.1. River Cruise
- 1.2. Ocean Cruise
- 1.3. Expedition Cruise
- 1.4. Theme Cruise
- 1.5. Adventure Cruise
- 1.6. Others
-
2. Duration
- 2.1. 1-7Days
- 2.2. 8-14 Days
- 2.3. 15-20 Days
- 2.4. More than 21 Days
-
3. Passenger Age
- 3.1. Less than 12 years
- 3.2. 13-19 Years
- 3.3. 20-39 Years
- 3.4. 40-59 Years
- 3.5. Above 60 Years
Cruise Tourism Market Segmentation By Geography
-
1. North America
- 1.1. US
- 1.2. Canada
- 1.3. Mexico
- 1.4. Rest of North America
-
2. Europe
- 2.1. Germany
- 2.2. UK
- 2.3. France
- 2.4. Russia
- 2.5. Spain
- 2.6. Rest of Europe
-
3. Asia Pacific
- 3.1. India
- 3.2. China
- 3.3. Japan
- 3.4. Rest of Asia Pacific
-
4. South America
- 4.1. Brazil
- 4.2. Argentina
- 4.3. Rest of South America
-
5. Middle East
- 5.1. UAE
- 5.2. Saudi Arabia
- 5.3. Rest of Middle East
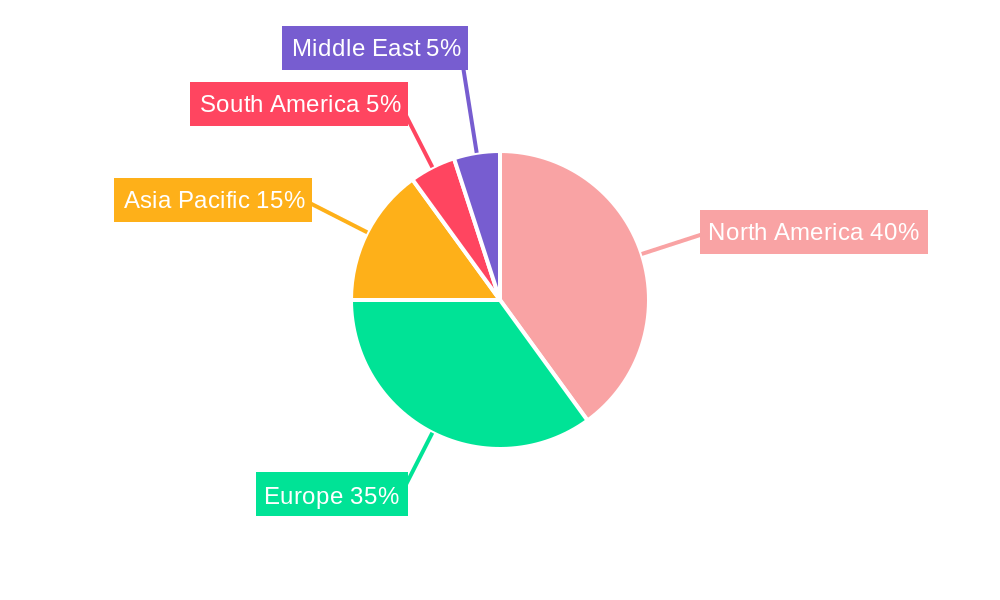
Cruise Tourism Market Regional Market Share
Geographic Coverage of Cruise Tourism Market
Cruise Tourism Market REPORT HIGHLIGHTS
| Aspects | Details |
|---|---|
| Study Period | 2020-2034 |
| Base Year | 2025 |
| Estimated Year | 2026 |
| Forecast Period | 2026-2034 |
| Historical Period | 2020-2025 |
| Growth Rate | CAGR of 8.67% from 2020-2034 |
| Segmentation |
|
Table of Contents
- 1. Introduction
- 1.1. Research Scope
- 1.2. Market Segmentation
- 1.3. Research Objective
- 1.4. Definitions and Assumptions
- 2. Executive Summary
- 2.1. Market Snapshot
- 3. Market Dynamics
- 3.1. Market Drivers
- 3.2. Market Restrains
- 3.3. Market Trends
- 3.4. Market Opportunities
- 4. Market Factor Analysis
- 4.1. Porters Five Forces
- 4.1.1. Bargaining Power of Suppliers
- 4.1.2. Bargaining Power of Buyers
- 4.1.3. Threat of New Entrants
- 4.1.4. Threat of Substitutes
- 4.1.5. Competitive Rivalry
- 4.2. PESTEL analysis
- 4.3. BCG Analysis
- 4.3.1. Stars (High Growth, High Market Share)
- 4.3.2. Cash Cows (Low Growth, High Market Share)
- 4.3.3. Question Mark (High Growth, Low Market Share)
- 4.3.4. Dogs (Low Growth, Low Market Share)
- 4.4. Ansoff Matrix Analysis
- 4.5. Supply Chain Analysis
- 4.6. Regulatory Landscape
- 4.7. Current Market Potential and Opportunity Assessment (TAM–SAM–SOM Framework)
- 4.8. MDP Analyst Note
- 4.1. Porters Five Forces
- 5. Market Analysis, Insights and Forecast 2021-2033
- 5.1. Market Analysis, Insights and Forecast - by Type
- 5.1.1. River Cruise
- 5.1.2. Ocean Cruise
- 5.1.3. Expedition Cruise
- 5.1.4. Theme Cruise
- 5.1.5. Adventure Cruise
- 5.1.6. Others
- 5.2. Market Analysis, Insights and Forecast - by Duration
- 5.2.1. 1-7Days
- 5.2.2. 8-14 Days
- 5.2.3. 15-20 Days
- 5.2.4. More than 21 Days
- 5.3. Market Analysis, Insights and Forecast - by Passenger Age
- 5.3.1. Less than 12 years
- 5.3.2. 13-19 Years
- 5.3.3. 20-39 Years
- 5.3.4. 40-59 Years
- 5.3.5. Above 60 Years
- 5.4. Market Analysis, Insights and Forecast - by Region
- 5.4.1. North America
- 5.4.2. Europe
- 5.4.3. Asia Pacific
- 5.4.4. South America
- 5.4.5. Middle East
- 5.1. Market Analysis, Insights and Forecast - by Type
- 6. Global Cruise Tourism Market Analysis, Insights and Forecast, 2021-2033
- 6.1. Market Analysis, Insights and Forecast - by Type
- 6.1.1. River Cruise
- 6.1.2. Ocean Cruise
- 6.1.3. Expedition Cruise
- 6.1.4. Theme Cruise
- 6.1.5. Adventure Cruise
- 6.1.6. Others
- 6.2. Market Analysis, Insights and Forecast - by Duration
- 6.2.1. 1-7Days
- 6.2.2. 8-14 Days
- 6.2.3. 15-20 Days
- 6.2.4. More than 21 Days
- 6.3. Market Analysis, Insights and Forecast - by Passenger Age
- 6.3.1. Less than 12 years
- 6.3.2. 13-19 Years
- 6.3.3. 20-39 Years
- 6.3.4. 40-59 Years
- 6.3.5. Above 60 Years
- 6.1. Market Analysis, Insights and Forecast - by Type
- 7. North America Cruise Tourism Market Analysis, Insights and Forecast, 2020-2032
- 7.1. Market Analysis, Insights and Forecast - by Type
- 7.1.1. River Cruise
- 7.1.2. Ocean Cruise
- 7.1.3. Expedition Cruise
- 7.1.4. Theme Cruise
- 7.1.5. Adventure Cruise
- 7.1.6. Others
- 7.2. Market Analysis, Insights and Forecast - by Duration
- 7.2.1. 1-7Days
- 7.2.2. 8-14 Days
- 7.2.3. 15-20 Days
- 7.2.4. More than 21 Days
- 7.3. Market Analysis, Insights and Forecast - by Passenger Age
- 7.3.1. Less than 12 years
- 7.3.2. 13-19 Years
- 7.3.3. 20-39 Years
- 7.3.4. 40-59 Years
- 7.3.5. Above 60 Years
- 7.1. Market Analysis, Insights and Forecast - by Type
- 8. Europe Cruise Tourism Market Analysis, Insights and Forecast, 2020-2032
- 8.1. Market Analysis, Insights and Forecast - by Type
- 8.1.1. River Cruise
- 8.1.2. Ocean Cruise
- 8.1.3. Expedition Cruise
- 8.1.4. Theme Cruise
- 8.1.5. Adventure Cruise
- 8.1.6. Others
- 8.2. Market Analysis, Insights and Forecast - by Duration
- 8.2.1. 1-7Days
- 8.2.2. 8-14 Days
- 8.2.3. 15-20 Days
- 8.2.4. More than 21 Days
- 8.3. Market Analysis, Insights and Forecast - by Passenger Age
- 8.3.1. Less than 12 years
- 8.3.2. 13-19 Years
- 8.3.3. 20-39 Years
- 8.3.4. 40-59 Years
- 8.3.5. Above 60 Years
- 8.1. Market Analysis, Insights and Forecast - by Type
- 9. Asia Pacific Cruise Tourism Market Analysis, Insights and Forecast, 2020-2032
- 9.1. Market Analysis, Insights and Forecast - by Type
- 9.1.1. River Cruise
- 9.1.2. Ocean Cruise
- 9.1.3. Expedition Cruise
- 9.1.4. Theme Cruise
- 9.1.5. Adventure Cruise
- 9.1.6. Others
- 9.2. Market Analysis, Insights and Forecast - by Duration
- 9.2.1. 1-7Days
- 9.2.2. 8-14 Days
- 9.2.3. 15-20 Days
- 9.2.4. More than 21 Days
- 9.3. Market Analysis, Insights and Forecast - by Passenger Age
- 9.3.1. Less than 12 years
- 9.3.2. 13-19 Years
- 9.3.3. 20-39 Years
- 9.3.4. 40-59 Years
- 9.3.5. Above 60 Years
- 9.1. Market Analysis, Insights and Forecast - by Type
- 10. South America Cruise Tourism Market Analysis, Insights and Forecast, 2020-2032
- 10.1. Market Analysis, Insights and Forecast - by Type
- 10.1.1. River Cruise
- 10.1.2. Ocean Cruise
- 10.1.3. Expedition Cruise
- 10.1.4. Theme Cruise
- 10.1.5. Adventure Cruise
- 10.1.6. Others
- 10.2. Market Analysis, Insights and Forecast - by Duration
- 10.2.1. 1-7Days
- 10.2.2. 8-14 Days
- 10.2.3. 15-20 Days
- 10.2.4. More than 21 Days
- 10.3. Market Analysis, Insights and Forecast - by Passenger Age
- 10.3.1. Less than 12 years
- 10.3.2. 13-19 Years
- 10.3.3. 20-39 Years
- 10.3.4. 40-59 Years
- 10.3.5. Above 60 Years
- 10.1. Market Analysis, Insights and Forecast - by Type
- 11. Middle East Cruise Tourism Market Analysis, Insights and Forecast, 2020-2032
- 11.1. Market Analysis, Insights and Forecast - by Type
- 11.1.1. River Cruise
- 11.1.2. Ocean Cruise
- 11.1.3. Expedition Cruise
- 11.1.4. Theme Cruise
- 11.1.5. Adventure Cruise
- 11.1.6. Others
- 11.2. Market Analysis, Insights and Forecast - by Duration
- 11.2.1. 1-7Days
- 11.2.2. 8-14 Days
- 11.2.3. 15-20 Days
- 11.2.4. More than 21 Days
- 11.3. Market Analysis, Insights and Forecast - by Passenger Age
- 11.3.1. Less than 12 years
- 11.3.2. 13-19 Years
- 11.3.3. 20-39 Years
- 11.3.4. 40-59 Years
- 11.3.5. Above 60 Years
- 11.1. Market Analysis, Insights and Forecast - by Type
- 12. Competitive Analysis
- 12.1. Company Profiles
- 12.1.1 Princess Cruises
- 12.1.1.1. Company Overview
- 12.1.1.2. Products
- 12.1.1.3. Company Financials
- 12.1.1.4. SWOT Analysis
- 12.1.2 Carnival Corporation & Plc
- 12.1.2.1. Company Overview
- 12.1.2.2. Products
- 12.1.2.3. Company Financials
- 12.1.2.4. SWOT Analysis
- 12.1.3 Norwegian Cruise Line Holdings Ltd
- 12.1.3.1. Company Overview
- 12.1.3.2. Products
- 12.1.3.3. Company Financials
- 12.1.3.4. SWOT Analysis
- 12.1.4 Royal Caribbean Group
- 12.1.4.1. Company Overview
- 12.1.4.2. Products
- 12.1.4.3. Company Financials
- 12.1.4.4. SWOT Analysis
- 12.1.5 Celebrity Cruises
- 12.1.5.1. Company Overview
- 12.1.5.2. Products
- 12.1.5.3. Company Financials
- 12.1.5.4. SWOT Analysis
- 12.1.6 Costa Cruises
- 12.1.6.1. Company Overview
- 12.1.6.2. Products
- 12.1.6.3. Company Financials
- 12.1.6.4. SWOT Analysis
- 12.1.7 Holland America Line
- 12.1.7.1. Company Overview
- 12.1.7.2. Products
- 12.1.7.3. Company Financials
- 12.1.7.4. SWOT Analysis
- 12.1.8 MSC Cruises
- 12.1.8.1. Company Overview
- 12.1.8.2. Products
- 12.1.8.3. Company Financials
- 12.1.8.4. SWOT Analysis
- 12.1.9 Disney Cruise Line
- 12.1.9.1. Company Overview
- 12.1.9.2. Products
- 12.1.9.3. Company Financials
- 12.1.9.4. SWOT Analysis
- 12.1.10 Cunard Line**List Not Exhaustive
- 12.1.10.1. Company Overview
- 12.1.10.2. Products
- 12.1.10.3. Company Financials
- 12.1.10.4. SWOT Analysis
- 12.1.1 Princess Cruises
- 12.2. Market Entropy
- 12.2.1 Company's Key Areas Served
- 12.2.2 Recent Developments
- 12.3. Company Market Share Analysis 2025
- 12.3.1 Top 5 Companies Market Share Analysis
- 12.3.2 Top 3 Companies Market Share Analysis
- 12.4. List of Potential Customers
- 13. Research Methodology
List of Figures
- Figure 1: Global Cruise Tourism Market Revenue Breakdown (Million, %) by Region 2025 & 2033
- Figure 2: North America Cruise Tourism Market Revenue (Million), by Type 2025 & 2033
- Figure 3: North America Cruise Tourism Market Revenue Share (%), by Type 2025 & 2033
- Figure 4: North America Cruise Tourism Market Revenue (Million), by Duration 2025 & 2033
- Figure 5: North America Cruise Tourism Market Revenue Share (%), by Duration 2025 & 2033
- Figure 6: North America Cruise Tourism Market Revenue (Million), by Passenger Age 2025 & 2033
- Figure 7: North America Cruise Tourism Market Revenue Share (%), by Passenger Age 2025 & 2033
- Figure 8: North America Cruise Tourism Market Revenue (Million), by Country 2025 & 2033
- Figure 9: North America Cruise Tourism Market Revenue Share (%), by Country 2025 & 2033
- Figure 10: Europe Cruise Tourism Market Revenue (Million), by Type 2025 & 2033
- Figure 11: Europe Cruise Tourism Market Revenue Share (%), by Type 2025 & 2033
- Figure 12: Europe Cruise Tourism Market Revenue (Million), by Duration 2025 & 2033
- Figure 13: Europe Cruise Tourism Market Revenue Share (%), by Duration 2025 & 2033
- Figure 14: Europe Cruise Tourism Market Revenue (Million), by Passenger Age 2025 & 2033
- Figure 15: Europe Cruise Tourism Market Revenue Share (%), by Passenger Age 2025 & 2033
- Figure 16: Europe Cruise Tourism Market Revenue (Million), by Country 2025 & 2033
- Figure 17: Europe Cruise Tourism Market Revenue Share (%), by Country 2025 & 2033
- Figure 18: Asia Pacific Cruise Tourism Market Revenue (Million), by Type 2025 & 2033
- Figure 19: Asia Pacific Cruise Tourism Market Revenue Share (%), by Type 2025 & 2033
- Figure 20: Asia Pacific Cruise Tourism Market Revenue (Million), by Duration 2025 & 2033
- Figure 21: Asia Pacific Cruise Tourism Market Revenue Share (%), by Duration 2025 & 2033
- Figure 22: Asia Pacific Cruise Tourism Market Revenue (Million), by Passenger Age 2025 & 2033
- Figure 23: Asia Pacific Cruise Tourism Market Revenue Share (%), by Passenger Age 2025 & 2033
- Figure 24: Asia Pacific Cruise Tourism Market Revenue (Million), by Country 2025 & 2033
- Figure 25: Asia Pacific Cruise Tourism Market Revenue Share (%), by Country 2025 & 2033
- Figure 26: South America Cruise Tourism Market Revenue (Million), by Type 2025 & 2033
- Figure 27: South America Cruise Tourism Market Revenue Share (%), by Type 2025 & 2033
- Figure 28: South America Cruise Tourism Market Revenue (Million), by Duration 2025 & 2033
- Figure 29: South America Cruise Tourism Market Revenue Share (%), by Duration 2025 & 2033
- Figure 30: South America Cruise Tourism Market Revenue (Million), by Passenger Age 2025 & 2033
- Figure 31: South America Cruise Tourism Market Revenue Share (%), by Passenger Age 2025 & 2033
- Figure 32: South America Cruise Tourism Market Revenue (Million), by Country 2025 & 2033
- Figure 33: South America Cruise Tourism Market Revenue Share (%), by Country 2025 & 2033
- Figure 34: Middle East Cruise Tourism Market Revenue (Million), by Type 2025 & 2033
- Figure 35: Middle East Cruise Tourism Market Revenue Share (%), by Type 2025 & 2033
- Figure 36: Middle East Cruise Tourism Market Revenue (Million), by Duration 2025 & 2033
- Figure 37: Middle East Cruise Tourism Market Revenue Share (%), by Duration 2025 & 2033
- Figure 38: Middle East Cruise Tourism Market Revenue (Million), by Passenger Age 2025 & 2033
- Figure 39: Middle East Cruise Tourism Market Revenue Share (%), by Passenger Age 2025 & 2033
- Figure 40: Middle East Cruise Tourism Market Revenue (Million), by Country 2025 & 2033
- Figure 41: Middle East Cruise Tourism Market Revenue Share (%), by Country 2025 & 2033
List of Tables
- Table 1: Global Cruise Tourism Market Revenue Million Forecast, by Type 2020 & 2033
- Table 2: Global Cruise Tourism Market Revenue Million Forecast, by Duration 2020 & 2033
- Table 3: Global Cruise Tourism Market Revenue Million Forecast, by Passenger Age 2020 & 2033
- Table 4: Global Cruise Tourism Market Revenue Million Forecast, by Region 2020 & 2033
- Table 5: Global Cruise Tourism Market Revenue Million Forecast, by Type 2020 & 2033
- Table 6: Global Cruise Tourism Market Revenue Million Forecast, by Duration 2020 & 2033
- Table 7: Global Cruise Tourism Market Revenue Million Forecast, by Passenger Age 2020 & 2033
- Table 8: Global Cruise Tourism Market Revenue Million Forecast, by Country 2020 & 2033
- Table 9: US Cruise Tourism Market Revenue (Million) Forecast, by Application 2020 & 2033
- Table 10: Canada Cruise Tourism Market Revenue (Million) Forecast, by Application 2020 & 2033
- Table 11: Mexico Cruise Tourism Market Revenue (Million) Forecast, by Application 2020 & 2033
- Table 12: Rest of North America Cruise Tourism Market Revenue (Million) Forecast, by Application 2020 & 2033
- Table 13: Global Cruise Tourism Market Revenue Million Forecast, by Type 2020 & 2033
- Table 14: Global Cruise Tourism Market Revenue Million Forecast, by Duration 2020 & 2033
- Table 15: Global Cruise Tourism Market Revenue Million Forecast, by Passenger Age 2020 & 2033
- Table 16: Global Cruise Tourism Market Revenue Million Forecast, by Country 2020 & 2033
- Table 17: Germany Cruise Tourism Market Revenue (Million) Forecast, by Application 2020 & 2033
- Table 18: UK Cruise Tourism Market Revenue (Million) Forecast, by Application 2020 & 2033
- Table 19: France Cruise Tourism Market Revenue (Million) Forecast, by Application 2020 & 2033
- Table 20: Russia Cruise Tourism Market Revenue (Million) Forecast, by Application 2020 & 2033
- Table 21: Spain Cruise Tourism Market Revenue (Million) Forecast, by Application 2020 & 2033
- Table 22: Rest of Europe Cruise Tourism Market Revenue (Million) Forecast, by Application 2020 & 2033
- Table 23: Global Cruise Tourism Market Revenue Million Forecast, by Type 2020 & 2033
- Table 24: Global Cruise Tourism Market Revenue Million Forecast, by Duration 2020 & 2033
- Table 25: Global Cruise Tourism Market Revenue Million Forecast, by Passenger Age 2020 & 2033
- Table 26: Global Cruise Tourism Market Revenue Million Forecast, by Country 2020 & 2033
- Table 27: India Cruise Tourism Market Revenue (Million) Forecast, by Application 2020 & 2033
- Table 28: China Cruise Tourism Market Revenue (Million) Forecast, by Application 2020 & 2033
- Table 29: Japan Cruise Tourism Market Revenue (Million) Forecast, by Application 2020 & 2033
- Table 30: Rest of Asia Pacific Cruise Tourism Market Revenue (Million) Forecast, by Application 2020 & 2033
- Table 31: Global Cruise Tourism Market Revenue Million Forecast, by Type 2020 & 2033
- Table 32: Global Cruise Tourism Market Revenue Million Forecast, by Duration 2020 & 2033
- Table 33: Global Cruise Tourism Market Revenue Million Forecast, by Passenger Age 2020 & 2033
- Table 34: Global Cruise Tourism Market Revenue Million Forecast, by Country 2020 & 2033
- Table 35: Brazil Cruise Tourism Market Revenue (Million) Forecast, by Application 2020 & 2033
- Table 36: Argentina Cruise Tourism Market Revenue (Million) Forecast, by Application 2020 & 2033
- Table 37: Rest of South America Cruise Tourism Market Revenue (Million) Forecast, by Application 2020 & 2033
- Table 38: Global Cruise Tourism Market Revenue Million Forecast, by Type 2020 & 2033
- Table 39: Global Cruise Tourism Market Revenue Million Forecast, by Duration 2020 & 2033
- Table 40: Global Cruise Tourism Market Revenue Million Forecast, by Passenger Age 2020 & 2033
- Table 41: Global Cruise Tourism Market Revenue Million Forecast, by Country 2020 & 2033
- Table 42: UAE Cruise Tourism Market Revenue (Million) Forecast, by Application 2020 & 2033
- Table 43: Saudi Arabia Cruise Tourism Market Revenue (Million) Forecast, by Application 2020 & 2033
- Table 44: Rest of Middle East Cruise Tourism Market Revenue (Million) Forecast, by Application 2020 & 2033
Frequently Asked Questions
1. What is the projected Compound Annual Growth Rate (CAGR) of the Cruise Tourism Market?
The projected CAGR is approximately 8.67%.
2. Which companies are prominent players in the Cruise Tourism Market?
Key companies in the market include Princess Cruises, Carnival Corporation & Plc, Norwegian Cruise Line Holdings Ltd, Royal Caribbean Group, Celebrity Cruises, Costa Cruises, Holland America Line, MSC Cruises, Disney Cruise Line, Cunard Line**List Not Exhaustive.
3. What are the main segments of the Cruise Tourism Market?
The market segments include Type, Duration, Passenger Age.
4. Can you provide details about the market size?
The market size is estimated to be USD 9.44 Million as of 2022.
5. What are some drivers contributing to market growth?
Increasing Disposable Income is Driving the Market.
6. What are the notable trends driving market growth?
Increase in Number of Ocean Cruise Passengers in North America.
7. Are there any restraints impacting market growth?
High Costs is Restraining the Market.
8. Can you provide examples of recent developments in the market?
November 2023: TravClan and Resorts World Cruises joined forces in a groundbreaking partnership aimed at revolutionizing cruise tourism in India. Through this collaboration, TravClan embarks on a transformative journey that promises to redefine the landscape of cruise vacations in India, ensuring accessibility and affordability for all.
9. What pricing options are available for accessing the report?
Pricing options include single-user, multi-user, and enterprise licenses priced at USD 4750, USD 5250, and USD 8750 respectively.
10. Is the market size provided in terms of value or volume?
The market size is provided in terms of value, measured in Million.
11. Are there any specific market keywords associated with the report?
Yes, the market keyword associated with the report is "Cruise Tourism Market," which aids in identifying and referencing the specific market segment covered.
12. How do I determine which pricing option suits my needs best?
The pricing options vary based on user requirements and access needs. Individual users may opt for single-user licenses, while businesses requiring broader access may choose multi-user or enterprise licenses for cost-effective access to the report.
13. Are there any additional resources or data provided in the Cruise Tourism Market report?
While the report offers comprehensive insights, it's advisable to review the specific contents or supplementary materials provided to ascertain if additional resources or data are available.
14. How can I stay updated on further developments or reports in the Cruise Tourism Market?
To stay informed about further developments, trends, and reports in the Cruise Tourism Market, consider subscribing to industry newsletters, following relevant companies and organizations, or regularly checking reputable industry news sources and publications.
Methodology
Step 1 - Identification of Relevant Samples Size from Population Database


Step 2 - Approaches for Defining Global Market Size (Value, Volume* & Price*)

Note*: In applicable scenarios
Step 3 - Data Sources
Primary Research
- Web Analytics
- Survey Reports
- Research Institute
- Latest Research Reports
- Opinion Leaders
Secondary Research
- Annual Reports
- White Paper
- Latest Press Release
- Industry Association
- Paid Database
- Investor Presentations

Step 4 - Data Triangulation
Involves using different sources of information in order to increase the validity of a study
These sources are likely to be stakeholders in a program - participants, other researchers, program staff, other community members, and so on.
Then we put all data in single framework & apply various statistical tools to find out the dynamic on the market.
During the analysis stage, feedback from the stakeholder groups would be compared to determine areas of agreement as well as areas of divergence