

Key Insights
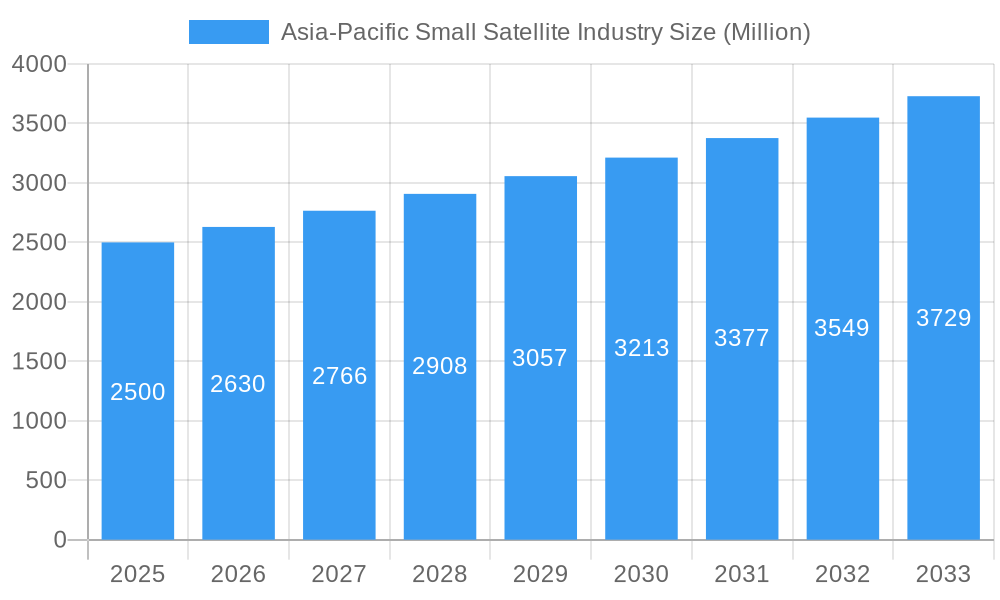
The Asia-Pacific small satellite industry is poised for significant expansion, fueled by the escalating demand for cost-effective and adaptable space-based solutions. This growth is propelled by the region's advancing technological infrastructure, favorable government initiatives, and increased private investment in space technologies. The market is projected to grow at a Compound Annual Growth Rate (CAGR) of 31% from a market size of $3.79 billion in the base year 2025, reaching a substantial valuation by 2033. Key application segments driving this expansion include communication, earth observation, and navigation, with emerging opportunities in space-based Internet of Things (IoT) and environmental monitoring. The market is segmented by orbit class, with Low Earth Orbit (LEO) satellites showing exceptional growth due to reduced launch costs and faster development cycles. Advances in electric propulsion technology are further enhancing operational efficiency and cost-effectiveness, contributing to market acceleration. Leading the regional market are China, Japan, India, and South Korea, supported by substantial government funding and strong domestic space industries. However, regulatory complexities and the need for a skilled workforce remain key challenges to sustainable growth.
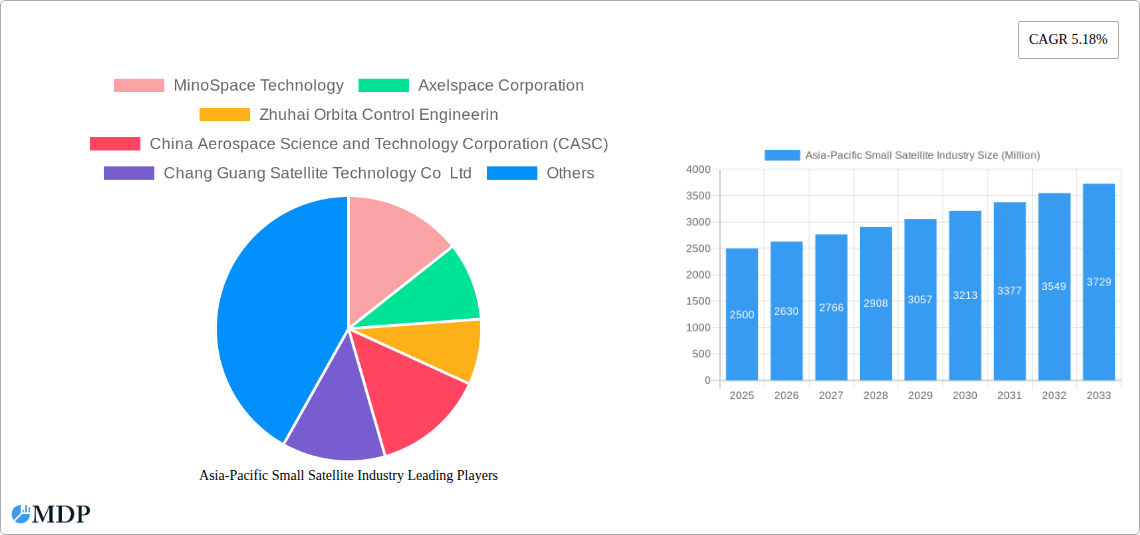
Asia-Pacific Small Satellite Industry Market Size (In Billion)
The competitive environment is dynamic, featuring established entities such as China Aerospace Science and Technology Corporation (CASC) alongside innovative players like MinoSpace Technology and Axelspace Corporation. Future market trajectory will be shaped by ongoing technological innovation, strategic public-private collaborations, and advancements in efficient launch services, cost-effective satellite manufacturing, and sophisticated data analytics. Fostering innovation within the small satellite ecosystem, including optimized regulatory frameworks and dedicated funding, is crucial for sustained growth and maximizing the extensive potential of the Asia-Pacific small satellite market. The increasing adoption of small satellites across diverse sectors, coupled with declining launch and manufacturing expenses, will underpin consistent market expansion in the foreseeable future.
Asia-Pacific Small Satellite Industry Company Market Share
Asia-Pacific Small Satellite Industry Market Report: 2019-2033
This comprehensive report provides an in-depth analysis of the Asia-Pacific small satellite industry, offering invaluable insights for industry stakeholders, investors, and policymakers. Covering the period 2019-2033, with a focus on 2025, this report forecasts robust growth and identifies key opportunities and challenges within this dynamic sector. The report leverages extensive market research and data analysis to present a detailed overview of market size, segmentation, key players, and future trends. Download now to gain a competitive edge!
Asia-Pacific Small Satellite Industry Market Dynamics & Concentration
The Asia-Pacific small satellite market is experiencing rapid growth, driven by increasing demand for affordable and accessible space-based solutions. Market concentration is relatively high, with a few dominant players alongside numerous emerging companies. The market share of the top 5 players in 2025 is estimated at 60%, with CASC holding the largest share. Innovation is a key driver, fueled by advancements in miniaturization, propulsion technology, and data analytics. Regulatory frameworks vary across the region, influencing market access and investment. Product substitutes, such as drone technology, present some competitive pressure, though the unique capabilities of small satellites maintain their distinct advantages. End-user trends indicate a strong preference for customized solutions, particularly in the commercial and government sectors. M&A activity has been steadily increasing, with an estimated xx M&A deals in the last five years, reflecting consolidation within the industry.
- Market Concentration: Top 5 players hold approximately 60% market share in 2025.
- Innovation Drivers: Miniaturization, advanced propulsion, improved data analytics.
- Regulatory Frameworks: Vary significantly across the region, impacting market access.
- M&A Activity: Estimated xx deals in the last 5 years.
Asia-Pacific Small Satellite Industry Industry Trends & Analysis
The Asia-Pacific small satellite industry exhibits a Compound Annual Growth Rate (CAGR) of xx% during the forecast period (2025-2033). This robust growth is fueled by several factors, including the decreasing cost of launch services, advancements in miniaturization and propulsion technologies, and increasing demand from diverse sectors such as Earth observation, communication, and navigation. Technological disruptions, such as the emergence of CubeSats and nanosatellites, are reshaping the industry landscape. Consumer preferences lean towards customized solutions with higher data throughput and reduced latency. Competitive dynamics are characterized by both intense competition and collaborative partnerships. Market penetration in key segments, such as Earth Observation, is expected to reach xx% by 2033.
Leading Markets & Segments in Asia-Pacific Small Satellite Industry
China dominates the Asia-Pacific small satellite market, accounting for approximately 70% of the total market value in 2025. This dominance is driven by significant government investment, robust domestic manufacturing capabilities, and a thriving space program. Within the segments, Earth Observation constitutes the largest share, driven by increasing demand for high-resolution imagery and environmental monitoring. The LEO (Low Earth Orbit) segment accounts for the largest share of satellite launches owing to the cost-effectiveness and shorter lead times for development. The commercial end-user segment is the fastest-growing, driven by the increasing adoption of small satellites for various applications.
- Key Drivers for China's Dominance:
- Extensive government funding and support.
- Strong domestic manufacturing capacity.
- Proactive space exploration and commercialization policies.
- Dominant Segments: Earth Observation (Application), LEO (Orbit Class), Commercial (End-User).
Asia-Pacific Small Satellite Industry Product Developments
Recent years have witnessed significant product innovations in the Asia-Pacific small satellite industry, characterized by smaller, lighter, and more capable satellites. Advancements in miniaturization technologies, improved propulsion systems, and enhanced onboard computing capabilities have enabled the development of highly specialized satellites for various applications. These innovations are leading to increased market penetration and broader adoption across diverse sectors. The focus on miniaturization and modular design fosters flexibility, enabling customized solutions tailored to specific user requirements.
Key Drivers of Asia-Pacific Small Satellite Industry Growth
Several factors are driving the growth of the Asia-Pacific small satellite industry. Technological advancements, particularly in miniaturization and propulsion technologies, are making small satellites more affordable and accessible. Economic factors, such as government incentives and private investment, are fueling the growth of the industry. Favorable regulatory frameworks in some countries are simplifying the process of launching and operating small satellites. Examples include China's ongoing investment in space infrastructure and India's increasing emphasis on space-based services.
Challenges in the Asia-Pacific Small Satellite Industry Market
Despite promising growth prospects, the Asia-Pacific small satellite industry faces several challenges. Regulatory hurdles vary across the region, creating inconsistencies and potentially hindering market expansion. Supply chain disruptions can affect the production and launch of satellites, impacting delivery timelines and overall costs. Intense competition among established and emerging players puts pressure on pricing and profit margins. These challenges require collaborative efforts among stakeholders to mitigate risks and foster sustainable growth. The estimated cost of overcoming these challenges is approximately xx Million annually.
Emerging Opportunities in Asia-Pacific Small Satellite Industry
Long-term growth in the Asia-Pacific small satellite industry is fueled by several emerging opportunities. Advancements in AI and machine learning capabilities enhance data analytics and improve satellite operations. Strategic partnerships between governments, private companies, and research institutions are fostering innovation and accelerating the deployment of new technologies. Expansion into new markets and applications, such as IoT connectivity and disaster management, offers significant potential for growth.
Leading Players in the Asia-Pacific Small Satellite Industry Sector
- MinoSpace Technology
- Axelspace Corporation
- Zhuhai Orbita Control Engineering
- China Aerospace Science and Technology Corporation (CASC)
- Chang Guang Satellite Technology Co Ltd
- Spacety Aerospace Co
- Guodian Gaoke
Key Milestones in Asia-Pacific Small Satellite Industry Industry
- March 2022: The China Aerospace Science and Technology Corporation (CASC) successfully launched the Tiankun-2 satellites into a low-Earth polar orbit on the debut launch of the Long March 6A rocket. This marked a significant advancement in China's small satellite launch capabilities.
- March 2022: Guodian Gaoke's Tianqi 19 commercial data relay satellite was launched from the Long March 8 rocket. This highlights the increasing role of commercial entities in the small satellite industry.
- February 2022: A total of 89 Jilin-1 optical imaging satellites manufactured by CASC, each weighing 30-45 kg, were launched into orbit. This demonstrates the growing demand for constellations of small satellites for Earth observation.
Strategic Outlook for Asia-Pacific Small Satellite Industry Market
The Asia-Pacific small satellite industry is poised for continued strong growth, driven by technological advancements, increasing demand for space-based services, and supportive government policies. Strategic opportunities exist in developing innovative applications, forming strategic partnerships, and expanding into new markets. Focusing on cost reduction, improved data analytics, and enhanced customer experience will be crucial for success. The market is predicted to reach a value of xx Million by 2033, presenting significant opportunities for investment and growth.
Asia-Pacific Small Satellite Industry Segmentation
-
1. Application
- 1.1. Communication
- 1.2. Earth Observation
- 1.3. Navigation
- 1.4. Space Observation
- 1.5. Others
-
2. Orbit Class
- 2.1. GEO
- 2.2. LEO
- 2.3. MEO
-
3. End User
- 3.1. Commercial
- 3.2. Military & Government
- 3.3. Other
-
4. Propulsion Tech
- 4.1. Electric
- 4.2. Gas based
- 4.3. Liquid Fuel
Asia-Pacific Small Satellite Industry Segmentation By Geography
-
1. Asia Pacific
- 1.1. China
- 1.2. Japan
- 1.3. South Korea
- 1.4. India
- 1.5. Australia
- 1.6. New Zealand
- 1.7. Indonesia
- 1.8. Malaysia
- 1.9. Singapore
- 1.10. Thailand
- 1.11. Vietnam
- 1.12. Philippines
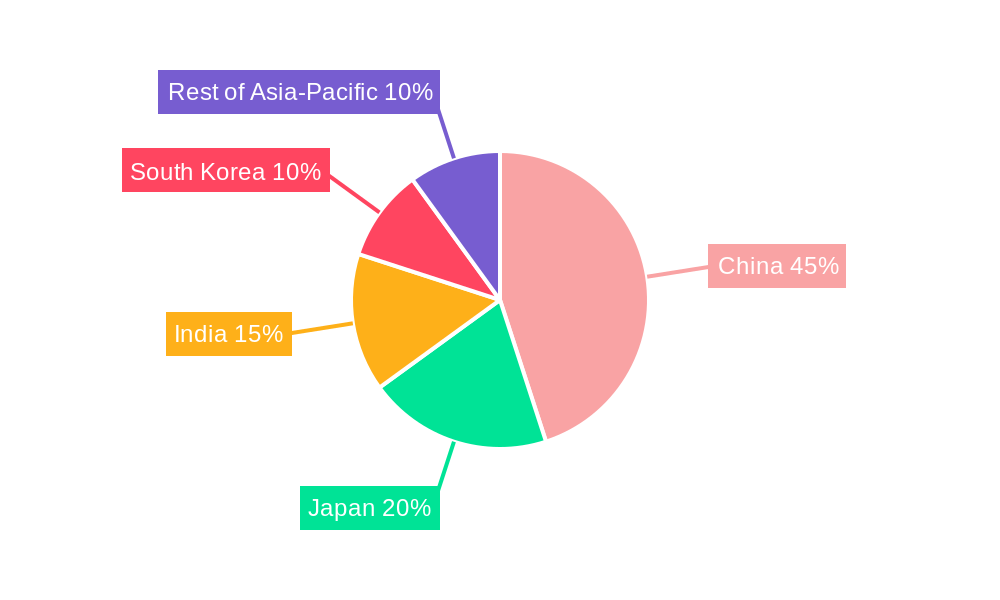
Asia-Pacific Small Satellite Industry Regional Market Share
Geographic Coverage of Asia-Pacific Small Satellite Industry
Asia-Pacific Small Satellite Industry REPORT HIGHLIGHTS
| Aspects | Details |
|---|---|
| Study Period | 2020-2034 |
| Base Year | 2025 |
| Estimated Year | 2026 |
| Forecast Period | 2026-2034 |
| Historical Period | 2020-2025 |
| Growth Rate | CAGR of 31% from 2020-2034 |
| Segmentation |
|
Table of Contents
- 1. Introduction
- 1.1. Research Scope
- 1.2. Market Segmentation
- 1.3. Research Objective
- 1.4. Definitions and Assumptions
- 2. Executive Summary
- 2.1. Market Snapshot
- 3. Market Dynamics
- 3.1. Market Drivers
- 3.2. Market Restrains
- 3.3. Market Trends
- 3.4. Market Opportunities
- 4. Market Factor Analysis
- 4.1. Porters Five Forces
- 4.1.1. Bargaining Power of Suppliers
- 4.1.2. Bargaining Power of Buyers
- 4.1.3. Threat of New Entrants
- 4.1.4. Threat of Substitutes
- 4.1.5. Competitive Rivalry
- 4.2. PESTEL analysis
- 4.3. BCG Analysis
- 4.3.1. Stars (High Growth, High Market Share)
- 4.3.2. Cash Cows (Low Growth, High Market Share)
- 4.3.3. Question Mark (High Growth, Low Market Share)
- 4.3.4. Dogs (Low Growth, Low Market Share)
- 4.4. Ansoff Matrix Analysis
- 4.5. Supply Chain Analysis
- 4.6. Regulatory Landscape
- 4.7. Current Market Potential and Opportunity Assessment (TAM–SAM–SOM Framework)
- 4.8. MDP Analyst Note
- 4.1. Porters Five Forces
- 5. Market Analysis, Insights and Forecast 2021-2033
- 5.1. Market Analysis, Insights and Forecast - by Application
- 5.1.1. Communication
- 5.1.2. Earth Observation
- 5.1.3. Navigation
- 5.1.4. Space Observation
- 5.1.5. Others
- 5.2. Market Analysis, Insights and Forecast - by Orbit Class
- 5.2.1. GEO
- 5.2.2. LEO
- 5.2.3. MEO
- 5.3. Market Analysis, Insights and Forecast - by End User
- 5.3.1. Commercial
- 5.3.2. Military & Government
- 5.3.3. Other
- 5.4. Market Analysis, Insights and Forecast - by Propulsion Tech
- 5.4.1. Electric
- 5.4.2. Gas based
- 5.4.3. Liquid Fuel
- 5.5. Market Analysis, Insights and Forecast - by Region
- 5.5.1. Asia Pacific
- 5.1. Market Analysis, Insights and Forecast - by Application
- 6. Asia-Pacific Small Satellite Industry Analysis, Insights and Forecast, 2021-2033
- 6.1. Market Analysis, Insights and Forecast - by Application
- 6.1.1. Communication
- 6.1.2. Earth Observation
- 6.1.3. Navigation
- 6.1.4. Space Observation
- 6.1.5. Others
- 6.2. Market Analysis, Insights and Forecast - by Orbit Class
- 6.2.1. GEO
- 6.2.2. LEO
- 6.2.3. MEO
- 6.3. Market Analysis, Insights and Forecast - by End User
- 6.3.1. Commercial
- 6.3.2. Military & Government
- 6.3.3. Other
- 6.4. Market Analysis, Insights and Forecast - by Propulsion Tech
- 6.4.1. Electric
- 6.4.2. Gas based
- 6.4.3. Liquid Fuel
- 6.1. Market Analysis, Insights and Forecast - by Application
- 7. Competitive Analysis
- 7.1. Company Profiles
- 7.1.1 MinoSpace Technology
- 7.1.1.1. Company Overview
- 7.1.1.2. Products
- 7.1.1.3. Company Financials
- 7.1.1.4. SWOT Analysis
- 7.1.2 Axelspace Corporation
- 7.1.2.1. Company Overview
- 7.1.2.2. Products
- 7.1.2.3. Company Financials
- 7.1.2.4. SWOT Analysis
- 7.1.3 Zhuhai Orbita Control Engineerin
- 7.1.3.1. Company Overview
- 7.1.3.2. Products
- 7.1.3.3. Company Financials
- 7.1.3.4. SWOT Analysis
- 7.1.4 China Aerospace Science and Technology Corporation (CASC)
- 7.1.4.1. Company Overview
- 7.1.4.2. Products
- 7.1.4.3. Company Financials
- 7.1.4.4. SWOT Analysis
- 7.1.5 Chang Guang Satellite Technology Co Ltd
- 7.1.5.1. Company Overview
- 7.1.5.2. Products
- 7.1.5.3. Company Financials
- 7.1.5.4. SWOT Analysis
- 7.1.6 Spacety Aerospace Co
- 7.1.6.1. Company Overview
- 7.1.6.2. Products
- 7.1.6.3. Company Financials
- 7.1.6.4. SWOT Analysis
- 7.1.7 Guodian Gaoke
- 7.1.7.1. Company Overview
- 7.1.7.2. Products
- 7.1.7.3. Company Financials
- 7.1.7.4. SWOT Analysis
- 7.1.1 MinoSpace Technology
- 7.2. Market Entropy
- 7.2.1 Company's Key Areas Served
- 7.2.2 Recent Developments
- 7.3. Company Market Share Analysis 2025
- 7.3.1 Top 5 Companies Market Share Analysis
- 7.3.2 Top 3 Companies Market Share Analysis
- 7.4. List of Potential Customers
- 8. Research Methodology
List of Figures
- Figure 1: Asia-Pacific Small Satellite Industry Revenue Breakdown (billion, %) by Product 2025 & 2033
- Figure 2: Asia-Pacific Small Satellite Industry Share (%) by Company 2025
List of Tables
- Table 1: Asia-Pacific Small Satellite Industry Revenue billion Forecast, by Application 2020 & 2033
- Table 2: Asia-Pacific Small Satellite Industry Revenue billion Forecast, by Orbit Class 2020 & 2033
- Table 3: Asia-Pacific Small Satellite Industry Revenue billion Forecast, by End User 2020 & 2033
- Table 4: Asia-Pacific Small Satellite Industry Revenue billion Forecast, by Propulsion Tech 2020 & 2033
- Table 5: Asia-Pacific Small Satellite Industry Revenue billion Forecast, by Region 2020 & 2033
- Table 6: Asia-Pacific Small Satellite Industry Revenue billion Forecast, by Application 2020 & 2033
- Table 7: Asia-Pacific Small Satellite Industry Revenue billion Forecast, by Orbit Class 2020 & 2033
- Table 8: Asia-Pacific Small Satellite Industry Revenue billion Forecast, by End User 2020 & 2033
- Table 9: Asia-Pacific Small Satellite Industry Revenue billion Forecast, by Propulsion Tech 2020 & 2033
- Table 10: Asia-Pacific Small Satellite Industry Revenue billion Forecast, by Country 2020 & 2033
- Table 11: China Asia-Pacific Small Satellite Industry Revenue (billion) Forecast, by Application 2020 & 2033
- Table 12: Japan Asia-Pacific Small Satellite Industry Revenue (billion) Forecast, by Application 2020 & 2033
- Table 13: South Korea Asia-Pacific Small Satellite Industry Revenue (billion) Forecast, by Application 2020 & 2033
- Table 14: India Asia-Pacific Small Satellite Industry Revenue (billion) Forecast, by Application 2020 & 2033
- Table 15: Australia Asia-Pacific Small Satellite Industry Revenue (billion) Forecast, by Application 2020 & 2033
- Table 16: New Zealand Asia-Pacific Small Satellite Industry Revenue (billion) Forecast, by Application 2020 & 2033
- Table 17: Indonesia Asia-Pacific Small Satellite Industry Revenue (billion) Forecast, by Application 2020 & 2033
- Table 18: Malaysia Asia-Pacific Small Satellite Industry Revenue (billion) Forecast, by Application 2020 & 2033
- Table 19: Singapore Asia-Pacific Small Satellite Industry Revenue (billion) Forecast, by Application 2020 & 2033
- Table 20: Thailand Asia-Pacific Small Satellite Industry Revenue (billion) Forecast, by Application 2020 & 2033
- Table 21: Vietnam Asia-Pacific Small Satellite Industry Revenue (billion) Forecast, by Application 2020 & 2033
- Table 22: Philippines Asia-Pacific Small Satellite Industry Revenue (billion) Forecast, by Application 2020 & 2033
Frequently Asked Questions
1. What is the projected Compound Annual Growth Rate (CAGR) of the Asia-Pacific Small Satellite Industry?
The projected CAGR is approximately 31%.
2. Which companies are prominent players in the Asia-Pacific Small Satellite Industry?
Key companies in the market include MinoSpace Technology, Axelspace Corporation, Zhuhai Orbita Control Engineerin, China Aerospace Science and Technology Corporation (CASC), Chang Guang Satellite Technology Co Ltd, Spacety Aerospace Co, Guodian Gaoke.
3. What are the main segments of the Asia-Pacific Small Satellite Industry?
The market segments include Application, Orbit Class, End User, Propulsion Tech.
4. Can you provide details about the market size?
The market size is estimated to be USD 3.79 billion as of 2022.
5. What are some drivers contributing to market growth?
N/A
6. What are the notable trends driving market growth?
Satellites that are being launched into LEO is driving the market demand.
7. Are there any restraints impacting market growth?
N/A
8. Can you provide examples of recent developments in the market?
March 2022: The China Aerospace Science and Technology Corporation successfully launched the Tiankun-2 satellites into a low-Earth polar orbit on the debut launch of the Long March 6A.March 2022: Guodian Gaoke's Tianqi 19 commercial data relay satellite was launched from the Long March 8 rocket.February 2022: A total of 89 Jilin-1 optical imaging satellites manufactured by CASC each weighing 30-45 kg were launched into orbit.
9. What pricing options are available for accessing the report?
Pricing options include single-user, multi-user, and enterprise licenses priced at USD 3800, USD 4500, and USD 5800 respectively.
10. Is the market size provided in terms of value or volume?
The market size is provided in terms of value, measured in billion.
11. Are there any specific market keywords associated with the report?
Yes, the market keyword associated with the report is "Asia-Pacific Small Satellite Industry," which aids in identifying and referencing the specific market segment covered.
12. How do I determine which pricing option suits my needs best?
The pricing options vary based on user requirements and access needs. Individual users may opt for single-user licenses, while businesses requiring broader access may choose multi-user or enterprise licenses for cost-effective access to the report.
13. Are there any additional resources or data provided in the Asia-Pacific Small Satellite Industry report?
While the report offers comprehensive insights, it's advisable to review the specific contents or supplementary materials provided to ascertain if additional resources or data are available.
14. How can I stay updated on further developments or reports in the Asia-Pacific Small Satellite Industry?
To stay informed about further developments, trends, and reports in the Asia-Pacific Small Satellite Industry, consider subscribing to industry newsletters, following relevant companies and organizations, or regularly checking reputable industry news sources and publications.
Methodology
Step 1 - Identification of Relevant Samples Size from Population Database


Step 2 - Approaches for Defining Global Market Size (Value, Volume* & Price*)

Note*: In applicable scenarios
Step 3 - Data Sources
Primary Research
- Web Analytics
- Survey Reports
- Research Institute
- Latest Research Reports
- Opinion Leaders
Secondary Research
- Annual Reports
- White Paper
- Latest Press Release
- Industry Association
- Paid Database
- Investor Presentations

Step 4 - Data Triangulation
Involves using different sources of information in order to increase the validity of a study
These sources are likely to be stakeholders in a program - participants, other researchers, program staff, other community members, and so on.
Then we put all data in single framework & apply various statistical tools to find out the dynamic on the market.
During the analysis stage, feedback from the stakeholder groups would be compared to determine areas of agreement as well as areas of divergence