

Key Insights
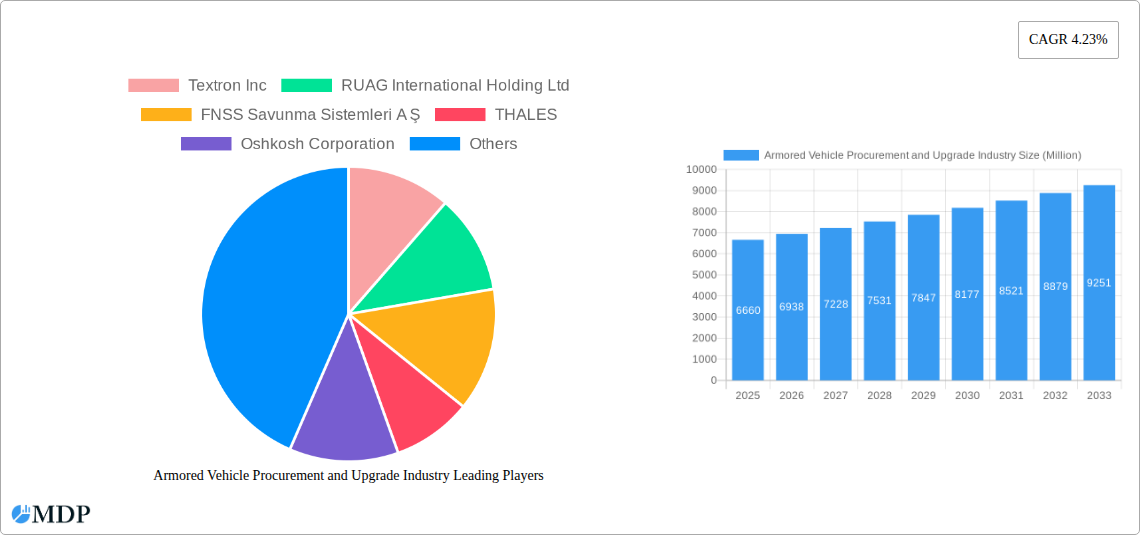
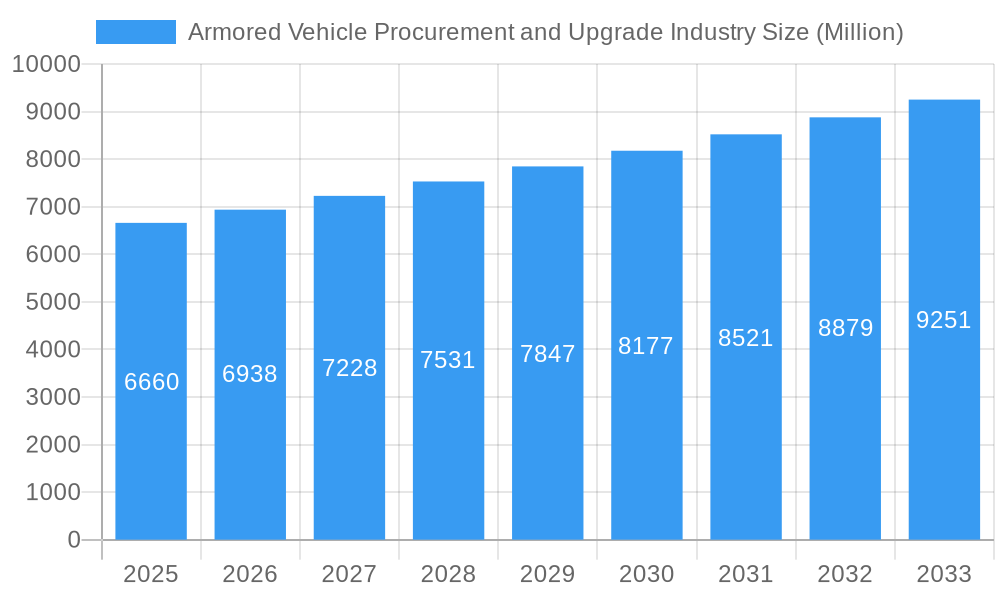
The Armored Vehicle Procurement and Upgrade industry, valued at $6.66 billion in 2025, is projected to experience robust growth, driven by escalating geopolitical tensions, modernization of defense forces, and the increasing demand for advanced protection technologies. A Compound Annual Growth Rate (CAGR) of 4.23% from 2025 to 2033 indicates a significant expansion of the market over the forecast period. Key drivers include the rising need for enhanced troop protection against asymmetric warfare tactics, technological advancements in armor materials and integrated systems (e.g., improved surveillance and communication capabilities), and substantial defense budgets allocated by major global powers. The industry segmentation reveals significant market share distribution across various vehicle types, with Armored Personnel Carriers (APCs), Infantry Fighting Vehicles (IFVs), and Mine-resistant Ambush Protected (MRAP) vehicles commanding significant portions. Furthermore, the continuous development and integration of advanced technologies like active protection systems and unmanned capabilities will continue to shape market dynamics.
Armored Vehicle Procurement and Upgrade Industry Market Size (In Billion)
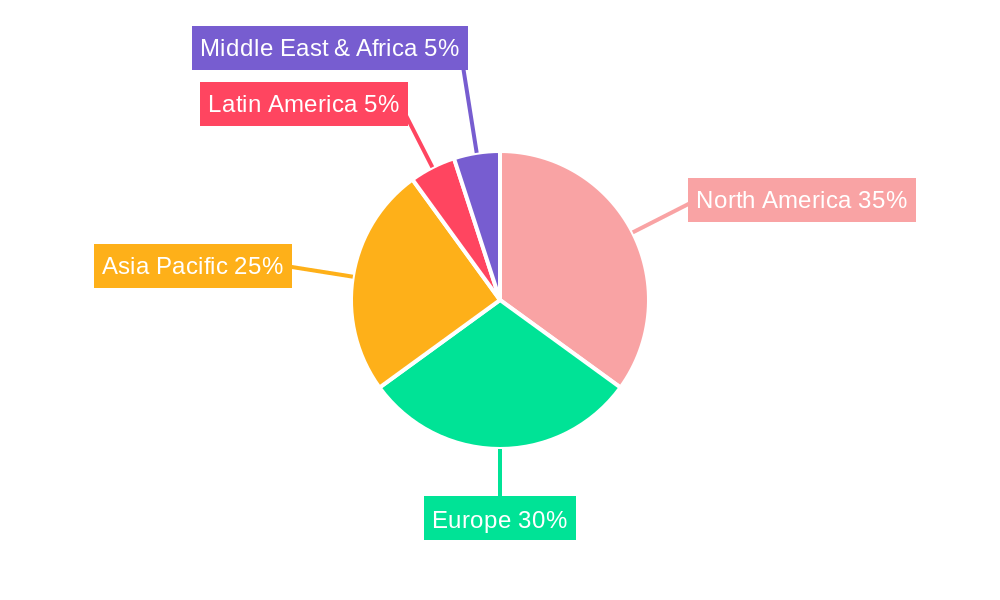
Regional market dynamics are significantly influenced by defense spending patterns and geopolitical considerations. North America and Europe are currently major markets, accounting for a substantial share due to the presence of key industry players and significant military modernization initiatives. However, the Asia-Pacific region is anticipated to witness substantial growth in the coming years, fueled by increased defense budgets and regional security concerns. This shift in regional dynamics presents lucrative opportunities for established and emerging players in the industry. Competition amongst major manufacturers such as Textron, Oshkosh, General Dynamics, Rheinmetall, and BAE Systems, amongst others, is intense, prompting continuous innovation and technological advancements to maintain a competitive edge. This competitive landscape, coupled with continuous technological advancements, ensures a dynamic and evolving market environment.
Armored Vehicle Procurement and Upgrade Industry Company Market Share
Armored Vehicle Procurement and Upgrade Industry: A Comprehensive Market Report (2019-2033)
This comprehensive report provides an in-depth analysis of the Armored Vehicle Procurement and Upgrade Industry, offering invaluable insights for stakeholders across the global landscape. With a focus on market dynamics, leading players, and future trends, this report is essential for strategic decision-making in this dynamic sector. The study period covers 2019-2033, with a base year of 2025 and a forecast period of 2025-2033. The report leverages a wealth of data covering the historical period of 2019-2024, providing a robust foundation for future projections. The total market size in 2025 is estimated at $xx Million.
Armored Vehicle Procurement and Upgrade Industry Market Dynamics & Concentration
The global armored vehicle procurement and upgrade market is characterized by a moderately concentrated landscape, with a handful of major players holding significant market share. Market concentration is influenced by factors such as technological advancements, stringent regulatory frameworks, and the considerable capital investment required for R&D and production. The industry witnesses substantial M&A activity, with xx major deals recorded in the past five years, driven by a need to consolidate market power, expand geographical reach, and enhance technological capabilities. Innovation is a key driver, with companies continually striving to develop advanced features such as improved protection systems, enhanced mobility, and advanced technologies like AI integration for enhanced situational awareness. The regulatory landscape is complex and varies considerably across countries, impacting procurement decisions and market access. End-user trends indicate a growing demand for highly versatile, adaptable armored vehicles suitable for diverse operational environments. Product substitutes, while limited, include improved fortification of existing assets, which is gaining popularity in certain contexts.
- Market Share: The top 5 players hold an estimated xx% of the global market share in 2025.
- M&A Activity: An average of xx M&A deals per year were observed between 2019 and 2024.
- Innovation Drivers: AI-integrated systems, enhanced protection technologies, and improved mobility are key drivers of innovation.
- Regulatory Frameworks: Varying national regulations heavily influence market access and procurement strategies.
Armored Vehicle Procurement and Upgrade Industry Industry Trends & Analysis
The armored vehicle procurement and upgrade market is projected to experience robust growth, with a Compound Annual Growth Rate (CAGR) of xx% during the forecast period (2025-2033). This growth is fueled by several factors, including escalating geopolitical tensions, increased defense budgets globally, and the ongoing demand for modernization of existing fleets. Technological advancements, particularly in areas such as advanced materials, sensor technology, and unmanned systems, are driving innovation and shaping market trends. Consumer preference is shifting towards lighter, more agile vehicles with enhanced protection features and improved survivability. Competitive dynamics are intensifying, with companies competing on factors such as price, technology, and after-sales support. Market penetration for next-generation armored vehicles is projected to reach xx% by 2033.
Leading Markets & Segments in Armored Vehicle Procurement and Upgrade Industry
The North American and European regions currently dominate the armored vehicle market, driven by significant defense budgets and ongoing modernization efforts. Within vehicle types, Armored Personnel Carriers (APCs) and Infantry Fighting Vehicles (IFVs) represent the largest segments due to their widespread use by military and security forces.
Key Drivers for Dominant Regions:
- North America: High defense spending, robust technological capabilities, and a strong domestic manufacturing base.
- Europe: Significant defense modernization initiatives, geopolitical instability, and a large established industry.
Dominant Vehicle Segments:
- APCs: High demand due to their versatility and suitability for various missions.
- IFVs: Essential for mechanized infantry operations, driving substantial market demand.
- MRAPs: Growing demand in counter-insurgency operations and peacekeeping missions.
- MBTs: A significant, albeit less rapidly growing, segment due to high acquisition costs.
Armored Vehicle Procurement and Upgrade Industry Product Developments
Recent product innovations include the integration of advanced composite materials to reduce weight and improve protection, the incorporation of sophisticated sensor suites for enhanced situational awareness, and the development of unmanned and remotely controlled systems. These advancements enhance the vehicles' effectiveness in modern warfare and provide significant competitive advantages. The market increasingly favors vehicles with improved mobility, survivability, and adaptability to diverse operational environments.
Key Drivers of Armored Vehicle Procurement and Upgrade Industry Growth
Several factors drive the growth of the armored vehicle procurement and upgrade industry. Increased geopolitical instability and rising defense budgets globally represent key drivers. Technological advancements, such as the development of more effective armor and weapon systems, also fuel growth. Furthermore, stringent regulatory requirements aimed at improving vehicle safety and performance push the market forward. The demand for modernized fleets and the need for advanced capabilities are also significant growth drivers.
Challenges in the Armored Vehicle Procurement and Upgrade Industry Market
The armored vehicle market faces several challenges. Stringent regulatory compliance requirements, particularly concerning export controls and environmental regulations, can impose considerable hurdles. Supply chain disruptions, especially regarding critical components and materials, pose significant risks. Intense competition from established and emerging players necessitates continuous innovation and efficient cost management to maintain market share. These challenges can lead to project delays and increased costs.
Emerging Opportunities in Armored Vehicle Procurement and Upgrade Industry
The long-term growth of the armored vehicle market is fueled by several opportunities. Technological breakthroughs, like AI-powered systems and autonomous capabilities, offer substantial market expansion potential. Strategic partnerships between defense companies and technology firms can lead to innovative products and enhanced competitiveness. Expansion into new markets, particularly in developing nations with growing defense budgets, presents significant opportunities for growth.
Leading Players in the Armored Vehicle Procurement and Upgrade Industry Sector
- Textron Inc
- RUAG International Holding Ltd
- FNSS Savunma Sistemleri A Ş
- THALES
- Oshkosh Corporation
- General Dynamics Corporation
- Rheinmetall AG
- Elbit Systems Ltd
- The CMI Group Inc
- BMC Otomotiv Sanayi ve Ticaret A Ş
- KNDS N V
- Streit Group
- IVECO S p A
- BAE Systems plc
Key Milestones in Armored Vehicle Procurement and Upgrade Industry Industry
- May 2023: Elbit Systems Ltd. secured a contract under the British Army's Project Vulcan, encompassing maintenance and operation of the GMST system, Boxer armored vehicles, and Challenger 3 tanks, including a comprehensive training management system. This highlights the growing demand for comprehensive support services alongside vehicle procurement.
- May 2023: The Czech MoD awarded a USD 2.2 Billion contract to BAE Systems plc for 246 CV90 Mk IV IFVs, and Slovakia ordered 152, replacing older BVP-1 IFVs. This significant contract win underscores the ongoing trend of fleet modernization and replacement of legacy systems.
Strategic Outlook for Armored Vehicle Procurement and Upgrade Industry Market
The armored vehicle market is poised for sustained growth, driven by ongoing geopolitical uncertainties and the increasing focus on military modernization across numerous countries. Strategic partnerships, technological innovation, and successful navigation of regulatory landscapes will be crucial for companies seeking to capitalize on the market's vast potential. Companies that successfully adapt to evolving technologies and changing market demands will secure the most significant opportunities for future expansion.
Armored Vehicle Procurement and Upgrade Industry Segmentation
-
1. Vehicle Type
- 1.1. Armored Personnel Carrier (APC)
- 1.2. Infantry Fighting Vehicle (IFV)
- 1.3. Mine-resistant Ambush Protected (MRAP)
- 1.4. Main Battle Tank (MBT)
- 1.5. Other Vehicle Types
Armored Vehicle Procurement and Upgrade Industry Segmentation By Geography
-
1. North America
- 1.1. United States
- 1.2. Canada
-
2. Europe
- 2.1. United Kingdom
- 2.2. France
- 2.3. Germany
- 2.4. Russia
- 2.5. Rest of Europe
-
3. Asia Pacific
- 3.1. China
- 3.2. India
- 3.3. Japan
- 3.4. South Korea
- 3.5. Australia
- 3.6. Rest of Asia Pacific
-
4. Latin America
- 4.1. Brazil
- 4.2. Mexico
- 4.3. Rest of Latin America
- 5. Middle East
-
6. United Arab Emirates
- 6.1. Saudi Arabia
- 6.2. Turkey
- 6.3. South Africa
- 6.4. Rest of Middle East and Africa
Armored Vehicle Procurement and Upgrade Industry Regional Market Share
Geographic Coverage of Armored Vehicle Procurement and Upgrade Industry
Armored Vehicle Procurement and Upgrade Industry REPORT HIGHLIGHTS
| Aspects | Details |
|---|---|
| Study Period | 2020-2034 |
| Base Year | 2025 |
| Estimated Year | 2026 |
| Forecast Period | 2026-2034 |
| Historical Period | 2020-2025 |
| Growth Rate | CAGR of 4.23% from 2020-2034 |
| Segmentation |
|
Table of Contents
- 1. Introduction
- 1.1. Research Scope
- 1.2. Market Segmentation
- 1.3. Research Objective
- 1.4. Definitions and Assumptions
- 2. Executive Summary
- 2.1. Market Snapshot
- 3. Market Dynamics
- 3.1. Market Drivers
- 3.2. Market Restrains
- 3.3. Market Trends
- 3.4. Market Opportunities
- 4. Market Factor Analysis
- 4.1. Porters Five Forces
- 4.1.1. Bargaining Power of Suppliers
- 4.1.2. Bargaining Power of Buyers
- 4.1.3. Threat of New Entrants
- 4.1.4. Threat of Substitutes
- 4.1.5. Competitive Rivalry
- 4.2. PESTEL analysis
- 4.3. BCG Analysis
- 4.3.1. Stars (High Growth, High Market Share)
- 4.3.2. Cash Cows (Low Growth, High Market Share)
- 4.3.3. Question Mark (High Growth, Low Market Share)
- 4.3.4. Dogs (Low Growth, Low Market Share)
- 4.4. Ansoff Matrix Analysis
- 4.5. Supply Chain Analysis
- 4.6. Regulatory Landscape
- 4.7. Current Market Potential and Opportunity Assessment (TAM–SAM–SOM Framework)
- 4.8. MDP Analyst Note
- 4.1. Porters Five Forces
- 5. Market Analysis, Insights and Forecast 2021-2033
- 5.1. Market Analysis, Insights and Forecast - by Vehicle Type
- 5.1.1. Armored Personnel Carrier (APC)
- 5.1.2. Infantry Fighting Vehicle (IFV)
- 5.1.3. Mine-resistant Ambush Protected (MRAP)
- 5.1.4. Main Battle Tank (MBT)
- 5.1.5. Other Vehicle Types
- 5.2. Market Analysis, Insights and Forecast - by Region
- 5.2.1. North America
- 5.2.2. Europe
- 5.2.3. Asia Pacific
- 5.2.4. Latin America
- 5.2.5. Middle East
- 5.2.6. United Arab Emirates
- 5.1. Market Analysis, Insights and Forecast - by Vehicle Type
- 6. Global Armored Vehicle Procurement and Upgrade Industry Analysis, Insights and Forecast, 2021-2033
- 6.1. Market Analysis, Insights and Forecast - by Vehicle Type
- 6.1.1. Armored Personnel Carrier (APC)
- 6.1.2. Infantry Fighting Vehicle (IFV)
- 6.1.3. Mine-resistant Ambush Protected (MRAP)
- 6.1.4. Main Battle Tank (MBT)
- 6.1.5. Other Vehicle Types
- 6.1. Market Analysis, Insights and Forecast - by Vehicle Type
- 7. North America Armored Vehicle Procurement and Upgrade Industry Analysis, Insights and Forecast, 2020-2032
- 7.1. Market Analysis, Insights and Forecast - by Vehicle Type
- 7.1.1. Armored Personnel Carrier (APC)
- 7.1.2. Infantry Fighting Vehicle (IFV)
- 7.1.3. Mine-resistant Ambush Protected (MRAP)
- 7.1.4. Main Battle Tank (MBT)
- 7.1.5. Other Vehicle Types
- 7.1. Market Analysis, Insights and Forecast - by Vehicle Type
- 8. Europe Armored Vehicle Procurement and Upgrade Industry Analysis, Insights and Forecast, 2020-2032
- 8.1. Market Analysis, Insights and Forecast - by Vehicle Type
- 8.1.1. Armored Personnel Carrier (APC)
- 8.1.2. Infantry Fighting Vehicle (IFV)
- 8.1.3. Mine-resistant Ambush Protected (MRAP)
- 8.1.4. Main Battle Tank (MBT)
- 8.1.5. Other Vehicle Types
- 8.1. Market Analysis, Insights and Forecast - by Vehicle Type
- 9. Asia Pacific Armored Vehicle Procurement and Upgrade Industry Analysis, Insights and Forecast, 2020-2032
- 9.1. Market Analysis, Insights and Forecast - by Vehicle Type
- 9.1.1. Armored Personnel Carrier (APC)
- 9.1.2. Infantry Fighting Vehicle (IFV)
- 9.1.3. Mine-resistant Ambush Protected (MRAP)
- 9.1.4. Main Battle Tank (MBT)
- 9.1.5. Other Vehicle Types
- 9.1. Market Analysis, Insights and Forecast - by Vehicle Type
- 10. Latin America Armored Vehicle Procurement and Upgrade Industry Analysis, Insights and Forecast, 2020-2032
- 10.1. Market Analysis, Insights and Forecast - by Vehicle Type
- 10.1.1. Armored Personnel Carrier (APC)
- 10.1.2. Infantry Fighting Vehicle (IFV)
- 10.1.3. Mine-resistant Ambush Protected (MRAP)
- 10.1.4. Main Battle Tank (MBT)
- 10.1.5. Other Vehicle Types
- 10.1. Market Analysis, Insights and Forecast - by Vehicle Type
- 11. Middle East Armored Vehicle Procurement and Upgrade Industry Analysis, Insights and Forecast, 2020-2032
- 11.1. Market Analysis, Insights and Forecast - by Vehicle Type
- 11.1.1. Armored Personnel Carrier (APC)
- 11.1.2. Infantry Fighting Vehicle (IFV)
- 11.1.3. Mine-resistant Ambush Protected (MRAP)
- 11.1.4. Main Battle Tank (MBT)
- 11.1.5. Other Vehicle Types
- 11.1. Market Analysis, Insights and Forecast - by Vehicle Type
- 12. United Arab Emirates Armored Vehicle Procurement and Upgrade Industry Analysis, Insights and Forecast, 2020-2032
- 12.1. Market Analysis, Insights and Forecast - by Vehicle Type
- 12.1.1. Armored Personnel Carrier (APC)
- 12.1.2. Infantry Fighting Vehicle (IFV)
- 12.1.3. Mine-resistant Ambush Protected (MRAP)
- 12.1.4. Main Battle Tank (MBT)
- 12.1.5. Other Vehicle Types
- 12.1. Market Analysis, Insights and Forecast - by Vehicle Type
- 13. Competitive Analysis
- 13.1. Company Profiles
- 13.1.1 Textron Inc
- 13.1.1.1. Company Overview
- 13.1.1.2. Products
- 13.1.1.3. Company Financials
- 13.1.1.4. SWOT Analysis
- 13.1.2 RUAG International Holding Ltd
- 13.1.2.1. Company Overview
- 13.1.2.2. Products
- 13.1.2.3. Company Financials
- 13.1.2.4. SWOT Analysis
- 13.1.3 FNSS Savunma Sistemleri A Ş
- 13.1.3.1. Company Overview
- 13.1.3.2. Products
- 13.1.3.3. Company Financials
- 13.1.3.4. SWOT Analysis
- 13.1.4 THALES
- 13.1.4.1. Company Overview
- 13.1.4.2. Products
- 13.1.4.3. Company Financials
- 13.1.4.4. SWOT Analysis
- 13.1.5 Oshkosh Corporation
- 13.1.5.1. Company Overview
- 13.1.5.2. Products
- 13.1.5.3. Company Financials
- 13.1.5.4. SWOT Analysis
- 13.1.6 General Dynamics Corporation
- 13.1.6.1. Company Overview
- 13.1.6.2. Products
- 13.1.6.3. Company Financials
- 13.1.6.4. SWOT Analysis
- 13.1.7 Rheinmetall AG
- 13.1.7.1. Company Overview
- 13.1.7.2. Products
- 13.1.7.3. Company Financials
- 13.1.7.4. SWOT Analysis
- 13.1.8 Elbit Systems Ltd
- 13.1.8.1. Company Overview
- 13.1.8.2. Products
- 13.1.8.3. Company Financials
- 13.1.8.4. SWOT Analysis
- 13.1.9 The CMI Group Inc
- 13.1.9.1. Company Overview
- 13.1.9.2. Products
- 13.1.9.3. Company Financials
- 13.1.9.4. SWOT Analysis
- 13.1.10 BMC Otomotiv Sanayi ve Ticaret A Ş
- 13.1.10.1. Company Overview
- 13.1.10.2. Products
- 13.1.10.3. Company Financials
- 13.1.10.4. SWOT Analysis
- 13.1.11 KNDS N V
- 13.1.11.1. Company Overview
- 13.1.11.2. Products
- 13.1.11.3. Company Financials
- 13.1.11.4. SWOT Analysis
- 13.1.12 Streit Grou
- 13.1.12.1. Company Overview
- 13.1.12.2. Products
- 13.1.12.3. Company Financials
- 13.1.12.4. SWOT Analysis
- 13.1.13 IVECO S p A
- 13.1.13.1. Company Overview
- 13.1.13.2. Products
- 13.1.13.3. Company Financials
- 13.1.13.4. SWOT Analysis
- 13.1.14 BAE Systems plc
- 13.1.14.1. Company Overview
- 13.1.14.2. Products
- 13.1.14.3. Company Financials
- 13.1.14.4. SWOT Analysis
- 13.1.1 Textron Inc
- 13.2. Market Entropy
- 13.2.1 Company's Key Areas Served
- 13.2.2 Recent Developments
- 13.3. Company Market Share Analysis 2025
- 13.3.1 Top 5 Companies Market Share Analysis
- 13.3.2 Top 3 Companies Market Share Analysis
- 13.4. List of Potential Customers
- 14. Research Methodology
List of Figures
- Figure 1: Global Armored Vehicle Procurement and Upgrade Industry Revenue Breakdown (Million, %) by Region 2025 & 2033
- Figure 2: North America Armored Vehicle Procurement and Upgrade Industry Revenue (Million), by Vehicle Type 2025 & 2033
- Figure 3: North America Armored Vehicle Procurement and Upgrade Industry Revenue Share (%), by Vehicle Type 2025 & 2033
- Figure 4: North America Armored Vehicle Procurement and Upgrade Industry Revenue (Million), by Country 2025 & 2033
- Figure 5: North America Armored Vehicle Procurement and Upgrade Industry Revenue Share (%), by Country 2025 & 2033
- Figure 6: Europe Armored Vehicle Procurement and Upgrade Industry Revenue (Million), by Vehicle Type 2025 & 2033
- Figure 7: Europe Armored Vehicle Procurement and Upgrade Industry Revenue Share (%), by Vehicle Type 2025 & 2033
- Figure 8: Europe Armored Vehicle Procurement and Upgrade Industry Revenue (Million), by Country 2025 & 2033
- Figure 9: Europe Armored Vehicle Procurement and Upgrade Industry Revenue Share (%), by Country 2025 & 2033
- Figure 10: Asia Pacific Armored Vehicle Procurement and Upgrade Industry Revenue (Million), by Vehicle Type 2025 & 2033
- Figure 11: Asia Pacific Armored Vehicle Procurement and Upgrade Industry Revenue Share (%), by Vehicle Type 2025 & 2033
- Figure 12: Asia Pacific Armored Vehicle Procurement and Upgrade Industry Revenue (Million), by Country 2025 & 2033
- Figure 13: Asia Pacific Armored Vehicle Procurement and Upgrade Industry Revenue Share (%), by Country 2025 & 2033
- Figure 14: Latin America Armored Vehicle Procurement and Upgrade Industry Revenue (Million), by Vehicle Type 2025 & 2033
- Figure 15: Latin America Armored Vehicle Procurement and Upgrade Industry Revenue Share (%), by Vehicle Type 2025 & 2033
- Figure 16: Latin America Armored Vehicle Procurement and Upgrade Industry Revenue (Million), by Country 2025 & 2033
- Figure 17: Latin America Armored Vehicle Procurement and Upgrade Industry Revenue Share (%), by Country 2025 & 2033
- Figure 18: Middle East Armored Vehicle Procurement and Upgrade Industry Revenue (Million), by Vehicle Type 2025 & 2033
- Figure 19: Middle East Armored Vehicle Procurement and Upgrade Industry Revenue Share (%), by Vehicle Type 2025 & 2033
- Figure 20: Middle East Armored Vehicle Procurement and Upgrade Industry Revenue (Million), by Country 2025 & 2033
- Figure 21: Middle East Armored Vehicle Procurement and Upgrade Industry Revenue Share (%), by Country 2025 & 2033
- Figure 22: United Arab Emirates Armored Vehicle Procurement and Upgrade Industry Revenue (Million), by Vehicle Type 2025 & 2033
- Figure 23: United Arab Emirates Armored Vehicle Procurement and Upgrade Industry Revenue Share (%), by Vehicle Type 2025 & 2033
- Figure 24: United Arab Emirates Armored Vehicle Procurement and Upgrade Industry Revenue (Million), by Country 2025 & 2033
- Figure 25: United Arab Emirates Armored Vehicle Procurement and Upgrade Industry Revenue Share (%), by Country 2025 & 2033
List of Tables
- Table 1: Global Armored Vehicle Procurement and Upgrade Industry Revenue Million Forecast, by Vehicle Type 2020 & 2033
- Table 2: Global Armored Vehicle Procurement and Upgrade Industry Revenue Million Forecast, by Region 2020 & 2033
- Table 3: Global Armored Vehicle Procurement and Upgrade Industry Revenue Million Forecast, by Vehicle Type 2020 & 2033
- Table 4: Global Armored Vehicle Procurement and Upgrade Industry Revenue Million Forecast, by Country 2020 & 2033
- Table 5: United States Armored Vehicle Procurement and Upgrade Industry Revenue (Million) Forecast, by Application 2020 & 2033
- Table 6: Canada Armored Vehicle Procurement and Upgrade Industry Revenue (Million) Forecast, by Application 2020 & 2033
- Table 7: Global Armored Vehicle Procurement and Upgrade Industry Revenue Million Forecast, by Vehicle Type 2020 & 2033
- Table 8: Global Armored Vehicle Procurement and Upgrade Industry Revenue Million Forecast, by Country 2020 & 2033
- Table 9: United Kingdom Armored Vehicle Procurement and Upgrade Industry Revenue (Million) Forecast, by Application 2020 & 2033
- Table 10: France Armored Vehicle Procurement and Upgrade Industry Revenue (Million) Forecast, by Application 2020 & 2033
- Table 11: Germany Armored Vehicle Procurement and Upgrade Industry Revenue (Million) Forecast, by Application 2020 & 2033
- Table 12: Russia Armored Vehicle Procurement and Upgrade Industry Revenue (Million) Forecast, by Application 2020 & 2033
- Table 13: Rest of Europe Armored Vehicle Procurement and Upgrade Industry Revenue (Million) Forecast, by Application 2020 & 2033
- Table 14: Global Armored Vehicle Procurement and Upgrade Industry Revenue Million Forecast, by Vehicle Type 2020 & 2033
- Table 15: Global Armored Vehicle Procurement and Upgrade Industry Revenue Million Forecast, by Country 2020 & 2033
- Table 16: China Armored Vehicle Procurement and Upgrade Industry Revenue (Million) Forecast, by Application 2020 & 2033
- Table 17: India Armored Vehicle Procurement and Upgrade Industry Revenue (Million) Forecast, by Application 2020 & 2033
- Table 18: Japan Armored Vehicle Procurement and Upgrade Industry Revenue (Million) Forecast, by Application 2020 & 2033
- Table 19: South Korea Armored Vehicle Procurement and Upgrade Industry Revenue (Million) Forecast, by Application 2020 & 2033
- Table 20: Australia Armored Vehicle Procurement and Upgrade Industry Revenue (Million) Forecast, by Application 2020 & 2033
- Table 21: Rest of Asia Pacific Armored Vehicle Procurement and Upgrade Industry Revenue (Million) Forecast, by Application 2020 & 2033
- Table 22: Global Armored Vehicle Procurement and Upgrade Industry Revenue Million Forecast, by Vehicle Type 2020 & 2033
- Table 23: Global Armored Vehicle Procurement and Upgrade Industry Revenue Million Forecast, by Country 2020 & 2033
- Table 24: Brazil Armored Vehicle Procurement and Upgrade Industry Revenue (Million) Forecast, by Application 2020 & 2033
- Table 25: Mexico Armored Vehicle Procurement and Upgrade Industry Revenue (Million) Forecast, by Application 2020 & 2033
- Table 26: Rest of Latin America Armored Vehicle Procurement and Upgrade Industry Revenue (Million) Forecast, by Application 2020 & 2033
- Table 27: Global Armored Vehicle Procurement and Upgrade Industry Revenue Million Forecast, by Vehicle Type 2020 & 2033
- Table 28: Global Armored Vehicle Procurement and Upgrade Industry Revenue Million Forecast, by Country 2020 & 2033
- Table 29: Global Armored Vehicle Procurement and Upgrade Industry Revenue Million Forecast, by Vehicle Type 2020 & 2033
- Table 30: Global Armored Vehicle Procurement and Upgrade Industry Revenue Million Forecast, by Country 2020 & 2033
- Table 31: Saudi Arabia Armored Vehicle Procurement and Upgrade Industry Revenue (Million) Forecast, by Application 2020 & 2033
- Table 32: Turkey Armored Vehicle Procurement and Upgrade Industry Revenue (Million) Forecast, by Application 2020 & 2033
- Table 33: South Africa Armored Vehicle Procurement and Upgrade Industry Revenue (Million) Forecast, by Application 2020 & 2033
- Table 34: Rest of Middle East and Africa Armored Vehicle Procurement and Upgrade Industry Revenue (Million) Forecast, by Application 2020 & 2033
Frequently Asked Questions
1. What is the projected Compound Annual Growth Rate (CAGR) of the Armored Vehicle Procurement and Upgrade Industry?
The projected CAGR is approximately 4.23%.
2. Which companies are prominent players in the Armored Vehicle Procurement and Upgrade Industry?
Key companies in the market include Textron Inc, RUAG International Holding Ltd, FNSS Savunma Sistemleri A Ş, THALES, Oshkosh Corporation, General Dynamics Corporation, Rheinmetall AG, Elbit Systems Ltd, The CMI Group Inc, BMC Otomotiv Sanayi ve Ticaret A Ş, KNDS N V, Streit Grou, IVECO S p A, BAE Systems plc.
3. What are the main segments of the Armored Vehicle Procurement and Upgrade Industry?
The market segments include Vehicle Type.
4. Can you provide details about the market size?
The market size is estimated to be USD 6.66 Million as of 2022.
5. What are some drivers contributing to market growth?
N/A
6. What are the notable trends driving market growth?
The Infantry Fighting Vehicle Segment to Dominate Market Share.
7. Are there any restraints impacting market growth?
N/A
8. Can you provide examples of recent developments in the market?
May 2023: Elbit Systems Ltd. was awarded a contract under the British Army's Project Vulcan to maintain and operate the Ground Manoeuvre Synthetic Trainer system (GMST), the Boxer armored vehicles, and Challenger 3 tanks. The contract includes a training management system with high-fidelity driver trainers and cabins for turret and armament variants.
9. What pricing options are available for accessing the report?
Pricing options include single-user, multi-user, and enterprise licenses priced at USD 4750, USD 5250, and USD 8750 respectively.
10. Is the market size provided in terms of value or volume?
The market size is provided in terms of value, measured in Million.
11. Are there any specific market keywords associated with the report?
Yes, the market keyword associated with the report is "Armored Vehicle Procurement and Upgrade Industry," which aids in identifying and referencing the specific market segment covered.
12. How do I determine which pricing option suits my needs best?
The pricing options vary based on user requirements and access needs. Individual users may opt for single-user licenses, while businesses requiring broader access may choose multi-user or enterprise licenses for cost-effective access to the report.
13. Are there any additional resources or data provided in the Armored Vehicle Procurement and Upgrade Industry report?
While the report offers comprehensive insights, it's advisable to review the specific contents or supplementary materials provided to ascertain if additional resources or data are available.
14. How can I stay updated on further developments or reports in the Armored Vehicle Procurement and Upgrade Industry?
To stay informed about further developments, trends, and reports in the Armored Vehicle Procurement and Upgrade Industry, consider subscribing to industry newsletters, following relevant companies and organizations, or regularly checking reputable industry news sources and publications.
Methodology
Step 1 - Identification of Relevant Samples Size from Population Database


Step 2 - Approaches for Defining Global Market Size (Value, Volume* & Price*)

Note*: In applicable scenarios
Step 3 - Data Sources
Primary Research
- Web Analytics
- Survey Reports
- Research Institute
- Latest Research Reports
- Opinion Leaders
Secondary Research
- Annual Reports
- White Paper
- Latest Press Release
- Industry Association
- Paid Database
- Investor Presentations

Step 4 - Data Triangulation
Involves using different sources of information in order to increase the validity of a study
These sources are likely to be stakeholders in a program - participants, other researchers, program staff, other community members, and so on.
Then we put all data in single framework & apply various statistical tools to find out the dynamic on the market.
During the analysis stage, feedback from the stakeholder groups would be compared to determine areas of agreement as well as areas of divergence