

Key Insights
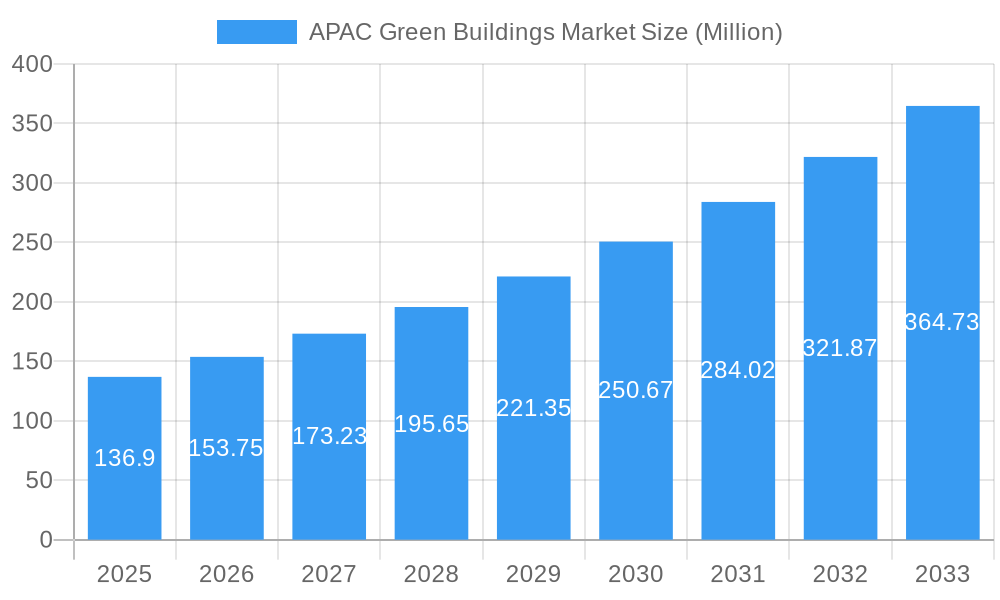
The APAC green building market is experiencing robust growth, projected to reach $136.90 million in 2025 and maintain a Compound Annual Growth Rate (CAGR) of 12.23% from 2025 to 2033. This expansion is driven by several key factors. Increasing government regulations promoting sustainable construction practices across countries like China, Japan, India, and Australia are creating significant demand. Furthermore, growing environmental awareness among consumers and businesses is fueling the adoption of green building technologies, leading to higher construction costs but long-term cost savings in energy consumption and maintenance. The rise of smart building technologies, incorporating energy-efficient systems and renewable energy sources like solar power (as indicated by the "Other Products" segment), also contributes significantly to market growth. Strong economic growth in several APAC nations further underpins this expansion, supporting significant investment in large-scale infrastructure projects which often incorporate green building principles. The market is segmented by product type (exterior, interior, and building systems/solar) and end-user (residential, office, retail, institutional), with residential and office segments likely dominating due to higher construction volume. Major players like Keppel Land, CapitaLand, and Shimizu Corporation are leading the charge, shaping market trends and technology advancements. Competitive intensity is high, with ongoing innovation and mergers & acquisitions anticipated.
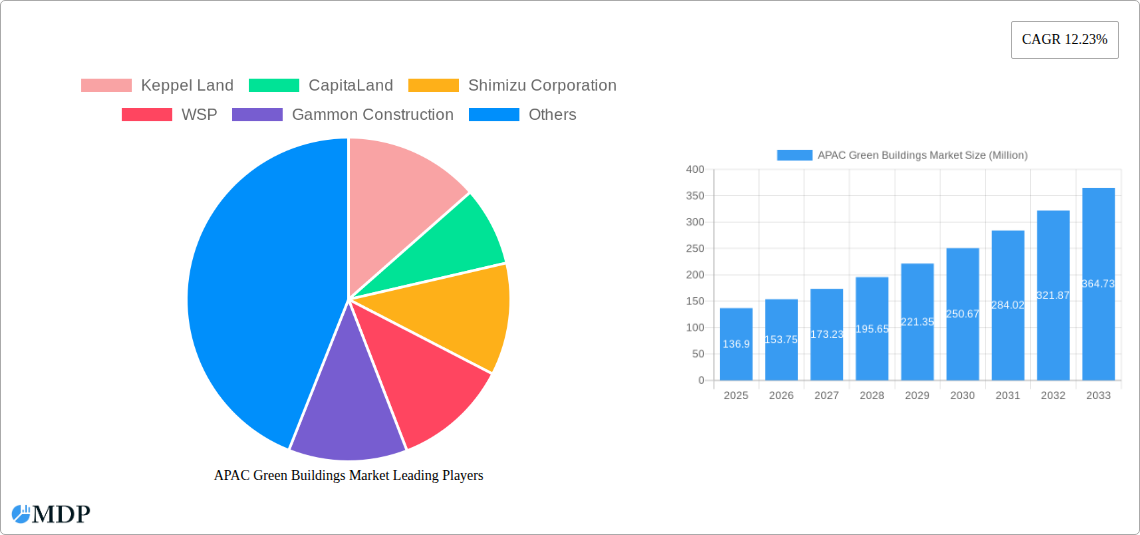
APAC Green Buildings Market Market Size (In Million)
The market's growth trajectory is expected to be influenced by several factors. Continued technological advancements in green building materials and sustainable construction techniques will further drive adoption. However, challenges remain, including high initial investment costs associated with green building construction and a potential skills gap in the workforce concerning green building expertise. Despite these challenges, the long-term benefits of reduced carbon footprint, energy savings, and improved occupant well-being will likely outweigh the initial costs, contributing to sustained market expansion throughout the forecast period. Regional variations in growth will likely reflect differing regulatory landscapes and economic development across the APAC region, with China, Japan, and India expected to contribute the most significant market share due to their large populations and ongoing infrastructure development.
APAC Green Buildings Market Company Market Share
APAC Green Buildings Market Report: 2019-2033 Forecast
This comprehensive report provides an in-depth analysis of the Asia-Pacific (APAC) green buildings market, offering valuable insights for investors, industry stakeholders, and businesses seeking to capitalize on this rapidly expanding sector. With a study period spanning 2019-2033, a base year of 2025, and a forecast period of 2025-2033, this report delivers a robust understanding of historical trends, current dynamics, and future projections for this vital market. The market size is projected to reach xx Million by 2033, exhibiting a CAGR of xx% during the forecast period.
APAC Green Buildings Market Market Dynamics & Concentration
The APAC green building market is characterized by increasing market concentration, driven by the expansion of major players and strategic mergers and acquisitions (M&A). The market share of the top five players accounts for approximately xx%, indicating a moderately consolidated landscape. However, numerous smaller players contribute significantly to market innovation and specialized product offerings. Innovation is fueled by stringent government regulations, increasing consumer demand for sustainable solutions, and technological advancements in building materials and energy efficiency technologies. Several countries in the region have implemented ambitious green building codes and incentives, pushing the market toward greater adoption of sustainable practices. While traditional building materials face substitution pressures from eco-friendly alternatives, the overall market displays strong resilience driven by supportive government policies and growing awareness of environmental sustainability. M&A activity in the sector has been relatively robust in recent years, with approximately xx deals recorded between 2019 and 2024. This consolidation is expected to continue, shaping the competitive dynamics of the market in the coming years.
- Market Concentration: Top 5 players hold approximately xx% market share.
- M&A Activity: Approximately xx deals recorded between 2019-2024.
- Regulatory Frameworks: Stringent green building codes and incentives driving adoption.
- Innovation Drivers: Consumer demand, technological advancements, and government policies.
APAC Green Buildings Market Industry Trends & Analysis
The APAC green building market is experiencing robust growth, fueled by several key trends. Strong economic growth in many APAC countries has led to increased construction activity, creating a substantial demand for sustainable building solutions. Rapid urbanization and population growth are further exacerbating the need for environmentally friendly and energy-efficient buildings. Growing consumer awareness of environmental issues and a preference for sustainable lifestyles are driving demand for green buildings among both residential and commercial consumers. Technological advancements, such as the development of innovative building materials, energy-efficient systems, and smart building technologies, are constantly improving the efficiency and performance of green buildings. The competitive landscape is dynamic, with established players and new entrants vying for market share. This competition fosters innovation and drives down costs, making green building solutions more accessible to a wider range of customers. Market penetration of green building technologies is steadily increasing, with a notable rise in the adoption of energy-efficient lighting, solar panels, and green building certification programs. The market is expected to achieve xx% market penetration by 2033.
Leading Markets & Segments in APAC Green Buildings Market
The APAC green building market is segmented by product type (exterior products, interior products, other products) and end-user (residential, office, retail, institutional, other). While market data varies across the region, several key trends are observable. China and India, driven by rapid economic growth and large-scale infrastructure projects, are currently the leading markets in the region. However, other countries, such as Singapore, Australia, and Japan, are also showing significant growth, particularly in the commercial and institutional sectors. The residential segment is currently the largest end-user segment, driven by rising household incomes and growing awareness of environmental sustainability. The exterior products segment, encompassing materials like sustainable facades and roofing systems, holds the largest share of the product market.
- Key Drivers for Dominant Regions/Segments:
- China & India: Rapid economic growth, large-scale construction projects, and supportive government policies.
- Singapore, Australia, Japan: High levels of environmental awareness and advanced building technologies.
- Residential Segment: Rising household incomes and growing environmental awareness.
- Exterior Products Segment: Demand for sustainable and durable building materials.
APAC Green Buildings Market Product Developments
Recent product developments focus on improving the energy efficiency, durability, and sustainability of green building materials. Innovations include self-healing concrete, bio-based building materials, and advanced insulation technologies. These advancements are enhancing the performance, cost-effectiveness, and environmental footprint of green buildings. Competition among manufacturers is intensifying, driving further innovations in terms of cost reduction and performance enhancement, thereby making these solutions more accessible to a larger market.
Key Drivers of APAC Green Buildings Market Growth
The growth of the APAC green buildings market is driven by a confluence of factors. Stringent government regulations promoting energy efficiency and sustainability are significantly influencing adoption. Economic incentives, such as tax breaks and subsidies, are making green building projects more financially attractive. Technological advancements in building materials and energy-efficient technologies are continuously improving the performance and affordability of green building solutions. Growing environmental awareness among consumers and businesses is driving demand for sustainable building options. The increasing need to reduce carbon emissions and mitigate climate change is also a significant driving force.
Challenges in the APAC Green Buildings Market
Despite the considerable growth potential, the APAC green building market faces several challenges. High initial costs associated with green building construction can be a barrier for some developers. Supply chain disruptions can impact the availability of sustainable building materials. A lack of skilled labor and expertise in green building technologies can hinder project implementation. Inconsistencies in green building standards and certifications across different countries can create complexities for developers and investors. These challenges, however, are being addressed through ongoing technological innovations, capacity building initiatives, and policy adjustments.
Emerging Opportunities in APAC Green Buildings Market
The APAC green buildings market presents numerous opportunities for future growth. Technological breakthroughs, such as advanced energy storage systems and smart building technologies, are creating new avenues for innovation. Strategic partnerships between developers, technology providers, and financial institutions are facilitating the adoption of green building technologies. Expansion into emerging markets within the APAC region, particularly in Southeast Asia, holds significant potential. Growing government support for green building initiatives is creating a conducive environment for investment and growth. The adoption of innovative financing mechanisms, such as green bonds, is also expected to unlock further investment in the sector.
Leading Players in the APAC Green Buildings Market Sector
- Keppel Land
- CapitaLand
- Shimizu Corporation
- WSP
- Gammon Construction
- Obayashi Corporation
- Sun Hung Kai Properties
- 7-3 Other Companies
- Lendlease
- Swire Properties
- Sino Group
Key Milestones in APAC Green Buildings Market Industry
- April 2023: Starbucks unveils its first greener stores in Asia-Pacific, demonstrating growing corporate commitment to sustainability and driving demand for green building solutions.
- February 2023: GHD partners with the GBCA, signaling increased industry collaboration and support for circular economy principles within the green building sector.
Strategic Outlook for APAC Green Buildings Market
The APAC green buildings market is poised for significant growth in the coming years, driven by increasing environmental awareness, supportive government policies, and technological advancements. Strategic opportunities exist in developing innovative building materials, enhancing energy efficiency technologies, and expanding into emerging markets. Companies focused on sustainability and innovation are well-positioned to capitalize on the significant market potential. The market's long-term outlook remains positive, with consistent growth anticipated throughout the forecast period.
APAC Green Buildings Market Segmentation
-
1. Product
- 1.1. Exterior Products
- 1.2. Interior products
- 1.3. Other Pr
-
2. End User
- 2.1. Residential
- 2.2. Office
- 2.3. Retail
- 2.4. Institutional
- 2.5. Other End Users
-
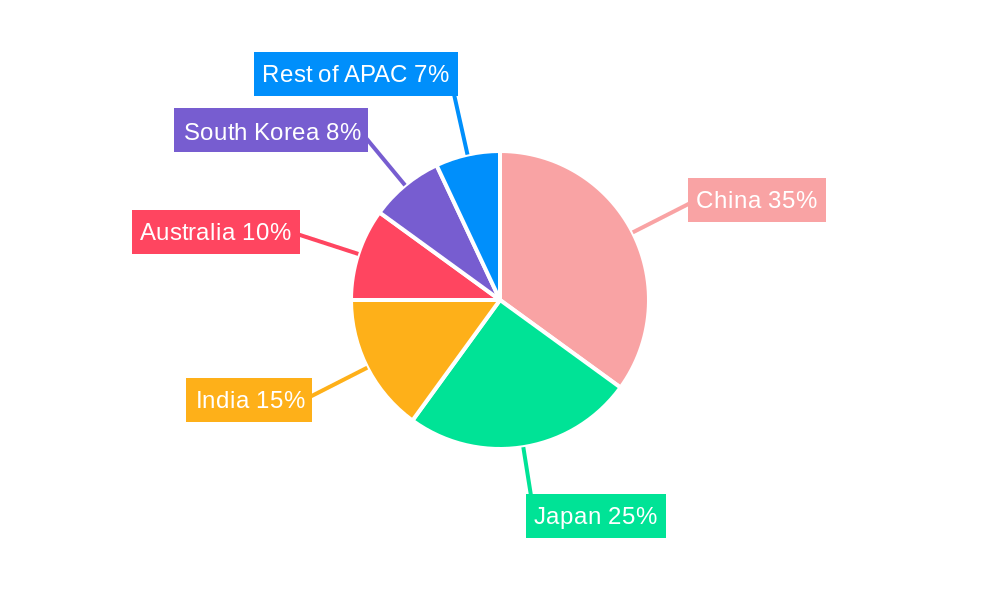
3. Geography
- 3.1. China
- 3.2. Japan
- 3.3. India
- 3.4. Australia
- 3.5. South Korea
- 3.6. Rest of APAC
APAC Green Buildings Market Segmentation By Geography
- 1. China
- 2. Japan
- 3. India
- 4. Australia
- 5. South Korea
- 6. Rest of APAC
APAC Green Buildings Market Regional Market Share
Geographic Coverage of APAC Green Buildings Market
APAC Green Buildings Market REPORT HIGHLIGHTS
| Aspects | Details |
|---|---|
| Study Period | 2020-2034 |
| Base Year | 2025 |
| Estimated Year | 2026 |
| Forecast Period | 2026-2034 |
| Historical Period | 2020-2025 |
| Growth Rate | CAGR of 12.23% from 2020-2034 |
| Segmentation |
|
Table of Contents
- 1. Introduction
- 1.1. Research Scope
- 1.2. Market Segmentation
- 1.3. Research Objective
- 1.4. Definitions and Assumptions
- 2. Executive Summary
- 2.1. Market Snapshot
- 3. Market Dynamics
- 3.1. Market Drivers
- 3.2. Market Restrains
- 3.3. Market Trends
- 3.4. Market Opportunities
- 4. Market Factor Analysis
- 4.1. Porters Five Forces
- 4.1.1. Bargaining Power of Suppliers
- 4.1.2. Bargaining Power of Buyers
- 4.1.3. Threat of New Entrants
- 4.1.4. Threat of Substitutes
- 4.1.5. Competitive Rivalry
- 4.2. PESTEL analysis
- 4.3. BCG Analysis
- 4.3.1. Stars (High Growth, High Market Share)
- 4.3.2. Cash Cows (Low Growth, High Market Share)
- 4.3.3. Question Mark (High Growth, Low Market Share)
- 4.3.4. Dogs (Low Growth, Low Market Share)
- 4.4. Ansoff Matrix Analysis
- 4.5. Supply Chain Analysis
- 4.6. Regulatory Landscape
- 4.7. Current Market Potential and Opportunity Assessment (TAM–SAM–SOM Framework)
- 4.8. MDP Analyst Note
- 4.1. Porters Five Forces
- 5. Market Analysis, Insights and Forecast 2021-2033
- 5.1. Market Analysis, Insights and Forecast - by Product
- 5.1.1. Exterior Products
- 5.1.2. Interior products
- 5.1.3. Other Pr
- 5.2. Market Analysis, Insights and Forecast - by End User
- 5.2.1. Residential
- 5.2.2. Office
- 5.2.3. Retail
- 5.2.4. Institutional
- 5.2.5. Other End Users
- 5.3. Market Analysis, Insights and Forecast - by Geography
- 5.3.1. China
- 5.3.2. Japan
- 5.3.3. India
- 5.3.4. Australia
- 5.3.5. South Korea
- 5.3.6. Rest of APAC
- 5.4. Market Analysis, Insights and Forecast - by Region
- 5.4.1. China
- 5.4.2. Japan
- 5.4.3. India
- 5.4.4. Australia
- 5.4.5. South Korea
- 5.4.6. Rest of APAC
- 5.1. Market Analysis, Insights and Forecast - by Product
- 6. Global APAC Green Buildings Market Analysis, Insights and Forecast, 2021-2033
- 6.1. Market Analysis, Insights and Forecast - by Product
- 6.1.1. Exterior Products
- 6.1.2. Interior products
- 6.1.3. Other Pr
- 6.2. Market Analysis, Insights and Forecast - by End User
- 6.2.1. Residential
- 6.2.2. Office
- 6.2.3. Retail
- 6.2.4. Institutional
- 6.2.5. Other End Users
- 6.3. Market Analysis, Insights and Forecast - by Geography
- 6.3.1. China
- 6.3.2. Japan
- 6.3.3. India
- 6.3.4. Australia
- 6.3.5. South Korea
- 6.3.6. Rest of APAC
- 6.1. Market Analysis, Insights and Forecast - by Product
- 7. China APAC Green Buildings Market Analysis, Insights and Forecast, 2020-2032
- 7.1. Market Analysis, Insights and Forecast - by Product
- 7.1.1. Exterior Products
- 7.1.2. Interior products
- 7.1.3. Other Pr
- 7.2. Market Analysis, Insights and Forecast - by End User
- 7.2.1. Residential
- 7.2.2. Office
- 7.2.3. Retail
- 7.2.4. Institutional
- 7.2.5. Other End Users
- 7.3. Market Analysis, Insights and Forecast - by Geography
- 7.3.1. China
- 7.3.2. Japan
- 7.3.3. India
- 7.3.4. Australia
- 7.3.5. South Korea
- 7.3.6. Rest of APAC
- 7.1. Market Analysis, Insights and Forecast - by Product
- 8. Japan APAC Green Buildings Market Analysis, Insights and Forecast, 2020-2032
- 8.1. Market Analysis, Insights and Forecast - by Product
- 8.1.1. Exterior Products
- 8.1.2. Interior products
- 8.1.3. Other Pr
- 8.2. Market Analysis, Insights and Forecast - by End User
- 8.2.1. Residential
- 8.2.2. Office
- 8.2.3. Retail
- 8.2.4. Institutional
- 8.2.5. Other End Users
- 8.3. Market Analysis, Insights and Forecast - by Geography
- 8.3.1. China
- 8.3.2. Japan
- 8.3.3. India
- 8.3.4. Australia
- 8.3.5. South Korea
- 8.3.6. Rest of APAC
- 8.1. Market Analysis, Insights and Forecast - by Product
- 9. India APAC Green Buildings Market Analysis, Insights and Forecast, 2020-2032
- 9.1. Market Analysis, Insights and Forecast - by Product
- 9.1.1. Exterior Products
- 9.1.2. Interior products
- 9.1.3. Other Pr
- 9.2. Market Analysis, Insights and Forecast - by End User
- 9.2.1. Residential
- 9.2.2. Office
- 9.2.3. Retail
- 9.2.4. Institutional
- 9.2.5. Other End Users
- 9.3. Market Analysis, Insights and Forecast - by Geography
- 9.3.1. China
- 9.3.2. Japan
- 9.3.3. India
- 9.3.4. Australia
- 9.3.5. South Korea
- 9.3.6. Rest of APAC
- 9.1. Market Analysis, Insights and Forecast - by Product
- 10. Australia APAC Green Buildings Market Analysis, Insights and Forecast, 2020-2032
- 10.1. Market Analysis, Insights and Forecast - by Product
- 10.1.1. Exterior Products
- 10.1.2. Interior products
- 10.1.3. Other Pr
- 10.2. Market Analysis, Insights and Forecast - by End User
- 10.2.1. Residential
- 10.2.2. Office
- 10.2.3. Retail
- 10.2.4. Institutional
- 10.2.5. Other End Users
- 10.3. Market Analysis, Insights and Forecast - by Geography
- 10.3.1. China
- 10.3.2. Japan
- 10.3.3. India
- 10.3.4. Australia
- 10.3.5. South Korea
- 10.3.6. Rest of APAC
- 10.1. Market Analysis, Insights and Forecast - by Product
- 11. South Korea APAC Green Buildings Market Analysis, Insights and Forecast, 2020-2032
- 11.1. Market Analysis, Insights and Forecast - by Product
- 11.1.1. Exterior Products
- 11.1.2. Interior products
- 11.1.3. Other Pr
- 11.2. Market Analysis, Insights and Forecast - by End User
- 11.2.1. Residential
- 11.2.2. Office
- 11.2.3. Retail
- 11.2.4. Institutional
- 11.2.5. Other End Users
- 11.3. Market Analysis, Insights and Forecast - by Geography
- 11.3.1. China
- 11.3.2. Japan
- 11.3.3. India
- 11.3.4. Australia
- 11.3.5. South Korea
- 11.3.6. Rest of APAC
- 11.1. Market Analysis, Insights and Forecast - by Product
- 12. Rest of APAC APAC Green Buildings Market Analysis, Insights and Forecast, 2020-2032
- 12.1. Market Analysis, Insights and Forecast - by Product
- 12.1.1. Exterior Products
- 12.1.2. Interior products
- 12.1.3. Other Pr
- 12.2. Market Analysis, Insights and Forecast - by End User
- 12.2.1. Residential
- 12.2.2. Office
- 12.2.3. Retail
- 12.2.4. Institutional
- 12.2.5. Other End Users
- 12.3. Market Analysis, Insights and Forecast - by Geography
- 12.3.1. China
- 12.3.2. Japan
- 12.3.3. India
- 12.3.4. Australia
- 12.3.5. South Korea
- 12.3.6. Rest of APAC
- 12.1. Market Analysis, Insights and Forecast - by Product
- 13. Competitive Analysis
- 13.1. Company Profiles
- 13.1.1 Keppel Land
- 13.1.1.1. Company Overview
- 13.1.1.2. Products
- 13.1.1.3. Company Financials
- 13.1.1.4. SWOT Analysis
- 13.1.2 CapitaLand
- 13.1.2.1. Company Overview
- 13.1.2.2. Products
- 13.1.2.3. Company Financials
- 13.1.2.4. SWOT Analysis
- 13.1.3 Shimizu Corporation
- 13.1.3.1. Company Overview
- 13.1.3.2. Products
- 13.1.3.3. Company Financials
- 13.1.3.4. SWOT Analysis
- 13.1.4 WSP
- 13.1.4.1. Company Overview
- 13.1.4.2. Products
- 13.1.4.3. Company Financials
- 13.1.4.4. SWOT Analysis
- 13.1.5 Gammon Construction
- 13.1.5.1. Company Overview
- 13.1.5.2. Products
- 13.1.5.3. Company Financials
- 13.1.5.4. SWOT Analysis
- 13.1.6 Obayashi Corporation
- 13.1.6.1. Company Overview
- 13.1.6.2. Products
- 13.1.6.3. Company Financials
- 13.1.6.4. SWOT Analysis
- 13.1.7 Sun Hung Kai Properties**List Not Exhaustive 7 3 Other Companie
- 13.1.7.1. Company Overview
- 13.1.7.2. Products
- 13.1.7.3. Company Financials
- 13.1.7.4. SWOT Analysis
- 13.1.8 Lendlease
- 13.1.8.1. Company Overview
- 13.1.8.2. Products
- 13.1.8.3. Company Financials
- 13.1.8.4. SWOT Analysis
- 13.1.9 Swire Properties
- 13.1.9.1. Company Overview
- 13.1.9.2. Products
- 13.1.9.3. Company Financials
- 13.1.9.4. SWOT Analysis
- 13.1.10 Sino Group
- 13.1.10.1. Company Overview
- 13.1.10.2. Products
- 13.1.10.3. Company Financials
- 13.1.10.4. SWOT Analysis
- 13.1.1 Keppel Land
- 13.2. Market Entropy
- 13.2.1 Company's Key Areas Served
- 13.2.2 Recent Developments
- 13.3. Company Market Share Analysis 2025
- 13.3.1 Top 5 Companies Market Share Analysis
- 13.3.2 Top 3 Companies Market Share Analysis
- 13.4. List of Potential Customers
- 14. Research Methodology
List of Figures
- Figure 1: Global APAC Green Buildings Market Revenue Breakdown (Million, %) by Region 2025 & 2033
- Figure 2: China APAC Green Buildings Market Revenue (Million), by Product 2025 & 2033
- Figure 3: China APAC Green Buildings Market Revenue Share (%), by Product 2025 & 2033
- Figure 4: China APAC Green Buildings Market Revenue (Million), by End User 2025 & 2033
- Figure 5: China APAC Green Buildings Market Revenue Share (%), by End User 2025 & 2033
- Figure 6: China APAC Green Buildings Market Revenue (Million), by Geography 2025 & 2033
- Figure 7: China APAC Green Buildings Market Revenue Share (%), by Geography 2025 & 2033
- Figure 8: China APAC Green Buildings Market Revenue (Million), by Country 2025 & 2033
- Figure 9: China APAC Green Buildings Market Revenue Share (%), by Country 2025 & 2033
- Figure 10: Japan APAC Green Buildings Market Revenue (Million), by Product 2025 & 2033
- Figure 11: Japan APAC Green Buildings Market Revenue Share (%), by Product 2025 & 2033
- Figure 12: Japan APAC Green Buildings Market Revenue (Million), by End User 2025 & 2033
- Figure 13: Japan APAC Green Buildings Market Revenue Share (%), by End User 2025 & 2033
- Figure 14: Japan APAC Green Buildings Market Revenue (Million), by Geography 2025 & 2033
- Figure 15: Japan APAC Green Buildings Market Revenue Share (%), by Geography 2025 & 2033
- Figure 16: Japan APAC Green Buildings Market Revenue (Million), by Country 2025 & 2033
- Figure 17: Japan APAC Green Buildings Market Revenue Share (%), by Country 2025 & 2033
- Figure 18: India APAC Green Buildings Market Revenue (Million), by Product 2025 & 2033
- Figure 19: India APAC Green Buildings Market Revenue Share (%), by Product 2025 & 2033
- Figure 20: India APAC Green Buildings Market Revenue (Million), by End User 2025 & 2033
- Figure 21: India APAC Green Buildings Market Revenue Share (%), by End User 2025 & 2033
- Figure 22: India APAC Green Buildings Market Revenue (Million), by Geography 2025 & 2033
- Figure 23: India APAC Green Buildings Market Revenue Share (%), by Geography 2025 & 2033
- Figure 24: India APAC Green Buildings Market Revenue (Million), by Country 2025 & 2033
- Figure 25: India APAC Green Buildings Market Revenue Share (%), by Country 2025 & 2033
- Figure 26: Australia APAC Green Buildings Market Revenue (Million), by Product 2025 & 2033
- Figure 27: Australia APAC Green Buildings Market Revenue Share (%), by Product 2025 & 2033
- Figure 28: Australia APAC Green Buildings Market Revenue (Million), by End User 2025 & 2033
- Figure 29: Australia APAC Green Buildings Market Revenue Share (%), by End User 2025 & 2033
- Figure 30: Australia APAC Green Buildings Market Revenue (Million), by Geography 2025 & 2033
- Figure 31: Australia APAC Green Buildings Market Revenue Share (%), by Geography 2025 & 2033
- Figure 32: Australia APAC Green Buildings Market Revenue (Million), by Country 2025 & 2033
- Figure 33: Australia APAC Green Buildings Market Revenue Share (%), by Country 2025 & 2033
- Figure 34: South Korea APAC Green Buildings Market Revenue (Million), by Product 2025 & 2033
- Figure 35: South Korea APAC Green Buildings Market Revenue Share (%), by Product 2025 & 2033
- Figure 36: South Korea APAC Green Buildings Market Revenue (Million), by End User 2025 & 2033
- Figure 37: South Korea APAC Green Buildings Market Revenue Share (%), by End User 2025 & 2033
- Figure 38: South Korea APAC Green Buildings Market Revenue (Million), by Geography 2025 & 2033
- Figure 39: South Korea APAC Green Buildings Market Revenue Share (%), by Geography 2025 & 2033
- Figure 40: South Korea APAC Green Buildings Market Revenue (Million), by Country 2025 & 2033
- Figure 41: South Korea APAC Green Buildings Market Revenue Share (%), by Country 2025 & 2033
- Figure 42: Rest of APAC APAC Green Buildings Market Revenue (Million), by Product 2025 & 2033
- Figure 43: Rest of APAC APAC Green Buildings Market Revenue Share (%), by Product 2025 & 2033
- Figure 44: Rest of APAC APAC Green Buildings Market Revenue (Million), by End User 2025 & 2033
- Figure 45: Rest of APAC APAC Green Buildings Market Revenue Share (%), by End User 2025 & 2033
- Figure 46: Rest of APAC APAC Green Buildings Market Revenue (Million), by Geography 2025 & 2033
- Figure 47: Rest of APAC APAC Green Buildings Market Revenue Share (%), by Geography 2025 & 2033
- Figure 48: Rest of APAC APAC Green Buildings Market Revenue (Million), by Country 2025 & 2033
- Figure 49: Rest of APAC APAC Green Buildings Market Revenue Share (%), by Country 2025 & 2033
List of Tables
- Table 1: Global APAC Green Buildings Market Revenue Million Forecast, by Product 2020 & 2033
- Table 2: Global APAC Green Buildings Market Revenue Million Forecast, by End User 2020 & 2033
- Table 3: Global APAC Green Buildings Market Revenue Million Forecast, by Geography 2020 & 2033
- Table 4: Global APAC Green Buildings Market Revenue Million Forecast, by Region 2020 & 2033
- Table 5: Global APAC Green Buildings Market Revenue Million Forecast, by Product 2020 & 2033
- Table 6: Global APAC Green Buildings Market Revenue Million Forecast, by End User 2020 & 2033
- Table 7: Global APAC Green Buildings Market Revenue Million Forecast, by Geography 2020 & 2033
- Table 8: Global APAC Green Buildings Market Revenue Million Forecast, by Country 2020 & 2033
- Table 9: Global APAC Green Buildings Market Revenue Million Forecast, by Product 2020 & 2033
- Table 10: Global APAC Green Buildings Market Revenue Million Forecast, by End User 2020 & 2033
- Table 11: Global APAC Green Buildings Market Revenue Million Forecast, by Geography 2020 & 2033
- Table 12: Global APAC Green Buildings Market Revenue Million Forecast, by Country 2020 & 2033
- Table 13: Global APAC Green Buildings Market Revenue Million Forecast, by Product 2020 & 2033
- Table 14: Global APAC Green Buildings Market Revenue Million Forecast, by End User 2020 & 2033
- Table 15: Global APAC Green Buildings Market Revenue Million Forecast, by Geography 2020 & 2033
- Table 16: Global APAC Green Buildings Market Revenue Million Forecast, by Country 2020 & 2033
- Table 17: Global APAC Green Buildings Market Revenue Million Forecast, by Product 2020 & 2033
- Table 18: Global APAC Green Buildings Market Revenue Million Forecast, by End User 2020 & 2033
- Table 19: Global APAC Green Buildings Market Revenue Million Forecast, by Geography 2020 & 2033
- Table 20: Global APAC Green Buildings Market Revenue Million Forecast, by Country 2020 & 2033
- Table 21: Global APAC Green Buildings Market Revenue Million Forecast, by Product 2020 & 2033
- Table 22: Global APAC Green Buildings Market Revenue Million Forecast, by End User 2020 & 2033
- Table 23: Global APAC Green Buildings Market Revenue Million Forecast, by Geography 2020 & 2033
- Table 24: Global APAC Green Buildings Market Revenue Million Forecast, by Country 2020 & 2033
- Table 25: Global APAC Green Buildings Market Revenue Million Forecast, by Product 2020 & 2033
- Table 26: Global APAC Green Buildings Market Revenue Million Forecast, by End User 2020 & 2033
- Table 27: Global APAC Green Buildings Market Revenue Million Forecast, by Geography 2020 & 2033
- Table 28: Global APAC Green Buildings Market Revenue Million Forecast, by Country 2020 & 2033
Frequently Asked Questions
1. What is the projected Compound Annual Growth Rate (CAGR) of the APAC Green Buildings Market?
The projected CAGR is approximately 12.23%.
2. Which companies are prominent players in the APAC Green Buildings Market?
Key companies in the market include Keppel Land, CapitaLand, Shimizu Corporation, WSP, Gammon Construction, Obayashi Corporation, Sun Hung Kai Properties**List Not Exhaustive 7 3 Other Companie, Lendlease, Swire Properties, Sino Group.
3. What are the main segments of the APAC Green Buildings Market?
The market segments include Product, End User, Geography.
4. Can you provide details about the market size?
The market size is estimated to be USD 136.90 Million as of 2022.
5. What are some drivers contributing to market growth?
Energy Efficiency in Construction Driving the Market; Flexibility and Customization Options Driving the Market.
6. What are the notable trends driving market growth?
The Commercial Segment’s Increasing Demand for Green Buildings.
7. Are there any restraints impacting market growth?
Limited Availability of Suitable Land for Construction Hindering the Market; Lower Quality Compared to Traditional Construction.
8. Can you provide examples of recent developments in the market?
April 2023: The world’s largest coffee company, Starbucks, has unveiled its first greener stores in Asia-Pacific as a part of a global rollout of its greener store framework that has grown to more than 3,500 locations across 20 markets. The five new greener stores, located in Singapore (Singapore), Thailand (Thailand), and Vietnam (Vietnam), are among the first in Starbucks Asia-Pacific region. More than 20 other Starbucks stores are expected to receive greener store certifications later this year. With this latest round of certifications, Starbucks is well on track to reaching its goal of having 10,000 greener stores worldwide by 2025.
9. What pricing options are available for accessing the report?
Pricing options include single-user, multi-user, and enterprise licenses priced at USD 4750, USD 5250, and USD 8750 respectively.
10. Is the market size provided in terms of value or volume?
The market size is provided in terms of value, measured in Million.
11. Are there any specific market keywords associated with the report?
Yes, the market keyword associated with the report is "APAC Green Buildings Market," which aids in identifying and referencing the specific market segment covered.
12. How do I determine which pricing option suits my needs best?
The pricing options vary based on user requirements and access needs. Individual users may opt for single-user licenses, while businesses requiring broader access may choose multi-user or enterprise licenses for cost-effective access to the report.
13. Are there any additional resources or data provided in the APAC Green Buildings Market report?
While the report offers comprehensive insights, it's advisable to review the specific contents or supplementary materials provided to ascertain if additional resources or data are available.
14. How can I stay updated on further developments or reports in the APAC Green Buildings Market?
To stay informed about further developments, trends, and reports in the APAC Green Buildings Market, consider subscribing to industry newsletters, following relevant companies and organizations, or regularly checking reputable industry news sources and publications.
Methodology
Step 1 - Identification of Relevant Samples Size from Population Database


Step 2 - Approaches for Defining Global Market Size (Value, Volume* & Price*)

Note*: In applicable scenarios
Step 3 - Data Sources
Primary Research
- Web Analytics
- Survey Reports
- Research Institute
- Latest Research Reports
- Opinion Leaders
Secondary Research
- Annual Reports
- White Paper
- Latest Press Release
- Industry Association
- Paid Database
- Investor Presentations

Step 4 - Data Triangulation
Involves using different sources of information in order to increase the validity of a study
These sources are likely to be stakeholders in a program - participants, other researchers, program staff, other community members, and so on.
Then we put all data in single framework & apply various statistical tools to find out the dynamic on the market.
During the analysis stage, feedback from the stakeholder groups would be compared to determine areas of agreement as well as areas of divergence