

Key Insights
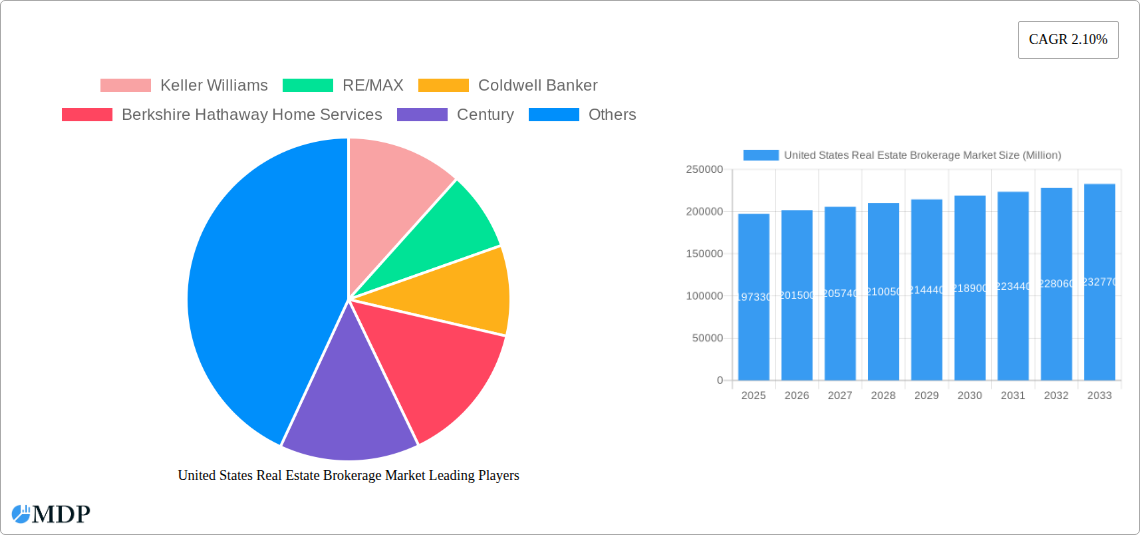
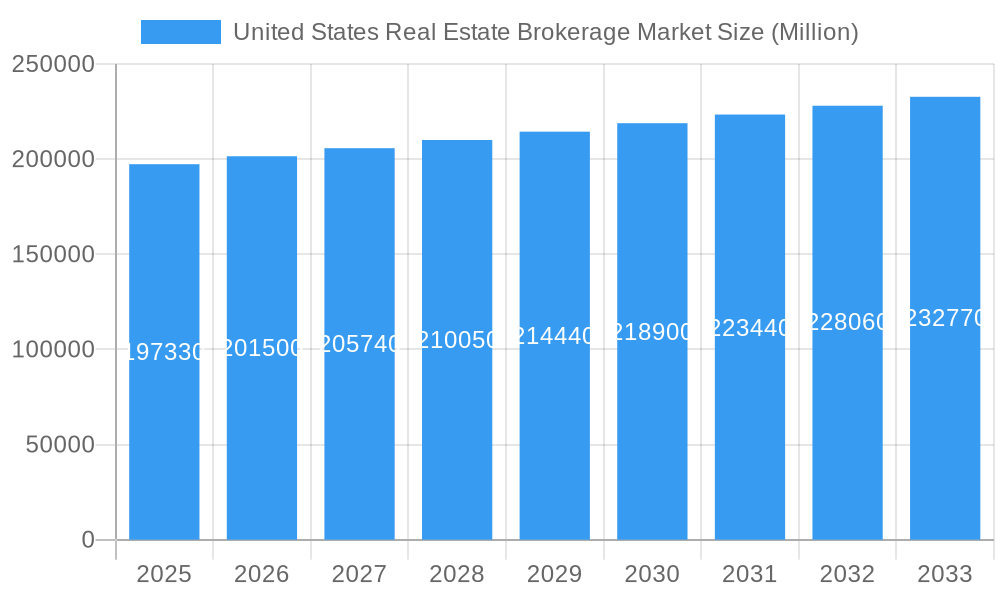
The United States real estate brokerage market, valued at $197.33 billion in 2025, is projected to experience steady growth, driven by several key factors. A consistent rise in home prices and increasing transaction volumes, particularly in high-demand urban areas, fuel market expansion. Technological advancements, such as the adoption of online platforms and virtual tours, are improving efficiency and accessibility within the sector, attracting both buyers and sellers. The increasing preference for personalized service and specialized knowledge also contributes to market growth, leading to higher demand for experienced and tech-savvy brokers. However, challenges like fluctuating interest rates, potential economic slowdowns, and increasing regulatory scrutiny could influence the market's trajectory. Competition among established players like Keller Williams, RE/MAX, Coldwell Banker, and emerging tech-focused companies like Redfin is intense, forcing continuous innovation and adaptation for survival and market share gains. The market is segmented geographically, with significant regional variations in growth rates reflective of local economic conditions and real estate market dynamics.
United States Real Estate Brokerage Market Market Size (In Billion)
Despite potential headwinds, the long-term outlook for the U.S. real estate brokerage market remains positive. The forecast period (2025-2033) suggests continued expansion, albeit at a moderate pace, reflecting a maturing market. The continued growth in the population, coupled with ongoing urbanization and shifts in demographics, will support ongoing demand for real estate services. Moreover, the evolving needs of buyers and sellers, including a preference for data-driven insights and streamlined processes, will continue to shape the market landscape, prompting investment in technology and strategic partnerships within the industry. The competitive landscape is anticipated to remain dynamic, with consolidation and strategic acquisitions shaping the market structure.
United States Real Estate Brokerage Market Company Market Share
This in-depth report provides a comprehensive analysis of the United States real estate brokerage market, offering invaluable insights for industry stakeholders, investors, and strategic decision-makers. The study covers the period from 2019 to 2033, with a focus on the base year 2025 and forecast period 2025-2033. Discover key trends, leading players, and emerging opportunities shaping this dynamic sector. This report leverages extensive market research and analysis to deliver actionable intelligence, enabling informed strategic planning and investment decisions. The total market size in 2025 is estimated at $XX Million.
United States Real Estate Brokerage Market Market Dynamics & Concentration
The US real estate brokerage market is characterized by a moderately concentrated landscape with a few dominant players and numerous smaller, regional firms. Market share is highly contested, with top players engaging in strategic acquisitions to expand their reach and market share. Innovation is a key driver, fueled by technological advancements in property search platforms, virtual tours, and data analytics. The regulatory framework, encompassing fair housing laws and licensing requirements, shapes industry practices and influences market dynamics. While traditional brokerage services remain dominant, increasing competition comes from iBuyers and other technology-driven platforms offering alternative transaction models. Mergers and acquisitions (M&A) activities are frequent, reflecting industry consolidation and the pursuit of scale.
- Market Concentration: Top 5 players hold an estimated xx% market share in 2025.
- M&A Activity: An estimated xx M&A deals were completed between 2019 and 2024.
- Innovation Drivers: Proptech advancements, data analytics, virtual staging, and AI-powered tools are reshaping the industry.
- Regulatory Landscape: Fair Housing Act compliance, licensing standards, and evolving disclosure requirements are paramount.
- Substitute Products: iBuyers, direct-to-consumer platforms, and discount brokerages are posing increasing competition.
United States Real Estate Brokerage Market Industry Trends & Analysis
The US real estate brokerage market is experiencing robust growth driven by factors such as a healthy housing market, increasing homeownership aspirations, and the continued adoption of technology. The Compound Annual Growth Rate (CAGR) during the forecast period (2025-2033) is projected at xx%, reflecting sustained market expansion. Technological disruptions, such as the rise of virtual tours and online property search platforms, are changing consumer preferences and reshaping business models. The market penetration of online real estate platforms has increased significantly, resulting in heightened competition among traditional brokerages and newer digital-first players. Consumer preferences are shifting towards a more personalized and tech-enabled real estate experience.
- Market Growth Drivers: Population growth, urbanization, economic recovery, low interest rates and improved affordability factors in specific regions.
- Technological Disruptions: Digital platforms, virtual tours, AI-powered tools and enhanced data analytics are transforming the customer experience.
- Consumer Preferences: Demand for personalized service, transparency, and digital convenience continues to increase.
- Competitive Dynamics: Intense competition from both established players and emerging technology-driven firms fuels innovation and efficiency.
Leading Markets & Segments in United States Real Estate Brokerage Market
The leading market segment within the US real estate brokerage market is the residential sector, accounting for xx% of the market in 2025. California, Texas, and Florida are the most dominant states in terms of sales volume and transaction value, driven by strong population growth, robust economies, and favorable housing markets.
Key Drivers of Dominance:
- California: Strong economy, high demand, significant population growth, and diverse housing markets.
- Texas: Rapid population growth, job creation, and affordable housing in certain regions.
- Florida: Attractive climate, retirement communities, and growth in tourism and hospitality.
Regional Analysis: The market is segmented geographically, with variations across regions reflecting differences in population density, economic conditions, and housing supply.
United States Real Estate Brokerage Market Product Developments
Recent product innovations focus on enhancing the efficiency of real estate transactions through technology. This includes improved property search tools, virtual tours, digital marketing solutions, and AI-powered property valuation tools. These advancements increase the reach and improve the overall experience for both buyers and sellers, providing a competitive edge to those brokerages that quickly adopt them.
Key Drivers of United States Real Estate Brokerage Market Growth
Several factors are driving the growth of the US real estate brokerage market. These include the ongoing recovery of the housing market, sustained population growth and urbanization, low mortgage interest rates (relative to historical averages), and the increasing adoption of technology which enhances efficiency and market reach. Favorable government policies supporting homeownership further bolster market expansion.
Challenges in the United States Real Estate Brokerage Market Market
The US real estate brokerage market faces several challenges. Regulatory changes and compliance costs increase operational complexity and compliance challenges. The rising competition from iBuyers and other technology-driven platforms disrupts traditional business models and market share. Fluctuations in interest rates and economic conditions directly impact housing market demand and transactions.
Emerging Opportunities in United States Real Estate Brokerage Market
The long-term growth of the US real estate brokerage market is driven by several emerging opportunities. The increasing adoption of PropTech solutions offers opportunities for improved efficiency, customer experiences, and enhanced data analysis. Strategic partnerships with technology companies and expansion into underserved markets further extend market reach and access.
Leading Players in the United States Real Estate Brokerage Market Sector
- Keller Williams
- RE/MAX
- Coldwell Banker
- Berkshire Hathaway HomeServices
- Century 21
- Sotheby's International Realty
- Compass
- eXp Realty
- Realogy Holdings Corp
- Redfin
- 6 Other Companies
- 3 Other Companies
Key Milestones in United States Real Estate Brokerage Market Industry
- April 2024: Compass acquires Latter & Blum, significantly expanding its presence in the Gulf Coast region and gaining an estimated 15% market share in New Orleans.
- May 2024: Compass acquires Parks Real Estate, adding over 1,500 agents and enhancing its technological capabilities and national referral network.
Strategic Outlook for United States Real Estate Brokerage Market Market
The future of the US real estate brokerage market looks promising, with continued growth driven by technological advancements, evolving consumer preferences, and strategic acquisitions. Companies that adapt to these trends, embrace technology, and offer personalized services are poised for success. The focus on data-driven decision-making, strategic partnerships, and expansion into new markets will be crucial for future growth and market leadership.
United States Real Estate Brokerage Market Segmentation
-
1. Type
- 1.1. Residential
- 1.2. Non-Residential
-
2. Service
- 2.1. Sales
- 2.2. Rental
United States Real Estate Brokerage Market Segmentation By Geography
- 1. United States
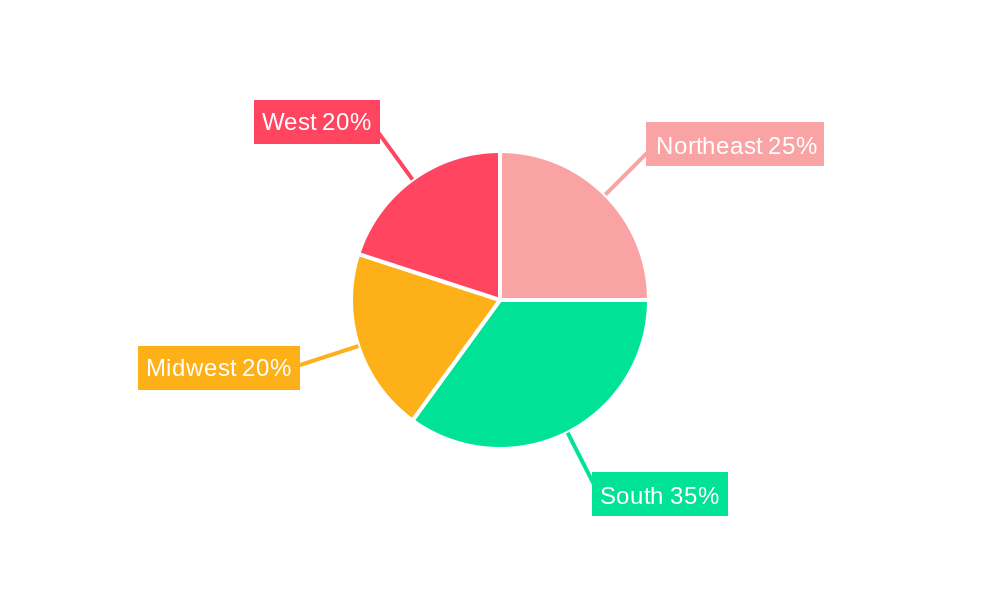
United States Real Estate Brokerage Market Regional Market Share
Geographic Coverage of United States Real Estate Brokerage Market
United States Real Estate Brokerage Market REPORT HIGHLIGHTS
| Aspects | Details |
|---|---|
| Study Period | 2020-2034 |
| Base Year | 2025 |
| Estimated Year | 2026 |
| Forecast Period | 2026-2034 |
| Historical Period | 2020-2025 |
| Growth Rate | CAGR of 2.10% from 2020-2034 |
| Segmentation |
|
Table of Contents
- 1. Introduction
- 1.1. Research Scope
- 1.2. Market Segmentation
- 1.3. Research Objective
- 1.4. Definitions and Assumptions
- 2. Executive Summary
- 2.1. Market Snapshot
- 3. Market Dynamics
- 3.1. Market Drivers
- 3.2. Market Restrains
- 3.3. Market Trends
- 3.4. Market Opportunities
- 4. Market Factor Analysis
- 4.1. Porters Five Forces
- 4.1.1. Bargaining Power of Suppliers
- 4.1.2. Bargaining Power of Buyers
- 4.1.3. Threat of New Entrants
- 4.1.4. Threat of Substitutes
- 4.1.5. Competitive Rivalry
- 4.2. PESTEL analysis
- 4.3. BCG Analysis
- 4.3.1. Stars (High Growth, High Market Share)
- 4.3.2. Cash Cows (Low Growth, High Market Share)
- 4.3.3. Question Mark (High Growth, Low Market Share)
- 4.3.4. Dogs (Low Growth, Low Market Share)
- 4.4. Ansoff Matrix Analysis
- 4.5. Supply Chain Analysis
- 4.6. Regulatory Landscape
- 4.7. Current Market Potential and Opportunity Assessment (TAM–SAM–SOM Framework)
- 4.8. MDP Analyst Note
- 4.1. Porters Five Forces
- 5. Market Analysis, Insights and Forecast 2021-2033
- 5.1. Market Analysis, Insights and Forecast - by Type
- 5.1.1. Residential
- 5.1.2. Non-Residential
- 5.2. Market Analysis, Insights and Forecast - by Service
- 5.2.1. Sales
- 5.2.2. Rental
- 5.3. Market Analysis, Insights and Forecast - by Region
- 5.3.1. United States
- 5.1. Market Analysis, Insights and Forecast - by Type
- 6. United States Real Estate Brokerage Market Analysis, Insights and Forecast, 2021-2033
- 6.1. Market Analysis, Insights and Forecast - by Type
- 6.1.1. Residential
- 6.1.2. Non-Residential
- 6.2. Market Analysis, Insights and Forecast - by Service
- 6.2.1. Sales
- 6.2.2. Rental
- 6.1. Market Analysis, Insights and Forecast - by Type
- 7. Competitive Analysis
- 7.1. Company Profiles
- 7.1.1 Keller Williams
- 7.1.1.1. Company Overview
- 7.1.1.2. Products
- 7.1.1.3. Company Financials
- 7.1.1.4. SWOT Analysis
- 7.1.2 RE/MAX
- 7.1.2.1. Company Overview
- 7.1.2.2. Products
- 7.1.2.3. Company Financials
- 7.1.2.4. SWOT Analysis
- 7.1.3 Coldwell Banker
- 7.1.3.1. Company Overview
- 7.1.3.2. Products
- 7.1.3.3. Company Financials
- 7.1.3.4. SWOT Analysis
- 7.1.4 Berkshire Hathaway Home Services
- 7.1.4.1. Company Overview
- 7.1.4.2. Products
- 7.1.4.3. Company Financials
- 7.1.4.4. SWOT Analysis
- 7.1.5 Century
- 7.1.5.1. Company Overview
- 7.1.5.2. Products
- 7.1.5.3. Company Financials
- 7.1.5.4. SWOT Analysis
- 7.1.6 Sotheby's International Realty
- 7.1.6.1. Company Overview
- 7.1.6.2. Products
- 7.1.6.3. Company Financials
- 7.1.6.4. SWOT Analysis
- 7.1.7 Compass
- 7.1.7.1. Company Overview
- 7.1.7.2. Products
- 7.1.7.3. Company Financials
- 7.1.7.4. SWOT Analysis
- 7.1.8 eXp Realty
- 7.1.8.1. Company Overview
- 7.1.8.2. Products
- 7.1.8.3. Company Financials
- 7.1.8.4. SWOT Analysis
- 7.1.9 Realogy Holdings Corp
- 7.1.9.1. Company Overview
- 7.1.9.2. Products
- 7.1.9.3. Company Financials
- 7.1.9.4. SWOT Analysis
- 7.1.10 Redfin**List Not Exhaustive 6 3 Other Companie
- 7.1.10.1. Company Overview
- 7.1.10.2. Products
- 7.1.10.3. Company Financials
- 7.1.10.4. SWOT Analysis
- 7.1.1 Keller Williams
- 7.2. Market Entropy
- 7.2.1 Company's Key Areas Served
- 7.2.2 Recent Developments
- 7.3. Company Market Share Analysis 2025
- 7.3.1 Top 5 Companies Market Share Analysis
- 7.3.2 Top 3 Companies Market Share Analysis
- 7.4. List of Potential Customers
- 8. Research Methodology
List of Figures
- Figure 1: United States Real Estate Brokerage Market Revenue Breakdown (Million, %) by Product 2025 & 2033
- Figure 2: United States Real Estate Brokerage Market Share (%) by Company 2025
List of Tables
- Table 1: United States Real Estate Brokerage Market Revenue Million Forecast, by Type 2020 & 2033
- Table 2: United States Real Estate Brokerage Market Volume Billion Forecast, by Type 2020 & 2033
- Table 3: United States Real Estate Brokerage Market Revenue Million Forecast, by Service 2020 & 2033
- Table 4: United States Real Estate Brokerage Market Volume Billion Forecast, by Service 2020 & 2033
- Table 5: United States Real Estate Brokerage Market Revenue Million Forecast, by Region 2020 & 2033
- Table 6: United States Real Estate Brokerage Market Volume Billion Forecast, by Region 2020 & 2033
- Table 7: United States Real Estate Brokerage Market Revenue Million Forecast, by Type 2020 & 2033
- Table 8: United States Real Estate Brokerage Market Volume Billion Forecast, by Type 2020 & 2033
- Table 9: United States Real Estate Brokerage Market Revenue Million Forecast, by Service 2020 & 2033
- Table 10: United States Real Estate Brokerage Market Volume Billion Forecast, by Service 2020 & 2033
- Table 11: United States Real Estate Brokerage Market Revenue Million Forecast, by Country 2020 & 2033
- Table 12: United States Real Estate Brokerage Market Volume Billion Forecast, by Country 2020 & 2033
Frequently Asked Questions
1. What is the projected Compound Annual Growth Rate (CAGR) of the United States Real Estate Brokerage Market?
The projected CAGR is approximately 2.10%.
2. Which companies are prominent players in the United States Real Estate Brokerage Market?
Key companies in the market include Keller Williams, RE/MAX, Coldwell Banker, Berkshire Hathaway Home Services, Century, Sotheby's International Realty, Compass, eXp Realty, Realogy Holdings Corp, Redfin**List Not Exhaustive 6 3 Other Companie.
3. What are the main segments of the United States Real Estate Brokerage Market?
The market segments include Type, Service.
4. Can you provide details about the market size?
The market size is estimated to be USD 197.33 Million as of 2022.
5. What are some drivers contributing to market growth?
4.; Increasing Urbanization Driving the Market4.; Regulatory Environment Driving the market.
6. What are the notable trends driving market growth?
Industrial Sector Leads Real Estate Absorption. Retail Tightens Vacancy Rates.
7. Are there any restraints impacting market growth?
4.; Increasing Urbanization Driving the Market4.; Regulatory Environment Driving the market.
8. Can you provide examples of recent developments in the market?
May 2024: Compass Inc., the leading residential real estate brokerage by sales volume in the United States, acquired Parks Real Estate, Tennessee's top residential real estate firm that boasts over 1,500 agents. Known for its strategic acquisitions and organic growth, Compass's collaboration with Parks Real Estate not only enriches its agent pool but also grants these agents access to Compass's cutting-edge technology and a vast national referral network.
9. What pricing options are available for accessing the report?
Pricing options include single-user, multi-user, and enterprise licenses priced at USD 3800, USD 4500, and USD 5800 respectively.
10. Is the market size provided in terms of value or volume?
The market size is provided in terms of value, measured in Million and volume, measured in Billion.
11. Are there any specific market keywords associated with the report?
Yes, the market keyword associated with the report is "United States Real Estate Brokerage Market," which aids in identifying and referencing the specific market segment covered.
12. How do I determine which pricing option suits my needs best?
The pricing options vary based on user requirements and access needs. Individual users may opt for single-user licenses, while businesses requiring broader access may choose multi-user or enterprise licenses for cost-effective access to the report.
13. Are there any additional resources or data provided in the United States Real Estate Brokerage Market report?
While the report offers comprehensive insights, it's advisable to review the specific contents or supplementary materials provided to ascertain if additional resources or data are available.
14. How can I stay updated on further developments or reports in the United States Real Estate Brokerage Market?
To stay informed about further developments, trends, and reports in the United States Real Estate Brokerage Market, consider subscribing to industry newsletters, following relevant companies and organizations, or regularly checking reputable industry news sources and publications.
Methodology
Step 1 - Identification of Relevant Samples Size from Population Database


Step 2 - Approaches for Defining Global Market Size (Value, Volume* & Price*)

Note*: In applicable scenarios
Step 3 - Data Sources
Primary Research
- Web Analytics
- Survey Reports
- Research Institute
- Latest Research Reports
- Opinion Leaders
Secondary Research
- Annual Reports
- White Paper
- Latest Press Release
- Industry Association
- Paid Database
- Investor Presentations

Step 4 - Data Triangulation
Involves using different sources of information in order to increase the validity of a study
These sources are likely to be stakeholders in a program - participants, other researchers, program staff, other community members, and so on.
Then we put all data in single framework & apply various statistical tools to find out the dynamic on the market.
During the analysis stage, feedback from the stakeholder groups would be compared to determine areas of agreement as well as areas of divergence