

Key Insights
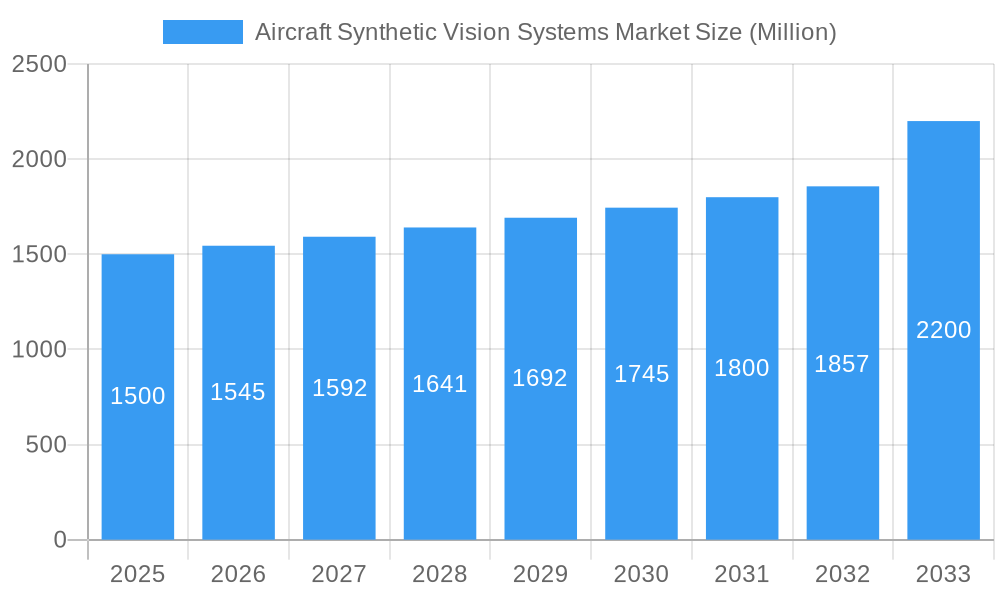
The Aircraft Synthetic Vision Systems (SVS) market is poised for significant expansion, driven by the escalating demand for enhanced situational awareness and safety protocols across commercial and military aviation. The market, valued at $281.16 million in the base year 2025, is projected to achieve a Compound Annual Growth Rate (CAGR) of 4% through 2033. This robust growth is attributed to several key factors, including evolving safety regulations necessitating SVS integration in new aircraft, wider adoption in general aviation due to improved safety and cost-effectiveness, and continuous advancements in display technology offering higher resolution, intuitive interfaces, and superior terrain and obstacle avoidance capabilities. The seamless integration of SVS with other avionics further bolsters flight safety and operational efficiency.
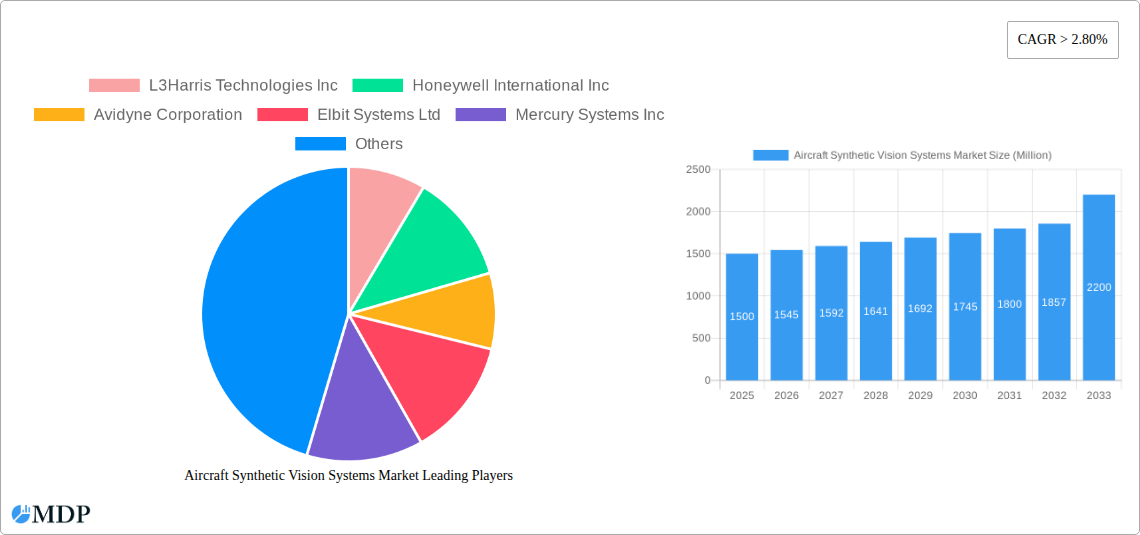
Aircraft Synthetic Vision Systems Market Market Size (In Million)
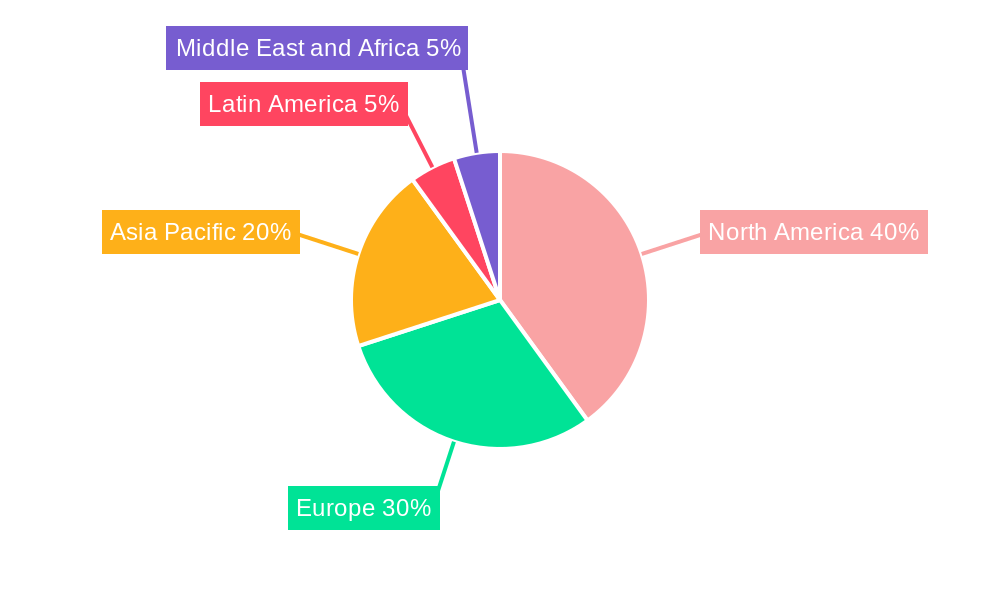
In terms of segmentation, the primary flight display segment currently leads, with navigation displays following closely. However, heads-up and helmet-mounted display segments are anticipated to experience the most rapid growth, driven by their intuitive user experience and critical advantages in adverse weather and low-visibility conditions. Geographically, North America holds the leading market position, supported by advanced technological development and a substantial aircraft fleet. The Asia-Pacific region, however, is expected to witness considerable growth, fueled by increased air travel, a rising volume of new aircraft orders, and significant investments in aviation infrastructure. Leading companies such as L3Harris Technologies, Honeywell, and Garmin are actively investing in research and development for sophisticated SVS solutions, fostering intense competition and innovation. The ongoing expansion of both commercial and military aviation sectors, alongside a heightened emphasis on pilot training and safety, will continue to propel market growth.
Aircraft Synthetic Vision Systems Market Company Market Share
Aircraft Synthetic Vision Systems Market: A Comprehensive Report (2019-2033)
This in-depth report provides a comprehensive analysis of the Aircraft Synthetic Vision Systems Market, offering invaluable insights for industry stakeholders, investors, and strategic decision-makers. The market is projected to reach xx Million by 2033, showcasing significant growth potential. This report covers the period from 2019 to 2033, with a focus on the forecast period from 2025 to 2033. The base year for this analysis is 2025. Key segments analyzed include By Type (Primary Flight Display, Navigation Display, Heads-up and Helmet-mounted Display, Other Types) and By End User (Military, Commercial, General Aviation). Leading companies such as L3Harris Technologies Inc, Honeywell International Inc, and Garmin Ltd are profiled, offering a competitive landscape analysis.
Aircraft Synthetic Vision Systems Market Market Dynamics & Concentration
The Aircraft Synthetic Vision Systems market exhibits a moderately concentrated structure, with a few major players holding significant market share. The market share distribution is dynamic, influenced by continuous product innovation, strategic partnerships, and mergers & acquisitions (M&A). While precise market share figures for each company are proprietary data and will be presented in the full report, the market is likely characterized by a leading player holding a 20-25% share and a few more with shares in the 10-15% range. The remaining market is occupied by several smaller companies, each with a small market presence.
Innovation Drivers: Advancements in sensor technology, display technology, and processing power are major drivers, enabling the development of more sophisticated and reliable synthetic vision systems. The increasing demand for enhanced safety and situational awareness, particularly in challenging weather conditions, is further boosting innovation.
Regulatory Frameworks: Stringent safety regulations imposed by aviation authorities worldwide, such as the FAA and EASA, play a crucial role in shaping market growth. These regulations necessitate the adoption of advanced safety technologies, including synthetic vision systems.
Product Substitutes: While no direct substitutes exist for the core functionality of synthetic vision systems, alternative navigation aids and enhanced pilot training programs can partially address similar needs. However, the superiority of synthetic vision in terms of situational awareness and enhanced safety makes it a preferred choice.
End-User Trends: The increasing preference for enhanced safety features across both commercial and military aviation sectors is driving demand for sophisticated synthetic vision systems. The military segment is experiencing high growth driven by the need for improved pilot situational awareness in complex environments.
M&A Activities: The market has witnessed a moderate number of M&A activities in recent years (xx deals between 2019-2024), primarily focused on expanding product portfolios and market reach. The complete count of M&A's and further details will be provided in the full report.
Aircraft Synthetic Vision Systems Market Industry Trends & Analysis
The Aircraft Synthetic Vision Systems market is experiencing robust growth, driven by several key factors. The market is projected to register a Compound Annual Growth Rate (CAGR) of xx% during the forecast period (2025-2033). This growth is fueled by technological advancements, increasing demand for enhanced safety, and rising adoption across various aircraft types. Market penetration has steadily increased, especially within the commercial aviation sector, with a significant portion of new aircraft incorporating synthetic vision systems as standard features. The penetration rate is anticipated to increase even more during the forecast period.
Technological disruptions are transforming the industry, with the advent of high-resolution displays, advanced sensor fusion technologies, and improved processing capabilities. Consumer preferences are shifting towards systems offering seamless integration with existing avionics, intuitive user interfaces, and advanced features such as terrain awareness and obstacle avoidance. Competitive dynamics are characterized by intense rivalry among leading players, with each vying to offer superior product features, performance, and cost-effectiveness.
Leading Markets & Segments in Aircraft Synthetic Vision Systems Market
The North American market holds the dominant position globally within the Aircraft Synthetic Vision Systems market owing to its well-established aviation industry, stringent safety regulations, and early adoption of advanced technologies. The commercial aviation segment represents a significant portion of the market, followed by the military and general aviation segments.
Key Drivers by Segment:
By Type:
- Primary Flight Display: High demand due to its critical role in providing pilots with essential flight information in a clear and concise manner.
- Navigation Display: Increased adoption driven by the need for precise navigation capabilities, especially in low visibility conditions.
- Heads-up and Helmet-mounted Display: Growing popularity due to improved situational awareness and reduced pilot workload.
- Other Types: This segment includes emerging technologies and niche applications.
By End User:
- Military: High demand for improved situational awareness and enhanced safety in military operations.
- Commercial: Significant growth due to the large number of commercial aircraft requiring advanced safety features.
- General Aviation: Increasing adoption driven by safety enhancements for smaller aircraft.
Dominance Analysis: The dominance of North America is attributed to a combination of factors, including a robust aerospace manufacturing base, a large fleet of commercial and military aircraft, and strong government support for the adoption of advanced technologies. Europe and Asia Pacific regions also present significant growth opportunities. More detailed regional analysis including country-level breakdowns, market size and CAGR projections for each segment and region are provided in the full report.
Aircraft Synthetic Vision Systems Market Product Developments
Recent product innovations focus on enhanced realism, improved integration with existing avionics, and advanced features such as enhanced terrain awareness and warning systems (TAWS). These developments aim to provide pilots with a superior understanding of their environment, irrespective of weather conditions, improving safety and efficiency. The competitive advantage lies in offering systems with high reliability, intuitive user interfaces, and seamless integration with other aircraft systems. The trend towards miniaturization and reduced power consumption is also gaining traction.
Key Drivers of Aircraft Synthetic Vision Systems Market Growth
Technological advancements in sensor technologies, display technologies, and processing power are fundamental to the market’s growth. Stringent safety regulations mandated by aviation authorities are also significant drivers, incentivizing the adoption of advanced safety features. Economic factors such as increased investments in airline fleets and modernization of military aircraft fleets influence market expansion. Growing focus on enhancing passenger safety and reducing operating costs further stimulates demand.
Challenges in the Aircraft Synthetic Vision Systems Market Market
High initial investment costs and complex integration processes pose challenges for widespread adoption, particularly in the general aviation sector. Supply chain disruptions and fluctuations in raw material prices can impact production costs and profitability. Intense competition from established players and new entrants creates pricing pressures and necessitates continuous product innovation. The need for ongoing certification and compliance with evolving safety regulations adds to the overall costs.
Emerging Opportunities in Aircraft Synthetic Vision Systems Market
The development of advanced sensor fusion technologies, including the integration of lidar and other sensor inputs, promises to enhance the accuracy and reliability of synthetic vision systems. Strategic partnerships between system integrators and component manufacturers can drive innovation and market penetration. Expanding into emerging markets in Asia and Latin America presents significant growth opportunities, particularly as these regions experience growth in their aviation sectors.
Leading Players in the Aircraft Synthetic Vision Systems Market Sector
- L3Harris Technologies Inc
- Honeywell International Inc
- Avidyne Corporation
- Elbit Systems Ltd
- Mercury Systems Inc
- Garmin Ltd
- Cobham Limited
- Safran SA
- Thales Group
- ENSCO Inc
- Aspen Avionics Inc
- Collins Aerospace (Raytheon Technologies Corporation)
Key Milestones in Aircraft Synthetic Vision Systems Market Industry
- October 2022: Collins Aerospace achieves TSO for its combined vision system (CVS) for business aviation aircraft, enhancing low-visibility navigation.
- October 2022: Garmin International receives FAA STC for its GI 275 electronic flight instrument in the Dassault Falcon 7X, improving flight instrumentation.
- October 2021: Honeywell unveils its Anthem flight deck, introducing an always-on, cloud-connected cockpit system that improves flight efficiency, safety and comfort.
Strategic Outlook for Aircraft Synthetic Vision Systems Market Market
The Aircraft Synthetic Vision Systems market is poised for sustained growth, driven by technological advancements, increasing demand for enhanced safety, and expansion into new markets. Strategic partnerships, acquisitions, and a focus on innovation will be crucial for success. Companies focusing on developing cost-effective and easily integrable solutions will likely gain a competitive edge. The long-term outlook is optimistic, with significant growth potential across various segments and regions.
Aircraft Synthetic Vision Systems Market Segmentation
-
1. Type
- 1.1. Primary Flight Display
- 1.2. Navigation Display
- 1.3. Heads-up and Helmet-mounted Display
- 1.4. Other Types
-
2. End User
- 2.1. Military
- 2.2. Commercial
- 2.3. General Aviation
Aircraft Synthetic Vision Systems Market Segmentation By Geography
-
1. North America
- 1.1. United States
- 1.2. Canada
-
2. Europe
- 2.1. Germany
- 2.2. United Kingdom
- 2.3. France
- 2.4. Russia
- 2.5. Rest of Europe
-
3. Asia Pacific
- 3.1. China
- 3.2. Japan
- 3.3. India
- 3.4. South Korea
- 3.5. Rest of Asia Pacific
-
4. Latin America
- 4.1. Brazil
- 4.2. Mexico
- 4.3. Rest of Latin America
-
5. Middle East and Africa
- 5.1. United Arab Emirates
- 5.2. Saudi Arabia
- 5.3. Egypt
- 5.4. Rest of Middle East and Africa
Aircraft Synthetic Vision Systems Market Regional Market Share
Geographic Coverage of Aircraft Synthetic Vision Systems Market
Aircraft Synthetic Vision Systems Market REPORT HIGHLIGHTS
| Aspects | Details |
|---|---|
| Study Period | 2020-2034 |
| Base Year | 2025 |
| Estimated Year | 2026 |
| Forecast Period | 2026-2034 |
| Historical Period | 2020-2025 |
| Growth Rate | CAGR of 4% from 2020-2034 |
| Segmentation |
|
Table of Contents
- 1. Introduction
- 1.1. Research Scope
- 1.2. Market Segmentation
- 1.3. Research Objective
- 1.4. Definitions and Assumptions
- 2. Executive Summary
- 2.1. Market Snapshot
- 3. Market Dynamics
- 3.1. Market Drivers
- 3.2. Market Restrains
- 3.3. Market Trends
- 3.4. Market Opportunities
- 4. Market Factor Analysis
- 4.1. Porters Five Forces
- 4.1.1. Bargaining Power of Suppliers
- 4.1.2. Bargaining Power of Buyers
- 4.1.3. Threat of New Entrants
- 4.1.4. Threat of Substitutes
- 4.1.5. Competitive Rivalry
- 4.2. PESTEL analysis
- 4.3. BCG Analysis
- 4.3.1. Stars (High Growth, High Market Share)
- 4.3.2. Cash Cows (Low Growth, High Market Share)
- 4.3.3. Question Mark (High Growth, Low Market Share)
- 4.3.4. Dogs (Low Growth, Low Market Share)
- 4.4. Ansoff Matrix Analysis
- 4.5. Supply Chain Analysis
- 4.6. Regulatory Landscape
- 4.7. Current Market Potential and Opportunity Assessment (TAM–SAM–SOM Framework)
- 4.8. MDP Analyst Note
- 4.1. Porters Five Forces
- 5. Market Analysis, Insights and Forecast 2021-2033
- 5.1. Market Analysis, Insights and Forecast - by Type
- 5.1.1. Primary Flight Display
- 5.1.2. Navigation Display
- 5.1.3. Heads-up and Helmet-mounted Display
- 5.1.4. Other Types
- 5.2. Market Analysis, Insights and Forecast - by End User
- 5.2.1. Military
- 5.2.2. Commercial
- 5.2.3. General Aviation
- 5.3. Market Analysis, Insights and Forecast - by Region
- 5.3.1. North America
- 5.3.2. Europe
- 5.3.3. Asia Pacific
- 5.3.4. Latin America
- 5.3.5. Middle East and Africa
- 5.1. Market Analysis, Insights and Forecast - by Type
- 6. Global Aircraft Synthetic Vision Systems Market Analysis, Insights and Forecast, 2021-2033
- 6.1. Market Analysis, Insights and Forecast - by Type
- 6.1.1. Primary Flight Display
- 6.1.2. Navigation Display
- 6.1.3. Heads-up and Helmet-mounted Display
- 6.1.4. Other Types
- 6.2. Market Analysis, Insights and Forecast - by End User
- 6.2.1. Military
- 6.2.2. Commercial
- 6.2.3. General Aviation
- 6.1. Market Analysis, Insights and Forecast - by Type
- 7. North America Aircraft Synthetic Vision Systems Market Analysis, Insights and Forecast, 2020-2032
- 7.1. Market Analysis, Insights and Forecast - by Type
- 7.1.1. Primary Flight Display
- 7.1.2. Navigation Display
- 7.1.3. Heads-up and Helmet-mounted Display
- 7.1.4. Other Types
- 7.2. Market Analysis, Insights and Forecast - by End User
- 7.2.1. Military
- 7.2.2. Commercial
- 7.2.3. General Aviation
- 7.1. Market Analysis, Insights and Forecast - by Type
- 8. Europe Aircraft Synthetic Vision Systems Market Analysis, Insights and Forecast, 2020-2032
- 8.1. Market Analysis, Insights and Forecast - by Type
- 8.1.1. Primary Flight Display
- 8.1.2. Navigation Display
- 8.1.3. Heads-up and Helmet-mounted Display
- 8.1.4. Other Types
- 8.2. Market Analysis, Insights and Forecast - by End User
- 8.2.1. Military
- 8.2.2. Commercial
- 8.2.3. General Aviation
- 8.1. Market Analysis, Insights and Forecast - by Type
- 9. Asia Pacific Aircraft Synthetic Vision Systems Market Analysis, Insights and Forecast, 2020-2032
- 9.1. Market Analysis, Insights and Forecast - by Type
- 9.1.1. Primary Flight Display
- 9.1.2. Navigation Display
- 9.1.3. Heads-up and Helmet-mounted Display
- 9.1.4. Other Types
- 9.2. Market Analysis, Insights and Forecast - by End User
- 9.2.1. Military
- 9.2.2. Commercial
- 9.2.3. General Aviation
- 9.1. Market Analysis, Insights and Forecast - by Type
- 10. Latin America Aircraft Synthetic Vision Systems Market Analysis, Insights and Forecast, 2020-2032
- 10.1. Market Analysis, Insights and Forecast - by Type
- 10.1.1. Primary Flight Display
- 10.1.2. Navigation Display
- 10.1.3. Heads-up and Helmet-mounted Display
- 10.1.4. Other Types
- 10.2. Market Analysis, Insights and Forecast - by End User
- 10.2.1. Military
- 10.2.2. Commercial
- 10.2.3. General Aviation
- 10.1. Market Analysis, Insights and Forecast - by Type
- 11. Middle East and Africa Aircraft Synthetic Vision Systems Market Analysis, Insights and Forecast, 2020-2032
- 11.1. Market Analysis, Insights and Forecast - by Type
- 11.1.1. Primary Flight Display
- 11.1.2. Navigation Display
- 11.1.3. Heads-up and Helmet-mounted Display
- 11.1.4. Other Types
- 11.2. Market Analysis, Insights and Forecast - by End User
- 11.2.1. Military
- 11.2.2. Commercial
- 11.2.3. General Aviation
- 11.1. Market Analysis, Insights and Forecast - by Type
- 12. Competitive Analysis
- 12.1. Company Profiles
- 12.1.1 L3Harris Technologies Inc
- 12.1.1.1. Company Overview
- 12.1.1.2. Products
- 12.1.1.3. Company Financials
- 12.1.1.4. SWOT Analysis
- 12.1.2 Honeywell International Inc
- 12.1.2.1. Company Overview
- 12.1.2.2. Products
- 12.1.2.3. Company Financials
- 12.1.2.4. SWOT Analysis
- 12.1.3 Avidyne Corporation
- 12.1.3.1. Company Overview
- 12.1.3.2. Products
- 12.1.3.3. Company Financials
- 12.1.3.4. SWOT Analysis
- 12.1.4 Elbit Systems Ltd
- 12.1.4.1. Company Overview
- 12.1.4.2. Products
- 12.1.4.3. Company Financials
- 12.1.4.4. SWOT Analysis
- 12.1.5 Mercury Systems Inc
- 12.1.5.1. Company Overview
- 12.1.5.2. Products
- 12.1.5.3. Company Financials
- 12.1.5.4. SWOT Analysis
- 12.1.6 Garmin Ltd
- 12.1.6.1. Company Overview
- 12.1.6.2. Products
- 12.1.6.3. Company Financials
- 12.1.6.4. SWOT Analysis
- 12.1.7 Cobham Limited
- 12.1.7.1. Company Overview
- 12.1.7.2. Products
- 12.1.7.3. Company Financials
- 12.1.7.4. SWOT Analysis
- 12.1.8 Safran SA
- 12.1.8.1. Company Overview
- 12.1.8.2. Products
- 12.1.8.3. Company Financials
- 12.1.8.4. SWOT Analysis
- 12.1.9 Thales Group
- 12.1.9.1. Company Overview
- 12.1.9.2. Products
- 12.1.9.3. Company Financials
- 12.1.9.4. SWOT Analysis
- 12.1.10 ENSCO Inc
- 12.1.10.1. Company Overview
- 12.1.10.2. Products
- 12.1.10.3. Company Financials
- 12.1.10.4. SWOT Analysis
- 12.1.11 Aspen Avionics Inc
- 12.1.11.1. Company Overview
- 12.1.11.2. Products
- 12.1.11.3. Company Financials
- 12.1.11.4. SWOT Analysis
- 12.1.12 Collins Aerospace (Raytheon Technologies Corporation)
- 12.1.12.1. Company Overview
- 12.1.12.2. Products
- 12.1.12.3. Company Financials
- 12.1.12.4. SWOT Analysis
- 12.1.1 L3Harris Technologies Inc
- 12.2. Market Entropy
- 12.2.1 Company's Key Areas Served
- 12.2.2 Recent Developments
- 12.3. Company Market Share Analysis 2025
- 12.3.1 Top 5 Companies Market Share Analysis
- 12.3.2 Top 3 Companies Market Share Analysis
- 12.4. List of Potential Customers
- 13. Research Methodology
List of Figures
- Figure 1: Global Aircraft Synthetic Vision Systems Market Revenue Breakdown (million, %) by Region 2025 & 2033
- Figure 2: North America Aircraft Synthetic Vision Systems Market Revenue (million), by Type 2025 & 2033
- Figure 3: North America Aircraft Synthetic Vision Systems Market Revenue Share (%), by Type 2025 & 2033
- Figure 4: North America Aircraft Synthetic Vision Systems Market Revenue (million), by End User 2025 & 2033
- Figure 5: North America Aircraft Synthetic Vision Systems Market Revenue Share (%), by End User 2025 & 2033
- Figure 6: North America Aircraft Synthetic Vision Systems Market Revenue (million), by Country 2025 & 2033
- Figure 7: North America Aircraft Synthetic Vision Systems Market Revenue Share (%), by Country 2025 & 2033
- Figure 8: Europe Aircraft Synthetic Vision Systems Market Revenue (million), by Type 2025 & 2033
- Figure 9: Europe Aircraft Synthetic Vision Systems Market Revenue Share (%), by Type 2025 & 2033
- Figure 10: Europe Aircraft Synthetic Vision Systems Market Revenue (million), by End User 2025 & 2033
- Figure 11: Europe Aircraft Synthetic Vision Systems Market Revenue Share (%), by End User 2025 & 2033
- Figure 12: Europe Aircraft Synthetic Vision Systems Market Revenue (million), by Country 2025 & 2033
- Figure 13: Europe Aircraft Synthetic Vision Systems Market Revenue Share (%), by Country 2025 & 2033
- Figure 14: Asia Pacific Aircraft Synthetic Vision Systems Market Revenue (million), by Type 2025 & 2033
- Figure 15: Asia Pacific Aircraft Synthetic Vision Systems Market Revenue Share (%), by Type 2025 & 2033
- Figure 16: Asia Pacific Aircraft Synthetic Vision Systems Market Revenue (million), by End User 2025 & 2033
- Figure 17: Asia Pacific Aircraft Synthetic Vision Systems Market Revenue Share (%), by End User 2025 & 2033
- Figure 18: Asia Pacific Aircraft Synthetic Vision Systems Market Revenue (million), by Country 2025 & 2033
- Figure 19: Asia Pacific Aircraft Synthetic Vision Systems Market Revenue Share (%), by Country 2025 & 2033
- Figure 20: Latin America Aircraft Synthetic Vision Systems Market Revenue (million), by Type 2025 & 2033
- Figure 21: Latin America Aircraft Synthetic Vision Systems Market Revenue Share (%), by Type 2025 & 2033
- Figure 22: Latin America Aircraft Synthetic Vision Systems Market Revenue (million), by End User 2025 & 2033
- Figure 23: Latin America Aircraft Synthetic Vision Systems Market Revenue Share (%), by End User 2025 & 2033
- Figure 24: Latin America Aircraft Synthetic Vision Systems Market Revenue (million), by Country 2025 & 2033
- Figure 25: Latin America Aircraft Synthetic Vision Systems Market Revenue Share (%), by Country 2025 & 2033
- Figure 26: Middle East and Africa Aircraft Synthetic Vision Systems Market Revenue (million), by Type 2025 & 2033
- Figure 27: Middle East and Africa Aircraft Synthetic Vision Systems Market Revenue Share (%), by Type 2025 & 2033
- Figure 28: Middle East and Africa Aircraft Synthetic Vision Systems Market Revenue (million), by End User 2025 & 2033
- Figure 29: Middle East and Africa Aircraft Synthetic Vision Systems Market Revenue Share (%), by End User 2025 & 2033
- Figure 30: Middle East and Africa Aircraft Synthetic Vision Systems Market Revenue (million), by Country 2025 & 2033
- Figure 31: Middle East and Africa Aircraft Synthetic Vision Systems Market Revenue Share (%), by Country 2025 & 2033
List of Tables
- Table 1: Global Aircraft Synthetic Vision Systems Market Revenue million Forecast, by Type 2020 & 2033
- Table 2: Global Aircraft Synthetic Vision Systems Market Revenue million Forecast, by End User 2020 & 2033
- Table 3: Global Aircraft Synthetic Vision Systems Market Revenue million Forecast, by Region 2020 & 2033
- Table 4: Global Aircraft Synthetic Vision Systems Market Revenue million Forecast, by Type 2020 & 2033
- Table 5: Global Aircraft Synthetic Vision Systems Market Revenue million Forecast, by End User 2020 & 2033
- Table 6: Global Aircraft Synthetic Vision Systems Market Revenue million Forecast, by Country 2020 & 2033
- Table 7: United States Aircraft Synthetic Vision Systems Market Revenue (million) Forecast, by Application 2020 & 2033
- Table 8: Canada Aircraft Synthetic Vision Systems Market Revenue (million) Forecast, by Application 2020 & 2033
- Table 9: Global Aircraft Synthetic Vision Systems Market Revenue million Forecast, by Type 2020 & 2033
- Table 10: Global Aircraft Synthetic Vision Systems Market Revenue million Forecast, by End User 2020 & 2033
- Table 11: Global Aircraft Synthetic Vision Systems Market Revenue million Forecast, by Country 2020 & 2033
- Table 12: Germany Aircraft Synthetic Vision Systems Market Revenue (million) Forecast, by Application 2020 & 2033
- Table 13: United Kingdom Aircraft Synthetic Vision Systems Market Revenue (million) Forecast, by Application 2020 & 2033
- Table 14: France Aircraft Synthetic Vision Systems Market Revenue (million) Forecast, by Application 2020 & 2033
- Table 15: Russia Aircraft Synthetic Vision Systems Market Revenue (million) Forecast, by Application 2020 & 2033
- Table 16: Rest of Europe Aircraft Synthetic Vision Systems Market Revenue (million) Forecast, by Application 2020 & 2033
- Table 17: Global Aircraft Synthetic Vision Systems Market Revenue million Forecast, by Type 2020 & 2033
- Table 18: Global Aircraft Synthetic Vision Systems Market Revenue million Forecast, by End User 2020 & 2033
- Table 19: Global Aircraft Synthetic Vision Systems Market Revenue million Forecast, by Country 2020 & 2033
- Table 20: China Aircraft Synthetic Vision Systems Market Revenue (million) Forecast, by Application 2020 & 2033
- Table 21: Japan Aircraft Synthetic Vision Systems Market Revenue (million) Forecast, by Application 2020 & 2033
- Table 22: India Aircraft Synthetic Vision Systems Market Revenue (million) Forecast, by Application 2020 & 2033
- Table 23: South Korea Aircraft Synthetic Vision Systems Market Revenue (million) Forecast, by Application 2020 & 2033
- Table 24: Rest of Asia Pacific Aircraft Synthetic Vision Systems Market Revenue (million) Forecast, by Application 2020 & 2033
- Table 25: Global Aircraft Synthetic Vision Systems Market Revenue million Forecast, by Type 2020 & 2033
- Table 26: Global Aircraft Synthetic Vision Systems Market Revenue million Forecast, by End User 2020 & 2033
- Table 27: Global Aircraft Synthetic Vision Systems Market Revenue million Forecast, by Country 2020 & 2033
- Table 28: Brazil Aircraft Synthetic Vision Systems Market Revenue (million) Forecast, by Application 2020 & 2033
- Table 29: Mexico Aircraft Synthetic Vision Systems Market Revenue (million) Forecast, by Application 2020 & 2033
- Table 30: Rest of Latin America Aircraft Synthetic Vision Systems Market Revenue (million) Forecast, by Application 2020 & 2033
- Table 31: Global Aircraft Synthetic Vision Systems Market Revenue million Forecast, by Type 2020 & 2033
- Table 32: Global Aircraft Synthetic Vision Systems Market Revenue million Forecast, by End User 2020 & 2033
- Table 33: Global Aircraft Synthetic Vision Systems Market Revenue million Forecast, by Country 2020 & 2033
- Table 34: United Arab Emirates Aircraft Synthetic Vision Systems Market Revenue (million) Forecast, by Application 2020 & 2033
- Table 35: Saudi Arabia Aircraft Synthetic Vision Systems Market Revenue (million) Forecast, by Application 2020 & 2033
- Table 36: Egypt Aircraft Synthetic Vision Systems Market Revenue (million) Forecast, by Application 2020 & 2033
- Table 37: Rest of Middle East and Africa Aircraft Synthetic Vision Systems Market Revenue (million) Forecast, by Application 2020 & 2033
Frequently Asked Questions
1. What is the projected Compound Annual Growth Rate (CAGR) of the Aircraft Synthetic Vision Systems Market?
The projected CAGR is approximately 4%.
2. Which companies are prominent players in the Aircraft Synthetic Vision Systems Market?
Key companies in the market include L3Harris Technologies Inc, Honeywell International Inc, Avidyne Corporation, Elbit Systems Ltd, Mercury Systems Inc, Garmin Ltd, Cobham Limited, Safran SA, Thales Group, ENSCO Inc, Aspen Avionics Inc, Collins Aerospace (Raytheon Technologies Corporation).
3. What are the main segments of the Aircraft Synthetic Vision Systems Market?
The market segments include Type, End User.
4. Can you provide details about the market size?
The market size is estimated to be USD 281.16 million as of 2022.
5. What are some drivers contributing to market growth?
N/A
6. What are the notable trends driving market growth?
Military End-user to Witness Higher Growth During the Forecast Period.
7. Are there any restraints impacting market growth?
N/A
8. Can you provide examples of recent developments in the market?
In October 2022, Collins Aerospace achieved a technical standard order (TSO) for its combined vision system (CVS) for business aviation aircraft. The CVS provides clarity to pilots in all types of weather to confidently and securely navigate aircraft through low visibility situations.
9. What pricing options are available for accessing the report?
Pricing options include single-user, multi-user, and enterprise licenses priced at USD 4750, USD 5250, and USD 8750 respectively.
10. Is the market size provided in terms of value or volume?
The market size is provided in terms of value, measured in million.
11. Are there any specific market keywords associated with the report?
Yes, the market keyword associated with the report is "Aircraft Synthetic Vision Systems Market," which aids in identifying and referencing the specific market segment covered.
12. How do I determine which pricing option suits my needs best?
The pricing options vary based on user requirements and access needs. Individual users may opt for single-user licenses, while businesses requiring broader access may choose multi-user or enterprise licenses for cost-effective access to the report.
13. Are there any additional resources or data provided in the Aircraft Synthetic Vision Systems Market report?
While the report offers comprehensive insights, it's advisable to review the specific contents or supplementary materials provided to ascertain if additional resources or data are available.
14. How can I stay updated on further developments or reports in the Aircraft Synthetic Vision Systems Market?
To stay informed about further developments, trends, and reports in the Aircraft Synthetic Vision Systems Market, consider subscribing to industry newsletters, following relevant companies and organizations, or regularly checking reputable industry news sources and publications.
Methodology
Step 1 - Identification of Relevant Samples Size from Population Database


Step 2 - Approaches for Defining Global Market Size (Value, Volume* & Price*)

Note*: In applicable scenarios
Step 3 - Data Sources
Primary Research
- Web Analytics
- Survey Reports
- Research Institute
- Latest Research Reports
- Opinion Leaders
Secondary Research
- Annual Reports
- White Paper
- Latest Press Release
- Industry Association
- Paid Database
- Investor Presentations

Step 4 - Data Triangulation
Involves using different sources of information in order to increase the validity of a study
These sources are likely to be stakeholders in a program - participants, other researchers, program staff, other community members, and so on.
Then we put all data in single framework & apply various statistical tools to find out the dynamic on the market.
During the analysis stage, feedback from the stakeholder groups would be compared to determine areas of agreement as well as areas of divergence