

Key Insights
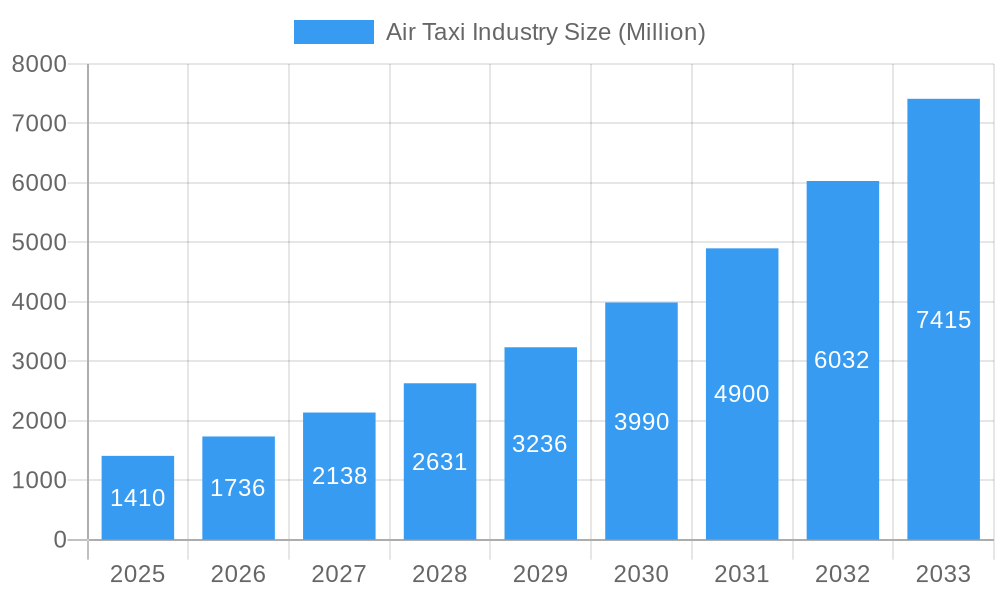
The air taxi industry is poised for explosive growth, projected to reach a market size of $1.41 billion in 2025 and exhibiting a remarkable Compound Annual Growth Rate (CAGR) of 23.32% from 2025 to 2033. This surge is driven by several key factors. Increasing urbanization and traffic congestion in major cities are creating a compelling need for faster, more efficient urban transportation alternatives. Simultaneously, advancements in electric vertical takeoff and landing (eVTOL) technology are making air taxis increasingly viable and cost-effective. Government initiatives promoting sustainable transportation and investments in related infrastructure further fuel this market expansion. The industry is segmented by mode of operation, with piloted and autonomous vehicles representing distinct market segments, each contributing to overall growth. The autonomous segment is expected to experience faster growth over the forecast period due to ongoing technological development and safety enhancements. However, regulatory hurdles related to airspace management, safety certification, and public acceptance represent significant challenges to widespread adoption. Competition among established aerospace giants like Boeing and Airbus, along with innovative startups such as Lilium and Joby Aero, is driving innovation and technological advancement, ultimately benefiting consumers and pushing the industry toward a more sustainable and efficient future.
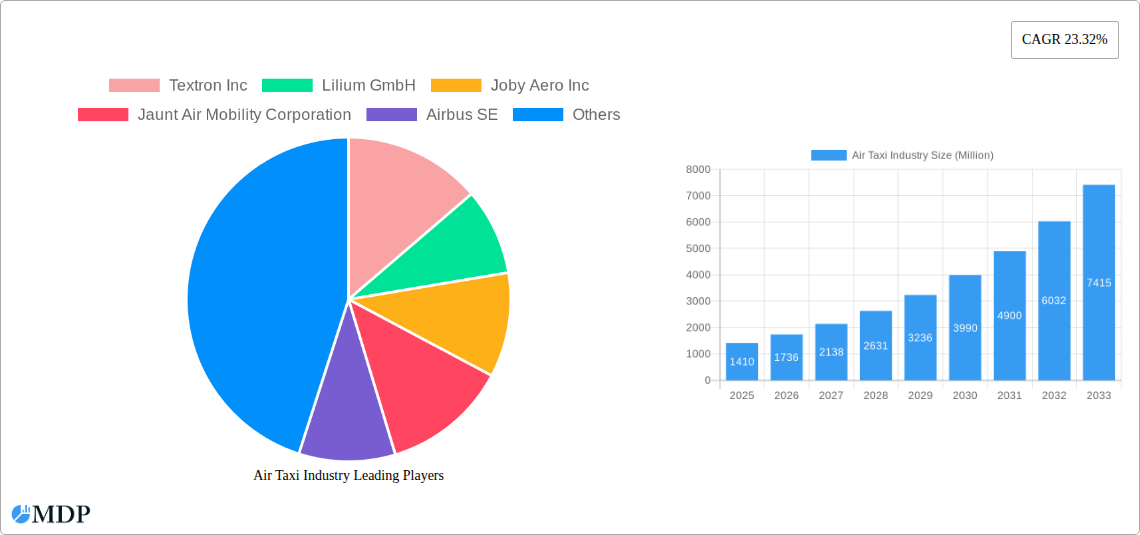
Air Taxi Industry Market Size (In Billion)
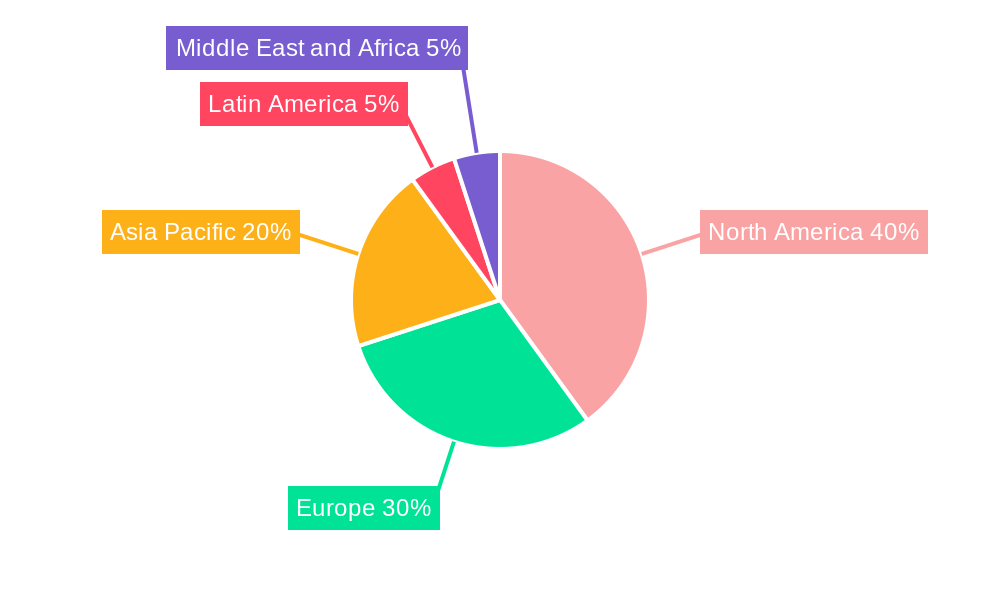
The geographical distribution of the air taxi market reflects the concentration of urban populations and early adopter regions. North America and Europe currently hold significant market shares, driven by substantial investments in infrastructure and relatively advanced regulatory frameworks. However, the Asia-Pacific region, particularly China and India, is expected to exhibit rapid growth in the coming years due to its massive population centers and increasing disposable income. While initial deployment might focus on high-income areas, future market expansion will depend on technological advancements that reduce costs, improve safety, and make air taxis accessible to a broader range of users. The potential for air taxis to alleviate urban congestion and reduce travel times makes this industry a focal point for both investors and urban planners, anticipating significant long-term growth despite the current challenges.
Air Taxi Industry Company Market Share
Unlocking the Skies: A Comprehensive Analysis of the Air Taxi Industry Market (2019-2033)
This in-depth report provides a comprehensive analysis of the burgeoning air taxi industry, projecting a market valued at $XX Million by 2033. Leveraging a robust data set spanning the historical period (2019-2024), base year (2025), and forecast period (2025-2033), this report offers actionable insights for industry stakeholders, investors, and strategists. The study meticulously examines market dynamics, technological advancements, leading players (including Textron Inc, Lilium GmbH, Joby Aero Inc, Jaunt Air Mobility Corporation, Airbus SE, Hyundai Motor Company, Volocopter GmbH, Wisk Aero LL, Guangzhou EHang Intelligent Technology Co Ltd, and The Boeing Company), and key growth opportunities within the rapidly evolving air taxi landscape. High-traffic keywords like "Air Taxi Market," "Autonomous Air Vehicles," "Urban Air Mobility," and "eVTOL" are strategically integrated to maximize search engine visibility.
Air Taxi Industry Market Dynamics & Concentration
The air taxi market, currently experiencing significant growth, is characterized by a dynamic interplay of factors impacting market concentration. While a few key players hold substantial market share, the industry remains relatively fragmented, with numerous startups and established aerospace companies vying for dominance. The market share held by the top five players is estimated at XX% in 2025, indicating significant room for consolidation and expansion. Innovation is a key driver, with continuous advancements in electric vertical takeoff and landing (eVTOL) technology and autonomous flight systems shaping the competitive landscape. Stringent regulatory frameworks, varying across different jurisdictions, present both challenges and opportunities, influencing market entry and operational strategies. The emergence of alternative transportation solutions like high-speed rail and improved road infrastructure constitutes a degree of product substitution. However, the unique speed and convenience offered by air taxis are expected to mitigate this challenge. End-user demand is shifting toward sustainable and efficient transportation, fueling the growth of electric air taxis. The industry has also witnessed a number of mergers and acquisitions (M&A) deals, estimated at XX deals in the period of 2019-2024, signifying consolidation efforts and strategic investments.
- Market Share: Top 5 players hold XX% in 2025 (estimated).
- M&A Activity: XX deals (2019-2024).
- Innovation Drivers: eVTOL technology, autonomous flight systems.
- Regulatory Frameworks: Varying significantly across regions.
- End-User Trends: Growing preference for sustainable and efficient transportation.
Air Taxi Industry Industry Trends & Analysis
The air taxi market is projected to experience significant growth, with a Compound Annual Growth Rate (CAGR) of XX% during the forecast period (2025-2033). This robust expansion is fueled by several key factors. Technological advancements, particularly in battery technology and autonomous flight capabilities, are lowering operational costs and increasing safety. Growing consumer preferences for faster, more convenient travel, especially in congested urban areas, are creating strong demand. The rise of urban air mobility (UAM) initiatives globally, backed by substantial government funding and infrastructure development, further accelerate market growth. However, the market's competitive landscape is intense, with established aerospace giants and innovative startups vying for market share. The penetration rate for air taxis in urban areas is expected to increase from XX% in 2025 to XX% by 2033. Market competition is likely to intensify as more players enter the market and existing players expand their operations geographically.
Leading Markets & Segments in Air Taxi Industry
The North American market currently holds the dominant position in the air taxi industry due to favorable regulatory environments, substantial investments, and a strong focus on technological innovation. Within the operational segments, the piloted air taxi segment holds the larger market share in 2025, followed by the autonomous segment which is experiencing rapid growth fueled by technological advancements.
Key Drivers for North American Dominance:
- Favorable Regulatory Environment: Relatively progressive regulations supporting UAM development.
- Significant Investments: High levels of private and public funding in the sector.
- Technological Innovation: Strong presence of leading air taxi companies and research institutions.
Dominance Analysis:
The dominance of the North American market is attributed to early adoption of eVTOL technology, favorable government policies, strong private investment, and the presence of major players like Joby Aero, and others. The autonomous segment is witnessing a surge in investment and development, driven by advances in AI and sensor technologies; however, regulatory hurdles and safety concerns are delaying its widespread adoption. It’s projected that autonomous air taxis will capture a larger market share by 2033.
Air Taxi Industry Product Developments
Recent years have witnessed significant advancements in air taxi technology, including the development of more efficient electric propulsion systems, enhanced safety features, and advanced autonomous flight capabilities. The focus is on improving range, payload capacity, and reducing noise pollution, enhancing the overall passenger experience. The market is witnessing the emergence of various air taxi models designed to cater to diverse needs, from short-haul urban commutes to longer-range regional travel. These developments are progressively improving the market fit and fostering greater consumer acceptance.
Key Drivers of Air Taxi Industry Growth
The air taxi industry's rapid growth is primarily driven by technological innovations such as improved battery technology, increasing autonomous flight capabilities and advancements in electric vertical takeoff and landing (eVTOL) aircraft designs. Furthermore, supportive government policies and initiatives promoting urban air mobility (UAM) are creating a favorable regulatory environment. Finally, growing urbanization and increasing congestion in major cities are creating a strong market need for faster and more efficient transportation alternatives.
Challenges in the Air Taxi Industry Market
The air taxi industry faces several critical challenges, including the stringent regulatory hurdles surrounding certification and operations, particularly for autonomous flights. Supply chain complexities in procuring specialized components and securing skilled labor add to operational difficulties. The intense competition from existing transportation modes and from other air taxi companies exerts considerable competitive pressure, potentially impacting profitability. These factors collectively can constrain the industry's growth trajectory and profitability unless effectively addressed.
Emerging Opportunities in Air Taxi Industry
The air taxi market presents exciting long-term growth opportunities. Technological breakthroughs in battery technology and autonomous flight systems promise to significantly enhance operational efficiency and safety. Strategic partnerships between air taxi companies, infrastructure providers, and urban planning authorities are essential to establish seamless integration within existing transportation networks. Expansion into new markets with high population density and limited ground transportation infrastructure creates significant market expansion potential.
Leading Players in the Air Taxi Industry Sector
- Textron Inc
- Lilium GmbH
- Joby Aero Inc
- Jaunt Air Mobility Corporation
- Airbus SE
- Hyundai Motor Company
- Volocopter GmbH
- Wisk Aero LL
- Guangzhou EHang Intelligent Technology Co Ltd
- The Boeing Company
Key Milestones in Air Taxi Industry Industry
- 2022: Several companies commenced test flights of their eVTOL aircraft.
- 2023: Joby Aero receives FAA's G-1 certification.
- 2024: Several partnerships announced between air taxi operators and urban infrastructure developers.
- 2025 (Projected): First commercial operations of piloted air taxis in select urban areas.
Strategic Outlook for Air Taxi Industry Market
The air taxi industry is poised for significant expansion. Continued technological innovation, coupled with supportive regulatory frameworks and strategic collaborations, will drive market growth. The potential to reshape urban mobility, offering faster, more efficient travel options, presents substantial long-term market potential and lucrative strategic opportunities for both existing players and new entrants.
Air Taxi Industry Segmentation
-
1. Mode of Operation
- 1.1. Piloted
- 1.2. Autonomous
Air Taxi Industry Segmentation By Geography
-
1. North America
- 1.1. United States
- 1.2. Canada
-
2. Europe
- 2.1. Germany
- 2.2. United Kingdom
- 2.3. France
- 2.4. Russia
- 2.5. Rest of Europe
-
3. Asia Pacific
- 3.1. India
- 3.2. China
- 3.3. Japan
- 3.4. South Korea
- 3.5. Australia
- 3.6. Rest of Asia Pacific
-
4. Latin America
- 4.1. Brazil
- 4.2. Mexico
- 4.3. Rest of Latin America
-
5. Middle East and Africa
- 5.1. Saudi Arabia
- 5.2. Egypt
- 5.3. Israel
- 5.4. Rest of Middle East and Africa
Air Taxi Industry Regional Market Share
Geographic Coverage of Air Taxi Industry
Air Taxi Industry REPORT HIGHLIGHTS
| Aspects | Details |
|---|---|
| Study Period | 2020-2034 |
| Base Year | 2025 |
| Estimated Year | 2026 |
| Forecast Period | 2026-2034 |
| Historical Period | 2020-2025 |
| Growth Rate | CAGR of 23.32% from 2020-2034 |
| Segmentation |
|
Table of Contents
- 1. Introduction
- 1.1. Research Scope
- 1.2. Market Segmentation
- 1.3. Research Objective
- 1.4. Definitions and Assumptions
- 2. Executive Summary
- 2.1. Market Snapshot
- 3. Market Dynamics
- 3.1. Market Drivers
- 3.2. Market Restrains
- 3.3. Market Trends
- 3.4. Market Opportunities
- 4. Market Factor Analysis
- 4.1. Porters Five Forces
- 4.1.1. Bargaining Power of Suppliers
- 4.1.2. Bargaining Power of Buyers
- 4.1.3. Threat of New Entrants
- 4.1.4. Threat of Substitutes
- 4.1.5. Competitive Rivalry
- 4.2. PESTEL analysis
- 4.3. BCG Analysis
- 4.3.1. Stars (High Growth, High Market Share)
- 4.3.2. Cash Cows (Low Growth, High Market Share)
- 4.3.3. Question Mark (High Growth, Low Market Share)
- 4.3.4. Dogs (Low Growth, Low Market Share)
- 4.4. Ansoff Matrix Analysis
- 4.5. Supply Chain Analysis
- 4.6. Regulatory Landscape
- 4.7. Current Market Potential and Opportunity Assessment (TAM–SAM–SOM Framework)
- 4.8. MDP Analyst Note
- 4.1. Porters Five Forces
- 5. Market Analysis, Insights and Forecast 2021-2033
- 5.1. Market Analysis, Insights and Forecast - by Mode of Operation
- 5.1.1. Piloted
- 5.1.2. Autonomous
- 5.2. Market Analysis, Insights and Forecast - by Region
- 5.2.1. North America
- 5.2.2. Europe
- 5.2.3. Asia Pacific
- 5.2.4. Latin America
- 5.2.5. Middle East and Africa
- 5.1. Market Analysis, Insights and Forecast - by Mode of Operation
- 6. Global Air Taxi Industry Analysis, Insights and Forecast, 2021-2033
- 6.1. Market Analysis, Insights and Forecast - by Mode of Operation
- 6.1.1. Piloted
- 6.1.2. Autonomous
- 6.1. Market Analysis, Insights and Forecast - by Mode of Operation
- 7. North America Air Taxi Industry Analysis, Insights and Forecast, 2020-2032
- 7.1. Market Analysis, Insights and Forecast - by Mode of Operation
- 7.1.1. Piloted
- 7.1.2. Autonomous
- 7.1. Market Analysis, Insights and Forecast - by Mode of Operation
- 8. Europe Air Taxi Industry Analysis, Insights and Forecast, 2020-2032
- 8.1. Market Analysis, Insights and Forecast - by Mode of Operation
- 8.1.1. Piloted
- 8.1.2. Autonomous
- 8.1. Market Analysis, Insights and Forecast - by Mode of Operation
- 9. Asia Pacific Air Taxi Industry Analysis, Insights and Forecast, 2020-2032
- 9.1. Market Analysis, Insights and Forecast - by Mode of Operation
- 9.1.1. Piloted
- 9.1.2. Autonomous
- 9.1. Market Analysis, Insights and Forecast - by Mode of Operation
- 10. Latin America Air Taxi Industry Analysis, Insights and Forecast, 2020-2032
- 10.1. Market Analysis, Insights and Forecast - by Mode of Operation
- 10.1.1. Piloted
- 10.1.2. Autonomous
- 10.1. Market Analysis, Insights and Forecast - by Mode of Operation
- 11. Middle East and Africa Air Taxi Industry Analysis, Insights and Forecast, 2020-2032
- 11.1. Market Analysis, Insights and Forecast - by Mode of Operation
- 11.1.1. Piloted
- 11.1.2. Autonomous
- 11.1. Market Analysis, Insights and Forecast - by Mode of Operation
- 12. Competitive Analysis
- 12.1. Company Profiles
- 12.1.1 Textron Inc
- 12.1.1.1. Company Overview
- 12.1.1.2. Products
- 12.1.1.3. Company Financials
- 12.1.1.4. SWOT Analysis
- 12.1.2 Lilium GmbH
- 12.1.2.1. Company Overview
- 12.1.2.2. Products
- 12.1.2.3. Company Financials
- 12.1.2.4. SWOT Analysis
- 12.1.3 Joby Aero Inc
- 12.1.3.1. Company Overview
- 12.1.3.2. Products
- 12.1.3.3. Company Financials
- 12.1.3.4. SWOT Analysis
- 12.1.4 Jaunt Air Mobility Corporation
- 12.1.4.1. Company Overview
- 12.1.4.2. Products
- 12.1.4.3. Company Financials
- 12.1.4.4. SWOT Analysis
- 12.1.5 Airbus SE
- 12.1.5.1. Company Overview
- 12.1.5.2. Products
- 12.1.5.3. Company Financials
- 12.1.5.4. SWOT Analysis
- 12.1.6 Hyundai Motor Company
- 12.1.6.1. Company Overview
- 12.1.6.2. Products
- 12.1.6.3. Company Financials
- 12.1.6.4. SWOT Analysis
- 12.1.7 Volocopter GmbH
- 12.1.7.1. Company Overview
- 12.1.7.2. Products
- 12.1.7.3. Company Financials
- 12.1.7.4. SWOT Analysis
- 12.1.8 Wisk Aero LL
- 12.1.8.1. Company Overview
- 12.1.8.2. Products
- 12.1.8.3. Company Financials
- 12.1.8.4. SWOT Analysis
- 12.1.9 Guangzhou EHang Intelligent Technology Co Ltd
- 12.1.9.1. Company Overview
- 12.1.9.2. Products
- 12.1.9.3. Company Financials
- 12.1.9.4. SWOT Analysis
- 12.1.10 The Boeing Company
- 12.1.10.1. Company Overview
- 12.1.10.2. Products
- 12.1.10.3. Company Financials
- 12.1.10.4. SWOT Analysis
- 12.1.1 Textron Inc
- 12.2. Market Entropy
- 12.2.1 Company's Key Areas Served
- 12.2.2 Recent Developments
- 12.3. Company Market Share Analysis 2025
- 12.3.1 Top 5 Companies Market Share Analysis
- 12.3.2 Top 3 Companies Market Share Analysis
- 12.4. List of Potential Customers
- 13. Research Methodology
List of Figures
- Figure 1: Global Air Taxi Industry Revenue Breakdown (Million, %) by Region 2025 & 2033
- Figure 2: North America Air Taxi Industry Revenue (Million), by Mode of Operation 2025 & 2033
- Figure 3: North America Air Taxi Industry Revenue Share (%), by Mode of Operation 2025 & 2033
- Figure 4: North America Air Taxi Industry Revenue (Million), by Country 2025 & 2033
- Figure 5: North America Air Taxi Industry Revenue Share (%), by Country 2025 & 2033
- Figure 6: Europe Air Taxi Industry Revenue (Million), by Mode of Operation 2025 & 2033
- Figure 7: Europe Air Taxi Industry Revenue Share (%), by Mode of Operation 2025 & 2033
- Figure 8: Europe Air Taxi Industry Revenue (Million), by Country 2025 & 2033
- Figure 9: Europe Air Taxi Industry Revenue Share (%), by Country 2025 & 2033
- Figure 10: Asia Pacific Air Taxi Industry Revenue (Million), by Mode of Operation 2025 & 2033
- Figure 11: Asia Pacific Air Taxi Industry Revenue Share (%), by Mode of Operation 2025 & 2033
- Figure 12: Asia Pacific Air Taxi Industry Revenue (Million), by Country 2025 & 2033
- Figure 13: Asia Pacific Air Taxi Industry Revenue Share (%), by Country 2025 & 2033
- Figure 14: Latin America Air Taxi Industry Revenue (Million), by Mode of Operation 2025 & 2033
- Figure 15: Latin America Air Taxi Industry Revenue Share (%), by Mode of Operation 2025 & 2033
- Figure 16: Latin America Air Taxi Industry Revenue (Million), by Country 2025 & 2033
- Figure 17: Latin America Air Taxi Industry Revenue Share (%), by Country 2025 & 2033
- Figure 18: Middle East and Africa Air Taxi Industry Revenue (Million), by Mode of Operation 2025 & 2033
- Figure 19: Middle East and Africa Air Taxi Industry Revenue Share (%), by Mode of Operation 2025 & 2033
- Figure 20: Middle East and Africa Air Taxi Industry Revenue (Million), by Country 2025 & 2033
- Figure 21: Middle East and Africa Air Taxi Industry Revenue Share (%), by Country 2025 & 2033
List of Tables
- Table 1: Global Air Taxi Industry Revenue Million Forecast, by Mode of Operation 2020 & 2033
- Table 2: Global Air Taxi Industry Revenue Million Forecast, by Region 2020 & 2033
- Table 3: Global Air Taxi Industry Revenue Million Forecast, by Mode of Operation 2020 & 2033
- Table 4: Global Air Taxi Industry Revenue Million Forecast, by Country 2020 & 2033
- Table 5: United States Air Taxi Industry Revenue (Million) Forecast, by Application 2020 & 2033
- Table 6: Canada Air Taxi Industry Revenue (Million) Forecast, by Application 2020 & 2033
- Table 7: Global Air Taxi Industry Revenue Million Forecast, by Mode of Operation 2020 & 2033
- Table 8: Global Air Taxi Industry Revenue Million Forecast, by Country 2020 & 2033
- Table 9: Germany Air Taxi Industry Revenue (Million) Forecast, by Application 2020 & 2033
- Table 10: United Kingdom Air Taxi Industry Revenue (Million) Forecast, by Application 2020 & 2033
- Table 11: France Air Taxi Industry Revenue (Million) Forecast, by Application 2020 & 2033
- Table 12: Russia Air Taxi Industry Revenue (Million) Forecast, by Application 2020 & 2033
- Table 13: Rest of Europe Air Taxi Industry Revenue (Million) Forecast, by Application 2020 & 2033
- Table 14: Global Air Taxi Industry Revenue Million Forecast, by Mode of Operation 2020 & 2033
- Table 15: Global Air Taxi Industry Revenue Million Forecast, by Country 2020 & 2033
- Table 16: India Air Taxi Industry Revenue (Million) Forecast, by Application 2020 & 2033
- Table 17: China Air Taxi Industry Revenue (Million) Forecast, by Application 2020 & 2033
- Table 18: Japan Air Taxi Industry Revenue (Million) Forecast, by Application 2020 & 2033
- Table 19: South Korea Air Taxi Industry Revenue (Million) Forecast, by Application 2020 & 2033
- Table 20: Australia Air Taxi Industry Revenue (Million) Forecast, by Application 2020 & 2033
- Table 21: Rest of Asia Pacific Air Taxi Industry Revenue (Million) Forecast, by Application 2020 & 2033
- Table 22: Global Air Taxi Industry Revenue Million Forecast, by Mode of Operation 2020 & 2033
- Table 23: Global Air Taxi Industry Revenue Million Forecast, by Country 2020 & 2033
- Table 24: Brazil Air Taxi Industry Revenue (Million) Forecast, by Application 2020 & 2033
- Table 25: Mexico Air Taxi Industry Revenue (Million) Forecast, by Application 2020 & 2033
- Table 26: Rest of Latin America Air Taxi Industry Revenue (Million) Forecast, by Application 2020 & 2033
- Table 27: Global Air Taxi Industry Revenue Million Forecast, by Mode of Operation 2020 & 2033
- Table 28: Global Air Taxi Industry Revenue Million Forecast, by Country 2020 & 2033
- Table 29: Saudi Arabia Air Taxi Industry Revenue (Million) Forecast, by Application 2020 & 2033
- Table 30: Egypt Air Taxi Industry Revenue (Million) Forecast, by Application 2020 & 2033
- Table 31: Israel Air Taxi Industry Revenue (Million) Forecast, by Application 2020 & 2033
- Table 32: Rest of Middle East and Africa Air Taxi Industry Revenue (Million) Forecast, by Application 2020 & 2033
Frequently Asked Questions
1. What is the projected Compound Annual Growth Rate (CAGR) of the Air Taxi Industry?
The projected CAGR is approximately 23.32%.
2. Which companies are prominent players in the Air Taxi Industry?
Key companies in the market include Textron Inc, Lilium GmbH, Joby Aero Inc, Jaunt Air Mobility Corporation, Airbus SE, Hyundai Motor Company, Volocopter GmbH, Wisk Aero LL, Guangzhou EHang Intelligent Technology Co Ltd, The Boeing Company.
3. What are the main segments of the Air Taxi Industry?
The market segments include Mode of Operation.
4. Can you provide details about the market size?
The market size is estimated to be USD 1.41 Million as of 2022.
5. What are some drivers contributing to market growth?
N/A
6. What are the notable trends driving market growth?
Piloted Segment to Dominate Market Share During the Forecast Period.
7. Are there any restraints impacting market growth?
N/A
8. Can you provide examples of recent developments in the market?
N/A
9. What pricing options are available for accessing the report?
Pricing options include single-user, multi-user, and enterprise licenses priced at USD 4750, USD 5250, and USD 8750 respectively.
10. Is the market size provided in terms of value or volume?
The market size is provided in terms of value, measured in Million.
11. Are there any specific market keywords associated with the report?
Yes, the market keyword associated with the report is "Air Taxi Industry," which aids in identifying and referencing the specific market segment covered.
12. How do I determine which pricing option suits my needs best?
The pricing options vary based on user requirements and access needs. Individual users may opt for single-user licenses, while businesses requiring broader access may choose multi-user or enterprise licenses for cost-effective access to the report.
13. Are there any additional resources or data provided in the Air Taxi Industry report?
While the report offers comprehensive insights, it's advisable to review the specific contents or supplementary materials provided to ascertain if additional resources or data are available.
14. How can I stay updated on further developments or reports in the Air Taxi Industry?
To stay informed about further developments, trends, and reports in the Air Taxi Industry, consider subscribing to industry newsletters, following relevant companies and organizations, or regularly checking reputable industry news sources and publications.
Methodology
Step 1 - Identification of Relevant Samples Size from Population Database


Step 2 - Approaches for Defining Global Market Size (Value, Volume* & Price*)

Note*: In applicable scenarios
Step 3 - Data Sources
Primary Research
- Web Analytics
- Survey Reports
- Research Institute
- Latest Research Reports
- Opinion Leaders
Secondary Research
- Annual Reports
- White Paper
- Latest Press Release
- Industry Association
- Paid Database
- Investor Presentations

Step 4 - Data Triangulation
Involves using different sources of information in order to increase the validity of a study
These sources are likely to be stakeholders in a program - participants, other researchers, program staff, other community members, and so on.
Then we put all data in single framework & apply various statistical tools to find out the dynamic on the market.
During the analysis stage, feedback from the stakeholder groups would be compared to determine areas of agreement as well as areas of divergence