

Key Insights
The 6-inch silicon carbide (SiC) wafer market is experiencing robust growth, driven by the increasing demand for high-power, high-frequency applications across various sectors. The automotive industry's shift towards electric vehicles (EVs) is a significant catalyst, demanding efficient power electronics that SiC wafers excel at providing. Furthermore, the expansion of renewable energy infrastructure, including solar inverters and wind turbines, is fueling the need for SiC-based power converters capable of handling high voltages and currents. The rising adoption of 5G and other advanced wireless technologies also contributes to market expansion, as SiC wafers enable the development of more efficient and compact wireless infrastructure components. While supply chain constraints and the relatively high cost of SiC wafers compared to traditional silicon remain challenges, ongoing technological advancements and economies of scale are mitigating these factors. The market is segmented by application (power devices, electronics & optoelectronics, wireless infrastructure, others) and wafer type (conductive and semi-insulating). Conductive SiC wafers currently hold a larger market share due to their widespread use in power electronics, but semi-insulating wafers are gaining traction in niche applications where high-voltage isolation is critical. Geographic growth is strongest in Asia Pacific, particularly China and Japan, driven by significant investments in semiconductor manufacturing and robust demand from the electronics and automotive industries. North America maintains a substantial presence due to strong technological innovation and established manufacturing capacity.
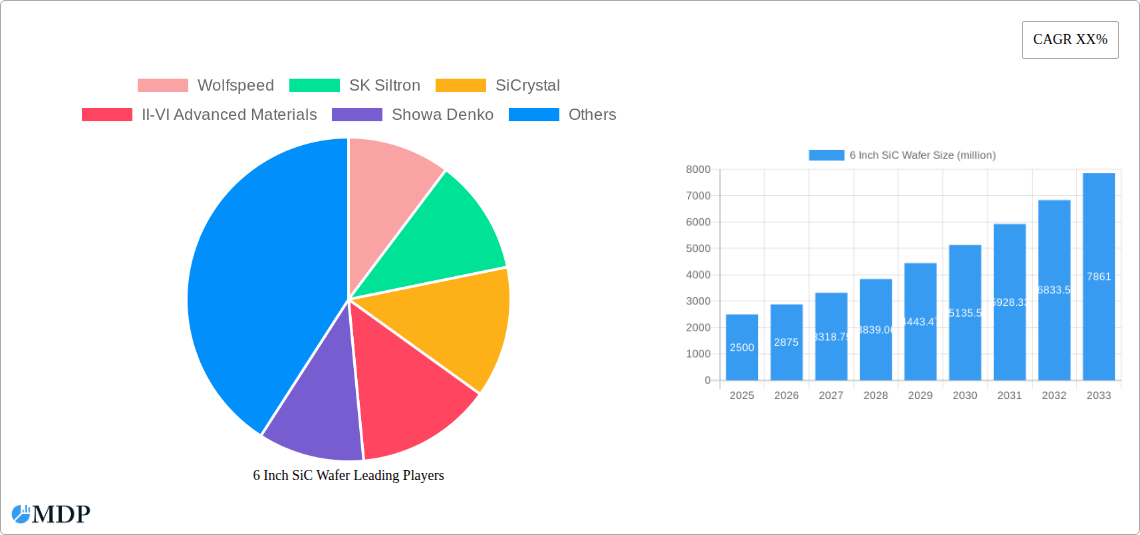
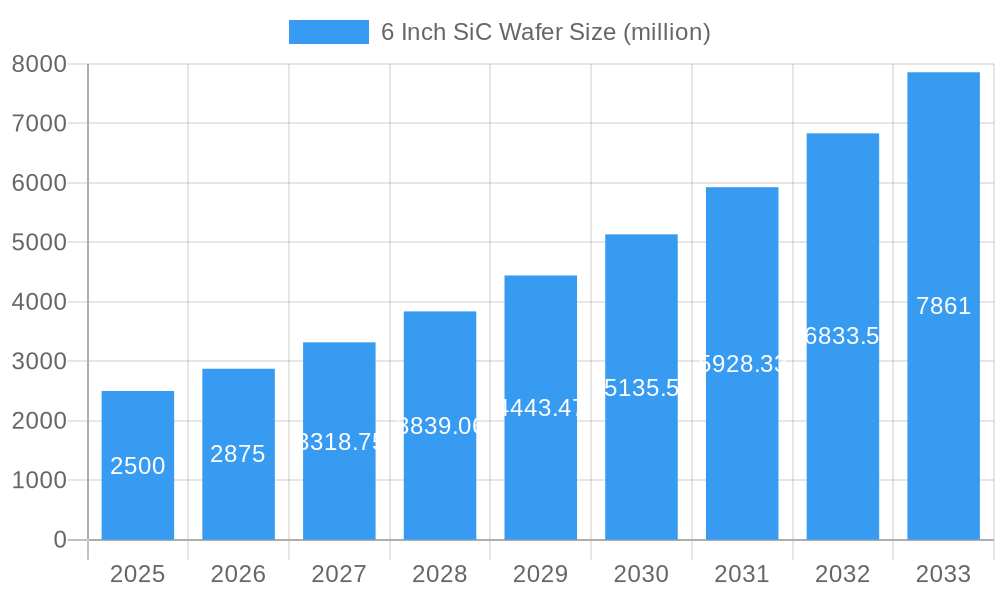
6 Inch SiC Wafer Market Size (In Billion)
The forecast period (2025-2033) projects continued expansion, propelled by ongoing technological improvements resulting in higher wafer yields and reduced manufacturing costs. Increased government support for SiC research and development globally further accelerates market growth. Competitive landscape analysis reveals key players including Wolfspeed, SK Siltron, SiCrystal, II-VI Advanced Materials, Showa Denko, and others, constantly vying for market share through capacity expansion, strategic partnerships, and product innovation. Emerging applications in areas such as aerospace and defense further diversify the market and add to its long-term potential. Future market growth will be shaped by factors including advancements in SiC wafer fabrication techniques, the development of larger diameter wafers, and the continued integration of SiC technology in new and existing applications. The overall market trajectory indicates significant potential for substantial growth within the next decade.
6 Inch SiC Wafer Company Market Share
Unlock the Potential of the 6 Inch SiC Wafer Market: A Comprehensive Market Report (2019-2033)
This in-depth report provides a comprehensive analysis of the 6-inch Silicon Carbide (SiC) wafer market, offering invaluable insights for industry stakeholders. From market dynamics and leading players to emerging opportunities and future growth projections, this report is your essential guide to navigating this rapidly evolving sector. The study period spans 2019-2033, with a base year of 2025 and a forecast period of 2025-2033. This report is crucial for understanding the xx million USD market and its anticipated growth trajectory.
6 Inch SiC Wafer Market Dynamics & Concentration
This section analyzes the competitive landscape of the 6-inch SiC wafer market, examining market concentration, innovation, regulatory influences, and market trends. We delve into the impact of mergers and acquisitions (M&A) activities, providing a detailed overview of market share distribution among key players.
Market Concentration: The market exhibits a moderately concentrated structure, with a few major players holding significant market share. Wolfspeed and SK Siltron are currently projected to hold the largest shares, with xx% and xx%, respectively, in 2025. This concentration is expected to shift slightly over the forecast period with increasing competition from new entrants.
Innovation Drivers: Continuous advancements in SiC wafer technology, driven by demand for higher power efficiency and improved performance, are major catalysts for market growth. This includes improvements in crystal growth techniques and reducing defects.
Regulatory Frameworks: Government initiatives promoting the adoption of energy-efficient technologies are creating favorable conditions for SiC wafer market expansion. However, stringent environmental regulations related to manufacturing processes present challenges.
Product Substitutes: While SiC wafers offer superior performance compared to other semiconductor materials, the presence of alternative materials like GaN and GaAs creates competitive pressure.
End-User Trends: The increasing demand for electric vehicles (EVs), renewable energy infrastructure, and 5G wireless communication systems is fueling the adoption of SiC wafers.
M&A Activities: The number of M&A deals in the SiC wafer sector is expected to increase in the coming years, driven by companies seeking to consolidate their market position and expand their product portfolios. The estimated number of M&A deals from 2019-2024 was xx, with a projected increase to xx during the forecast period.
6 Inch SiC Wafer Industry Trends & Analysis
This section explores the key trends shaping the 6-inch SiC wafer market. We analyze market growth drivers, technological disruptions, and competitive dynamics, providing a detailed understanding of market behavior.
The 6-inch SiC wafer market is witnessing robust growth, driven by several key factors. The rising adoption of SiC in power electronics applications, particularly in EVs and renewable energy systems, is a primary driver. The CAGR from 2025 to 2033 is estimated to be xx%, indicating significant market expansion. Increased market penetration in emerging markets and technological advancements are further propelling growth. However, the market also faces challenges such as high production costs and limited availability of high-quality SiC substrates. The competitive landscape is dynamic, with existing players investing heavily in R&D and new entrants emerging with innovative technologies.
Leading Markets & Segments in 6 Inch SiC Wafer
This section identifies the dominant regions, countries, and segments within the 6-inch SiC wafer market. The analysis includes factors driving market dominance.
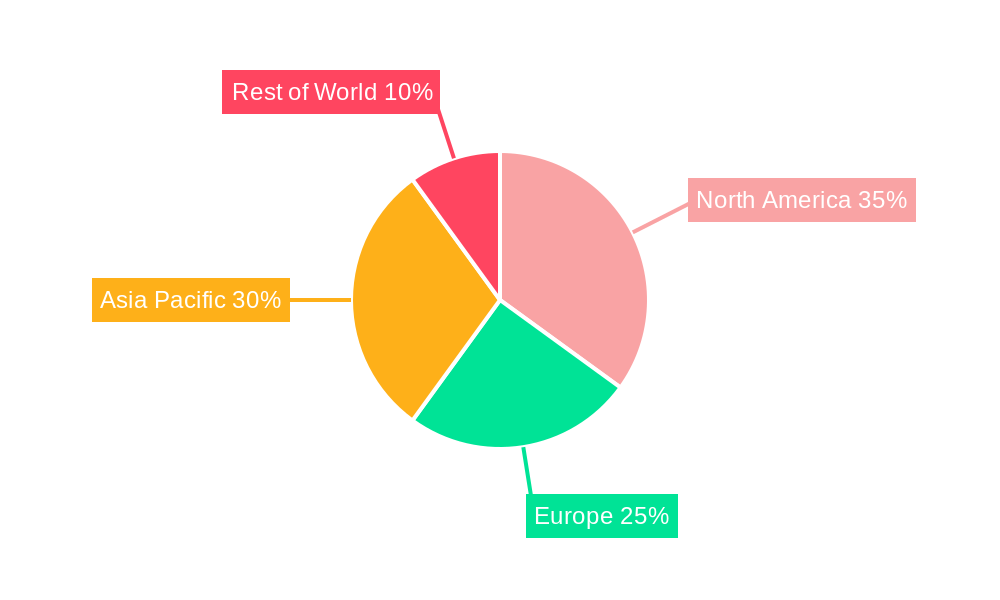
Dominant Regions/Countries: Currently, North America and Asia (particularly China) are the leading regions for 6-inch SiC wafer consumption. This dominance is primarily driven by substantial investments in renewable energy infrastructure and automotive industries in these regions.
Dominant Application Segments:
- Power Devices: This segment dominates the market, driven by the increasing demand for EVs, solar inverters, and high-power chargers. The key growth drivers include stringent fuel efficiency standards and rising EV adoption.
- Electronics & Optoelectronics: Growing demand for high-performance electronics in consumer devices and industrial applications is pushing this segment's growth.
- Wireless Infrastructure: The deployment of 5G networks is a significant driver for this segment, as SiC-based power amplifiers and radio frequency components offer performance advantages.
- Others: This segment includes various niche applications, with growth potential in areas like aerospace and defense.
Dominant Type Segments:
- Conductive SiC Wafer: This type holds a larger market share compared to semi-insulating SiC wafers, primarily due to its wider range of applications.
- Semi-Insulating SiC Wafer: The use of semi-insulating SiC wafers is steadily increasing due to its advantages in high-power applications, which requires further advancements in technology.
6 Inch SiC Wafer Product Developments
Recent product innovations have focused on enhancing the quality, performance, and cost-effectiveness of 6-inch SiC wafers. Manufacturers are constantly striving to improve crystal growth techniques to minimize defects and enhance wafer uniformity. This includes advancements in epitaxial growth processes, enabling the production of high-quality SiC wafers with improved electrical characteristics. These improvements directly translate into higher efficiency and reliability in end applications.
Key Drivers of 6 Inch SiC Wafer Growth
Several factors are driving the growth of the 6-inch SiC wafer market:
- Technological advancements: Continuous improvements in SiC material quality and processing techniques are expanding applications.
- Government support: Government policies promoting renewable energy and electric vehicle adoption create a favorable environment.
- Economic growth: The expanding global economy, especially in developing nations, increases demand for energy-efficient technologies.
Challenges in the 6 Inch SiC Wafer Market
Despite its growth potential, the 6-inch SiC wafer market faces several challenges:
- High production costs: The manufacturing process of SiC wafers is complex and expensive, impacting market accessibility.
- Supply chain constraints: Limited availability of high-quality raw materials and specialized equipment can hinder production.
- Competition from other materials: Alternative semiconductors like GaN pose significant competitive pressure.
Emerging Opportunities in 6 Inch SiC Wafer
The future of the 6-inch SiC wafer market holds significant promise. Technological breakthroughs in material science and processing methods are expected to improve production efficiency and lower costs. Strategic partnerships between material suppliers, device manufacturers, and end-users will facilitate market expansion. Moreover, exploring new applications in emerging sectors like aerospace and space technology presents further opportunities.
Leading Players in the 6 Inch SiC Wafer Sector
- Wolfspeed
- SK Siltron
- SiCrystal
- II-VI Advanced Materials
- Showa Denko
- Norstel
- TankeBlue
- SICC
- Hebei Synlight Crystal
- CETC
Key Milestones in 6 Inch SiC Wafer Industry
- 2020: Significant investment in SiC wafer production capacity by several key players.
- 2022: Introduction of new technologies improving SiC wafer quality and yield.
- 2023: Several partnerships formed between SiC wafer manufacturers and EV companies.
Strategic Outlook for 6 Inch SiC Wafer Market
The 6-inch SiC wafer market is poised for substantial growth, driven by technological advancements, increasing demand from key applications, and supportive government policies. Strategic partnerships and investments in R&D will further accelerate market expansion, presenting lucrative opportunities for industry players. The focus on improving production efficiency and reducing costs will be essential to realizing the full market potential.
6 Inch SiC Wafer Segmentation
-
1. Application
- 1.1. Power Device
- 1.2. Electronics & Optoelectronics
- 1.3. Wireless Infrastructure
- 1.4. Others
-
2. Types
- 2.1. Conductive SiC Wafer
- 2.2. Semi-Insulating SiC Wafer
6 Inch SiC Wafer Segmentation By Geography
-
1. North America
- 1.1. United States
- 1.2. Canada
- 1.3. Mexico
-
2. South America
- 2.1. Brazil
- 2.2. Argentina
- 2.3. Rest of South America
-
3. Europe
- 3.1. United Kingdom
- 3.2. Germany
- 3.3. France
- 3.4. Italy
- 3.5. Spain
- 3.6. Russia
- 3.7. Benelux
- 3.8. Nordics
- 3.9. Rest of Europe
-
4. Middle East & Africa
- 4.1. Turkey
- 4.2. Israel
- 4.3. GCC
- 4.4. North Africa
- 4.5. South Africa
- 4.6. Rest of Middle East & Africa
-
5. Asia Pacific
- 5.1. China
- 5.2. India
- 5.3. Japan
- 5.4. South Korea
- 5.5. ASEAN
- 5.6. Oceania
- 5.7. Rest of Asia Pacific
6 Inch SiC Wafer Regional Market Share
Geographic Coverage of 6 Inch SiC Wafer
6 Inch SiC Wafer REPORT HIGHLIGHTS
| Aspects | Details |
|---|---|
| Study Period | 2020-2034 |
| Base Year | 2025 |
| Estimated Year | 2026 |
| Forecast Period | 2026-2034 |
| Historical Period | 2020-2025 |
| Growth Rate | CAGR of XX% from 2020-2034 |
| Segmentation |
|
Table of Contents
- 1. Introduction
- 1.1. Research Scope
- 1.2. Market Segmentation
- 1.3. Research Methodology
- 1.4. Definitions and Assumptions
- 2. Executive Summary
- 2.1. Introduction
- 3. Market Dynamics
- 3.1. Introduction
- 3.2. Market Drivers
- 3.3. Market Restrains
- 3.4. Market Trends
- 4. Market Factor Analysis
- 4.1. Porters Five Forces
- 4.2. Supply/Value Chain
- 4.3. PESTEL analysis
- 4.4. Market Entropy
- 4.5. Patent/Trademark Analysis
- 5. Global 6 Inch SiC Wafer Analysis, Insights and Forecast, 2020-2032
- 5.1. Market Analysis, Insights and Forecast - by Application
- 5.1.1. Power Device
- 5.1.2. Electronics & Optoelectronics
- 5.1.3. Wireless Infrastructure
- 5.1.4. Others
- 5.2. Market Analysis, Insights and Forecast - by Types
- 5.2.1. Conductive SiC Wafer
- 5.2.2. Semi-Insulating SiC Wafer
- 5.3. Market Analysis, Insights and Forecast - by Region
- 5.3.1. North America
- 5.3.2. South America
- 5.3.3. Europe
- 5.3.4. Middle East & Africa
- 5.3.5. Asia Pacific
- 5.1. Market Analysis, Insights and Forecast - by Application
- 6. North America 6 Inch SiC Wafer Analysis, Insights and Forecast, 2020-2032
- 6.1. Market Analysis, Insights and Forecast - by Application
- 6.1.1. Power Device
- 6.1.2. Electronics & Optoelectronics
- 6.1.3. Wireless Infrastructure
- 6.1.4. Others
- 6.2. Market Analysis, Insights and Forecast - by Types
- 6.2.1. Conductive SiC Wafer
- 6.2.2. Semi-Insulating SiC Wafer
- 6.1. Market Analysis, Insights and Forecast - by Application
- 7. South America 6 Inch SiC Wafer Analysis, Insights and Forecast, 2020-2032
- 7.1. Market Analysis, Insights and Forecast - by Application
- 7.1.1. Power Device
- 7.1.2. Electronics & Optoelectronics
- 7.1.3. Wireless Infrastructure
- 7.1.4. Others
- 7.2. Market Analysis, Insights and Forecast - by Types
- 7.2.1. Conductive SiC Wafer
- 7.2.2. Semi-Insulating SiC Wafer
- 7.1. Market Analysis, Insights and Forecast - by Application
- 8. Europe 6 Inch SiC Wafer Analysis, Insights and Forecast, 2020-2032
- 8.1. Market Analysis, Insights and Forecast - by Application
- 8.1.1. Power Device
- 8.1.2. Electronics & Optoelectronics
- 8.1.3. Wireless Infrastructure
- 8.1.4. Others
- 8.2. Market Analysis, Insights and Forecast - by Types
- 8.2.1. Conductive SiC Wafer
- 8.2.2. Semi-Insulating SiC Wafer
- 8.1. Market Analysis, Insights and Forecast - by Application
- 9. Middle East & Africa 6 Inch SiC Wafer Analysis, Insights and Forecast, 2020-2032
- 9.1. Market Analysis, Insights and Forecast - by Application
- 9.1.1. Power Device
- 9.1.2. Electronics & Optoelectronics
- 9.1.3. Wireless Infrastructure
- 9.1.4. Others
- 9.2. Market Analysis, Insights and Forecast - by Types
- 9.2.1. Conductive SiC Wafer
- 9.2.2. Semi-Insulating SiC Wafer
- 9.1. Market Analysis, Insights and Forecast - by Application
- 10. Asia Pacific 6 Inch SiC Wafer Analysis, Insights and Forecast, 2020-2032
- 10.1. Market Analysis, Insights and Forecast - by Application
- 10.1.1. Power Device
- 10.1.2. Electronics & Optoelectronics
- 10.1.3. Wireless Infrastructure
- 10.1.4. Others
- 10.2. Market Analysis, Insights and Forecast - by Types
- 10.2.1. Conductive SiC Wafer
- 10.2.2. Semi-Insulating SiC Wafer
- 10.1. Market Analysis, Insights and Forecast - by Application
- 11. Competitive Analysis
- 11.1. Global Market Share Analysis 2025
- 11.2. Company Profiles
- 11.2.1 Wolfspeed
- 11.2.1.1. Overview
- 11.2.1.2. Products
- 11.2.1.3. SWOT Analysis
- 11.2.1.4. Recent Developments
- 11.2.1.5. Financials (Based on Availability)
- 11.2.2 SK Siltron
- 11.2.2.1. Overview
- 11.2.2.2. Products
- 11.2.2.3. SWOT Analysis
- 11.2.2.4. Recent Developments
- 11.2.2.5. Financials (Based on Availability)
- 11.2.3 SiCrystal
- 11.2.3.1. Overview
- 11.2.3.2. Products
- 11.2.3.3. SWOT Analysis
- 11.2.3.4. Recent Developments
- 11.2.3.5. Financials (Based on Availability)
- 11.2.4 II-VI Advanced Materials
- 11.2.4.1. Overview
- 11.2.4.2. Products
- 11.2.4.3. SWOT Analysis
- 11.2.4.4. Recent Developments
- 11.2.4.5. Financials (Based on Availability)
- 11.2.5 Showa Denko
- 11.2.5.1. Overview
- 11.2.5.2. Products
- 11.2.5.3. SWOT Analysis
- 11.2.5.4. Recent Developments
- 11.2.5.5. Financials (Based on Availability)
- 11.2.6 Norstel
- 11.2.6.1. Overview
- 11.2.6.2. Products
- 11.2.6.3. SWOT Analysis
- 11.2.6.4. Recent Developments
- 11.2.6.5. Financials (Based on Availability)
- 11.2.7 TankeBlue
- 11.2.7.1. Overview
- 11.2.7.2. Products
- 11.2.7.3. SWOT Analysis
- 11.2.7.4. Recent Developments
- 11.2.7.5. Financials (Based on Availability)
- 11.2.8 SICC
- 11.2.8.1. Overview
- 11.2.8.2. Products
- 11.2.8.3. SWOT Analysis
- 11.2.8.4. Recent Developments
- 11.2.8.5. Financials (Based on Availability)
- 11.2.9 Hebei Synlight Crystal
- 11.2.9.1. Overview
- 11.2.9.2. Products
- 11.2.9.3. SWOT Analysis
- 11.2.9.4. Recent Developments
- 11.2.9.5. Financials (Based on Availability)
- 11.2.10 CETC
- 11.2.10.1. Overview
- 11.2.10.2. Products
- 11.2.10.3. SWOT Analysis
- 11.2.10.4. Recent Developments
- 11.2.10.5. Financials (Based on Availability)
- 11.2.1 Wolfspeed
List of Figures
- Figure 1: Global 6 Inch SiC Wafer Revenue Breakdown (million, %) by Region 2025 & 2033
- Figure 2: North America 6 Inch SiC Wafer Revenue (million), by Application 2025 & 2033
- Figure 3: North America 6 Inch SiC Wafer Revenue Share (%), by Application 2025 & 2033
- Figure 4: North America 6 Inch SiC Wafer Revenue (million), by Types 2025 & 2033
- Figure 5: North America 6 Inch SiC Wafer Revenue Share (%), by Types 2025 & 2033
- Figure 6: North America 6 Inch SiC Wafer Revenue (million), by Country 2025 & 2033
- Figure 7: North America 6 Inch SiC Wafer Revenue Share (%), by Country 2025 & 2033
- Figure 8: South America 6 Inch SiC Wafer Revenue (million), by Application 2025 & 2033
- Figure 9: South America 6 Inch SiC Wafer Revenue Share (%), by Application 2025 & 2033
- Figure 10: South America 6 Inch SiC Wafer Revenue (million), by Types 2025 & 2033
- Figure 11: South America 6 Inch SiC Wafer Revenue Share (%), by Types 2025 & 2033
- Figure 12: South America 6 Inch SiC Wafer Revenue (million), by Country 2025 & 2033
- Figure 13: South America 6 Inch SiC Wafer Revenue Share (%), by Country 2025 & 2033
- Figure 14: Europe 6 Inch SiC Wafer Revenue (million), by Application 2025 & 2033
- Figure 15: Europe 6 Inch SiC Wafer Revenue Share (%), by Application 2025 & 2033
- Figure 16: Europe 6 Inch SiC Wafer Revenue (million), by Types 2025 & 2033
- Figure 17: Europe 6 Inch SiC Wafer Revenue Share (%), by Types 2025 & 2033
- Figure 18: Europe 6 Inch SiC Wafer Revenue (million), by Country 2025 & 2033
- Figure 19: Europe 6 Inch SiC Wafer Revenue Share (%), by Country 2025 & 2033
- Figure 20: Middle East & Africa 6 Inch SiC Wafer Revenue (million), by Application 2025 & 2033
- Figure 21: Middle East & Africa 6 Inch SiC Wafer Revenue Share (%), by Application 2025 & 2033
- Figure 22: Middle East & Africa 6 Inch SiC Wafer Revenue (million), by Types 2025 & 2033
- Figure 23: Middle East & Africa 6 Inch SiC Wafer Revenue Share (%), by Types 2025 & 2033
- Figure 24: Middle East & Africa 6 Inch SiC Wafer Revenue (million), by Country 2025 & 2033
- Figure 25: Middle East & Africa 6 Inch SiC Wafer Revenue Share (%), by Country 2025 & 2033
- Figure 26: Asia Pacific 6 Inch SiC Wafer Revenue (million), by Application 2025 & 2033
- Figure 27: Asia Pacific 6 Inch SiC Wafer Revenue Share (%), by Application 2025 & 2033
- Figure 28: Asia Pacific 6 Inch SiC Wafer Revenue (million), by Types 2025 & 2033
- Figure 29: Asia Pacific 6 Inch SiC Wafer Revenue Share (%), by Types 2025 & 2033
- Figure 30: Asia Pacific 6 Inch SiC Wafer Revenue (million), by Country 2025 & 2033
- Figure 31: Asia Pacific 6 Inch SiC Wafer Revenue Share (%), by Country 2025 & 2033
List of Tables
- Table 1: Global 6 Inch SiC Wafer Revenue million Forecast, by Application 2020 & 2033
- Table 2: Global 6 Inch SiC Wafer Revenue million Forecast, by Types 2020 & 2033
- Table 3: Global 6 Inch SiC Wafer Revenue million Forecast, by Region 2020 & 2033
- Table 4: Global 6 Inch SiC Wafer Revenue million Forecast, by Application 2020 & 2033
- Table 5: Global 6 Inch SiC Wafer Revenue million Forecast, by Types 2020 & 2033
- Table 6: Global 6 Inch SiC Wafer Revenue million Forecast, by Country 2020 & 2033
- Table 7: United States 6 Inch SiC Wafer Revenue (million) Forecast, by Application 2020 & 2033
- Table 8: Canada 6 Inch SiC Wafer Revenue (million) Forecast, by Application 2020 & 2033
- Table 9: Mexico 6 Inch SiC Wafer Revenue (million) Forecast, by Application 2020 & 2033
- Table 10: Global 6 Inch SiC Wafer Revenue million Forecast, by Application 2020 & 2033
- Table 11: Global 6 Inch SiC Wafer Revenue million Forecast, by Types 2020 & 2033
- Table 12: Global 6 Inch SiC Wafer Revenue million Forecast, by Country 2020 & 2033
- Table 13: Brazil 6 Inch SiC Wafer Revenue (million) Forecast, by Application 2020 & 2033
- Table 14: Argentina 6 Inch SiC Wafer Revenue (million) Forecast, by Application 2020 & 2033
- Table 15: Rest of South America 6 Inch SiC Wafer Revenue (million) Forecast, by Application 2020 & 2033
- Table 16: Global 6 Inch SiC Wafer Revenue million Forecast, by Application 2020 & 2033
- Table 17: Global 6 Inch SiC Wafer Revenue million Forecast, by Types 2020 & 2033
- Table 18: Global 6 Inch SiC Wafer Revenue million Forecast, by Country 2020 & 2033
- Table 19: United Kingdom 6 Inch SiC Wafer Revenue (million) Forecast, by Application 2020 & 2033
- Table 20: Germany 6 Inch SiC Wafer Revenue (million) Forecast, by Application 2020 & 2033
- Table 21: France 6 Inch SiC Wafer Revenue (million) Forecast, by Application 2020 & 2033
- Table 22: Italy 6 Inch SiC Wafer Revenue (million) Forecast, by Application 2020 & 2033
- Table 23: Spain 6 Inch SiC Wafer Revenue (million) Forecast, by Application 2020 & 2033
- Table 24: Russia 6 Inch SiC Wafer Revenue (million) Forecast, by Application 2020 & 2033
- Table 25: Benelux 6 Inch SiC Wafer Revenue (million) Forecast, by Application 2020 & 2033
- Table 26: Nordics 6 Inch SiC Wafer Revenue (million) Forecast, by Application 2020 & 2033
- Table 27: Rest of Europe 6 Inch SiC Wafer Revenue (million) Forecast, by Application 2020 & 2033
- Table 28: Global 6 Inch SiC Wafer Revenue million Forecast, by Application 2020 & 2033
- Table 29: Global 6 Inch SiC Wafer Revenue million Forecast, by Types 2020 & 2033
- Table 30: Global 6 Inch SiC Wafer Revenue million Forecast, by Country 2020 & 2033
- Table 31: Turkey 6 Inch SiC Wafer Revenue (million) Forecast, by Application 2020 & 2033
- Table 32: Israel 6 Inch SiC Wafer Revenue (million) Forecast, by Application 2020 & 2033
- Table 33: GCC 6 Inch SiC Wafer Revenue (million) Forecast, by Application 2020 & 2033
- Table 34: North Africa 6 Inch SiC Wafer Revenue (million) Forecast, by Application 2020 & 2033
- Table 35: South Africa 6 Inch SiC Wafer Revenue (million) Forecast, by Application 2020 & 2033
- Table 36: Rest of Middle East & Africa 6 Inch SiC Wafer Revenue (million) Forecast, by Application 2020 & 2033
- Table 37: Global 6 Inch SiC Wafer Revenue million Forecast, by Application 2020 & 2033
- Table 38: Global 6 Inch SiC Wafer Revenue million Forecast, by Types 2020 & 2033
- Table 39: Global 6 Inch SiC Wafer Revenue million Forecast, by Country 2020 & 2033
- Table 40: China 6 Inch SiC Wafer Revenue (million) Forecast, by Application 2020 & 2033
- Table 41: India 6 Inch SiC Wafer Revenue (million) Forecast, by Application 2020 & 2033
- Table 42: Japan 6 Inch SiC Wafer Revenue (million) Forecast, by Application 2020 & 2033
- Table 43: South Korea 6 Inch SiC Wafer Revenue (million) Forecast, by Application 2020 & 2033
- Table 44: ASEAN 6 Inch SiC Wafer Revenue (million) Forecast, by Application 2020 & 2033
- Table 45: Oceania 6 Inch SiC Wafer Revenue (million) Forecast, by Application 2020 & 2033
- Table 46: Rest of Asia Pacific 6 Inch SiC Wafer Revenue (million) Forecast, by Application 2020 & 2033
Frequently Asked Questions
1. What is the projected Compound Annual Growth Rate (CAGR) of the 6 Inch SiC Wafer?
The projected CAGR is approximately XX%.
2. Which companies are prominent players in the 6 Inch SiC Wafer?
Key companies in the market include Wolfspeed, SK Siltron, SiCrystal, II-VI Advanced Materials, Showa Denko, Norstel, TankeBlue, SICC, Hebei Synlight Crystal, CETC.
3. What are the main segments of the 6 Inch SiC Wafer?
The market segments include Application, Types.
4. Can you provide details about the market size?
The market size is estimated to be USD XXX million as of 2022.
5. What are some drivers contributing to market growth?
N/A
6. What are the notable trends driving market growth?
N/A
7. Are there any restraints impacting market growth?
N/A
8. Can you provide examples of recent developments in the market?
N/A
9. What pricing options are available for accessing the report?
Pricing options include single-user, multi-user, and enterprise licenses priced at USD 2900.00, USD 4350.00, and USD 5800.00 respectively.
10. Is the market size provided in terms of value or volume?
The market size is provided in terms of value, measured in million.
11. Are there any specific market keywords associated with the report?
Yes, the market keyword associated with the report is "6 Inch SiC Wafer," which aids in identifying and referencing the specific market segment covered.
12. How do I determine which pricing option suits my needs best?
The pricing options vary based on user requirements and access needs. Individual users may opt for single-user licenses, while businesses requiring broader access may choose multi-user or enterprise licenses for cost-effective access to the report.
13. Are there any additional resources or data provided in the 6 Inch SiC Wafer report?
While the report offers comprehensive insights, it's advisable to review the specific contents or supplementary materials provided to ascertain if additional resources or data are available.
14. How can I stay updated on further developments or reports in the 6 Inch SiC Wafer?
To stay informed about further developments, trends, and reports in the 6 Inch SiC Wafer, consider subscribing to industry newsletters, following relevant companies and organizations, or regularly checking reputable industry news sources and publications.
Methodology
Step 1 - Identification of Relevant Samples Size from Population Database


Step 2 - Approaches for Defining Global Market Size (Value, Volume* & Price*)

Note*: In applicable scenarios
Step 3 - Data Sources
Primary Research
- Web Analytics
- Survey Reports
- Research Institute
- Latest Research Reports
- Opinion Leaders
Secondary Research
- Annual Reports
- White Paper
- Latest Press Release
- Industry Association
- Paid Database
- Investor Presentations

Step 4 - Data Triangulation
Involves using different sources of information in order to increase the validity of a study
These sources are likely to be stakeholders in a program - participants, other researchers, program staff, other community members, and so on.
Then we put all data in single framework & apply various statistical tools to find out the dynamic on the market.
During the analysis stage, feedback from the stakeholder groups would be compared to determine areas of agreement as well as areas of divergence