

Key Insights
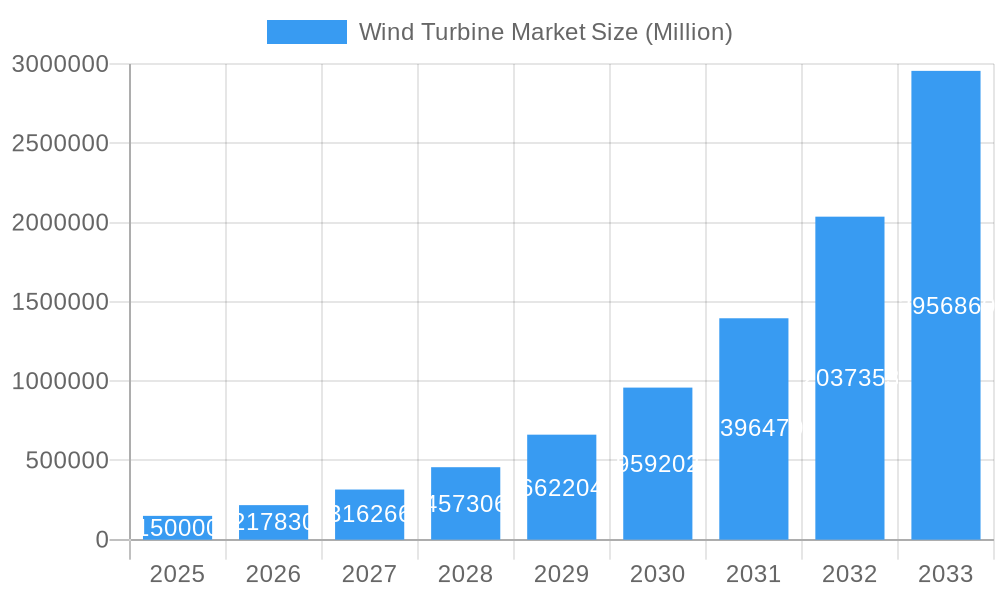
The global wind turbine market is poised for significant expansion, propelled by the escalating demand for sustainable energy solutions and a worldwide commitment to climate action. The market is projected to grow at a Compound Annual Growth Rate (CAGR) of 7.69% from 2025 to 2033, reaching a market size of 161.83 billion by 2033. Key growth catalysts include favorable government policies, declining turbine manufacturing costs, and heightened environmental consciousness regarding fossil fuel impacts. Emerging trends highlight a move towards higher-capacity turbines, especially in offshore installations, to enhance energy generation efficiency and reduce levelized cost of energy (LCOE). While supply chain complexities and regulatory approvals may pose challenges, the market's future trajectory is overwhelmingly positive, driven by global decarbonization targets and the increasing economic viability of wind power.
Wind Turbine Market Market Size (In Billion)
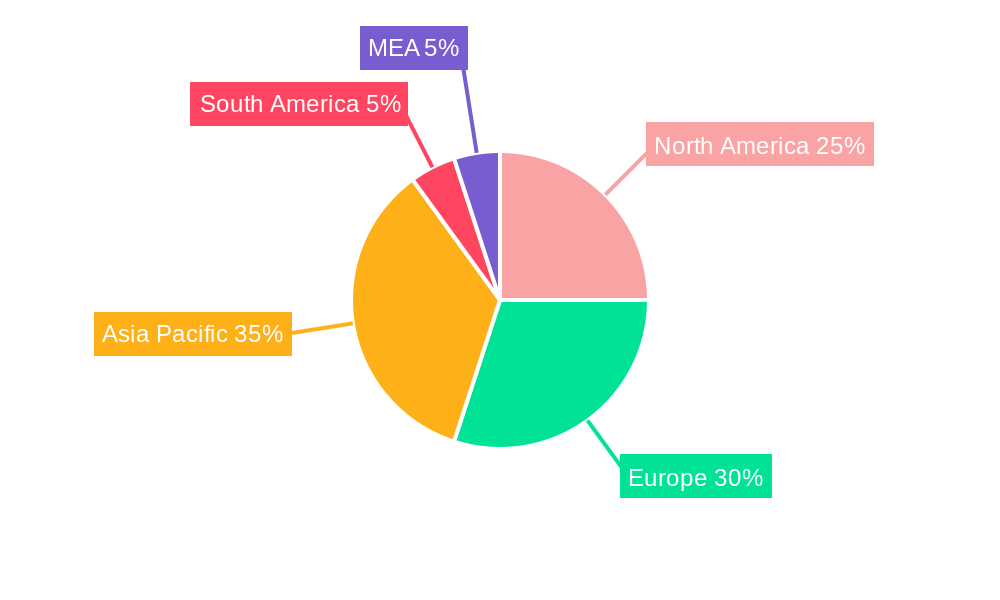
Market segmentation into onshore and offshore, and by turbine capacity (small, medium, large), enables precise investment targeting and innovation for specific applications. Substantial growth is anticipated across all major regions, with North America, Europe, and Asia Pacific spearheading this expansion, supported by established infrastructure and strong regulatory frameworks.
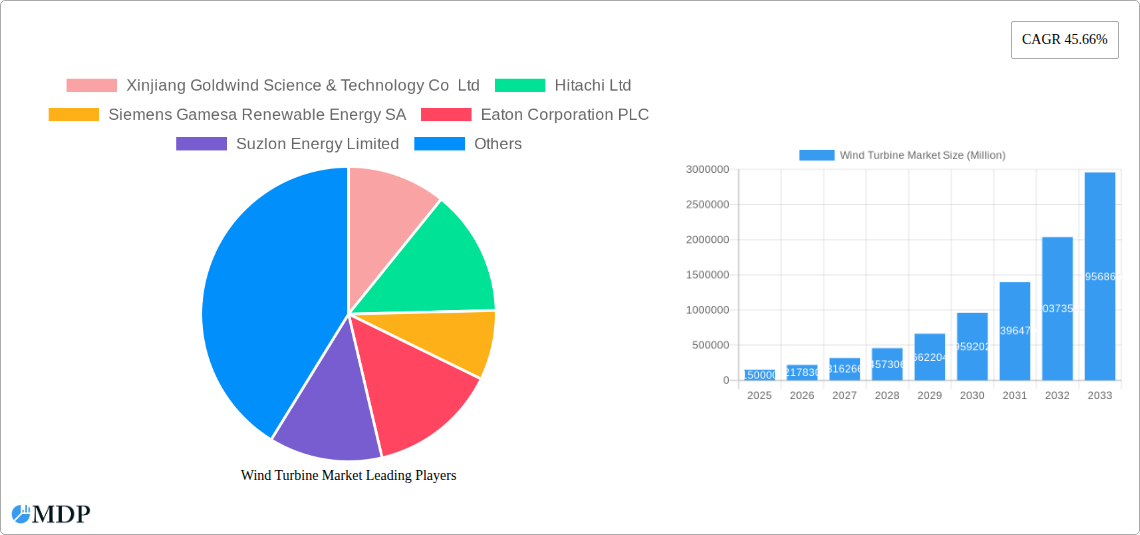
Wind Turbine Market Company Market Share
The competitive arena features industry leaders such as Vestas, Siemens Gamesa, and Goldwind, actively pursuing research and development to boost turbine performance, longevity, and affordability, while also extending their global presence. Strategic agility in adopting technological innovations, managing regulatory landscapes, and optimizing supply chains will be crucial for sustained success. The forecast period from 2025 to 2033 offers substantial opportunities for market development, particularly as technological advancements solidify wind energy's cost-competitiveness. Ongoing sustainability initiatives and stringent environmental mandates will continue to fuel the market's robust long-term growth.
Wind Turbine Market Report: 2019-2033 Forecast
This comprehensive report provides a detailed analysis of the global wind turbine market, offering invaluable insights for industry stakeholders, investors, and strategic decision-makers. Covering the period from 2019 to 2033, with a focus on 2025, this report dissects market dynamics, trends, leading players, and future growth opportunities within the onshore and offshore wind turbine sectors. The report utilizes extensive data analysis and expert insights to deliver actionable strategies for navigating this rapidly evolving market. Expect detailed breakdowns of market segments by capacity (small, medium, large) and deployment location (onshore, offshore).
Wind Turbine Market Dynamics & Concentration
The global wind turbine market exhibits a moderately concentrated landscape, with several key players dominating market share. Market concentration is influenced by factors such as technological advancements, economies of scale, and mergers & acquisitions (M&A) activities. The report analyzes the competitive intensity through metrics such as the Herfindahl-Hirschman Index (HHI) and market share distribution amongst top players.
- Innovation Drivers: Continuous R&D efforts focused on increasing turbine efficiency, reducing costs, and improving reliability are major drivers.
- Regulatory Frameworks: Government policies promoting renewable energy, including subsidies, tax incentives, and carbon emission reduction targets, significantly shape market growth. Stringent environmental regulations also influence technology adoption.
- Product Substitutes: While solar power is a key competitor, wind energy remains a dominant source of renewable power generation due to its consistent and predictable power output.
- End-User Trends: A global shift towards renewable energy sources, driven by climate change concerns and energy security needs, fuels market expansion. The growth of large-scale wind farms and offshore installations plays a pivotal role.
- M&A Activities: The past five years have witnessed xx M&A deals in the wind turbine sector, consolidating market share and driving innovation through the integration of technologies and expertise. Leading players are actively pursuing strategic acquisitions to expand their geographical reach and product portfolios. Market share data for major players is presented in detailed tables within the report. For instance, Vestas Wind Systems AS holds an estimated xx% market share in 2025, while Siemens Gamesa Renewable Energy SA holds an estimated xx%.
Wind Turbine Market Industry Trends & Analysis
The global wind turbine market is experiencing robust growth, driven by several factors. The report projects a Compound Annual Growth Rate (CAGR) of xx% during the forecast period (2025-2033). This growth is fueled by increasing demand for renewable energy, supportive government policies, and advancements in wind turbine technology. Market penetration continues to increase as wind power becomes a more cost-competitive energy source compared to traditional fossil fuels. Technological innovations, such as the development of larger and more efficient turbines and advanced control systems, are enhancing the competitiveness and efficiency of wind energy. Consumer preferences are shifting toward sustainable energy sources, influencing the demand for wind power and creating strong market momentum. The competitive landscape is characterized by intense rivalry among established players and emerging entrants, driving innovation and price competition.
Leading Markets & Segments in Wind Turbine Market
The onshore segment currently dominates the wind turbine market, accounting for xx% of the total market share in 2025, primarily driven by lower installation costs and established infrastructure. However, the offshore segment is poised for significant growth due to higher capacity factors and vast untapped potential in suitable coastal regions. Within capacity segments, the medium and large-capacity turbine segments are experiencing robust growth, driven by economies of scale and increasing project sizes.
Key Drivers:
- Onshore:
- Favorable government policies and subsidies.
- Established grid infrastructure.
- Lower initial investment costs compared to offshore.
- Offshore:
- Higher wind resource availability leading to better capacity factors.
- Growing demand for large-scale renewable energy projects.
- Technological advancements making offshore wind more cost-competitive.
- Large Capacity Turbines:
- Economies of scale leading to reduced costs per unit of energy.
- Increased energy production per turbine.
- suitability for large-scale wind farms.
The report details regional market dominance, highlighting specific countries within each region exhibiting the strongest growth trajectories. For example, xx is projected to be a leading market due to its ambitious renewable energy targets and robust infrastructure development.
Wind Turbine Market Product Developments
Recent years have witnessed significant advancements in wind turbine technology, with a focus on larger rotor diameters, improved blade designs, and advanced control systems to optimize energy capture. These innovations have resulted in increased efficiency, reduced costs, and improved reliability. The market is seeing a rise in hybrid and multi-megawatt turbines, catering to the needs of larger-scale wind farms. These developments provide significant competitive advantages, enabling manufacturers to offer higher energy output, lower operating costs, and enhanced performance, thereby securing a larger share of the market.
Key Drivers of Wind Turbine Market Growth
The wind turbine market is propelled by several interconnected factors. Firstly, the increasing urgency to transition to renewable energy sources to combat climate change and reduce carbon emissions is a powerful catalyst. Secondly, supportive government policies and subsidies, including carbon taxes, renewable portfolio standards, and tax incentives, are critical for driving investment in wind energy projects. Thirdly, technological advancements, particularly in turbine design and efficiency, have significantly reduced the cost of wind energy, making it a more competitive energy source.
Challenges in the Wind Turbine Market Market
Despite the significant growth potential, the wind turbine market faces considerable challenges. Supply chain disruptions, particularly for crucial components such as rare earth metals, can impact production timelines and costs. Furthermore, obtaining permits and approvals for large-scale wind farm projects can involve lengthy bureaucratic processes. Finally, intense competition among established manufacturers and new entrants exerts pressure on pricing and profitability, creating challenges for companies with smaller market shares. These combined factors could restrain market growth by an estimated xx% in certain regions.
Emerging Opportunities in Wind Turbine Market
The long-term growth of the wind turbine market is supported by several promising trends. The ongoing development of more efficient and cost-effective offshore wind turbines presents considerable potential. Strategic partnerships between wind turbine manufacturers, energy companies, and technology developers are fostering innovation and accelerating market expansion. Finally, geographical expansion into emerging markets with strong wind resources but limited existing infrastructure provides ample opportunities for new projects and capacity increases.
Leading Players in the Wind Turbine Market Sector
Key Milestones in Wind Turbine Market Industry
- January 2024: Suzlon Group secures a 225 MW wind energy order from Everrenew Energy, highlighting the growing demand for wind power in India.
- November 2023: GE Vernova partners with O2 Power Private Limited for a 97 MW wind power project in Maharashtra, India, showcasing significant project deployments.
- January 2023: Braun Windturbinen GmbH installs a 7.5 kW small wind turbine system in Germany, demonstrating the expansion into smaller-scale applications.
Strategic Outlook for Wind Turbine Market Market
The wind turbine market is poised for continued expansion, driven by increasing global demand for renewable energy, technological innovation, and supportive government policies. Strategic opportunities exist in expanding into new geographical markets, developing innovative turbine designs, and forging strategic partnerships to enhance market reach and technological capabilities. The long-term outlook is positive, with significant potential for growth and market expansion in both onshore and offshore segments.
Wind Turbine Market Segmentation
-
1. Location of Deployment
- 1.1. Onshore
- 1.2. Offshore
-
2. Capacity
- 2.1. Small
- 2.2. Medium
- 2.3. Large
Wind Turbine Market Segmentation By Geography
-
1. North America
- 1.1. United States
- 1.2. Canada
- 1.3. Rest of the North America
-
2. Europe
- 2.1. Germany
- 2.2. United Kingdom
- 2.3. France
- 2.4. Spain
- 2.5. Russia
- 2.6. NORDIC
- 2.7. Italy
- 2.8. Turkey
- 2.9. Rest of the Europe
-
3. Asia Pacific
- 3.1. China
- 3.2. India
- 3.3. Japan
- 3.4. Australia
- 3.5. Thailand
- 3.6. Vietnam
- 3.7. Malaysia
- 3.8. Indonesia
- 3.9. Rest of the Asia Pacific
-
4. South America
- 4.1. Brazil
- 4.2. Argentina
- 4.3. Colombia
- 4.4. Rest of the South America
-
5. Middle East and Africa
- 5.1. United Arab Emirates
- 5.2. Saudi Arabia
- 5.3. South Africa
- 5.4. Egypt
- 5.5. Qatar
- 5.6. Nigeria
- 5.7. Rest of the Middle East and Africa
Wind Turbine Market Regional Market Share
Geographic Coverage of Wind Turbine Market
Wind Turbine Market REPORT HIGHLIGHTS
| Aspects | Details |
|---|---|
| Study Period | 2020-2034 |
| Base Year | 2025 |
| Estimated Year | 2026 |
| Forecast Period | 2026-2034 |
| Historical Period | 2020-2025 |
| Growth Rate | CAGR of 7.69% from 2020-2034 |
| Segmentation |
|
Table of Contents
- 1. Introduction
- 1.1. Research Scope
- 1.2. Market Segmentation
- 1.3. Research Objective
- 1.4. Definitions and Assumptions
- 2. Executive Summary
- 2.1. Market Snapshot
- 3. Market Dynamics
- 3.1. Market Drivers
- 3.2. Market Restrains
- 3.3. Market Trends
- 3.4. Market Opportunities
- 4. Market Factor Analysis
- 4.1. Porters Five Forces
- 4.1.1. Bargaining Power of Suppliers
- 4.1.2. Bargaining Power of Buyers
- 4.1.3. Threat of New Entrants
- 4.1.4. Threat of Substitutes
- 4.1.5. Competitive Rivalry
- 4.2. PESTEL analysis
- 4.3. BCG Analysis
- 4.3.1. Stars (High Growth, High Market Share)
- 4.3.2. Cash Cows (Low Growth, High Market Share)
- 4.3.3. Question Mark (High Growth, Low Market Share)
- 4.3.4. Dogs (Low Growth, Low Market Share)
- 4.4. Ansoff Matrix Analysis
- 4.5. Supply Chain Analysis
- 4.6. Regulatory Landscape
- 4.7. Current Market Potential and Opportunity Assessment (TAM–SAM–SOM Framework)
- 4.8. MDP Analyst Note
- 4.1. Porters Five Forces
- 5. Market Analysis, Insights and Forecast 2021-2033
- 5.1. Market Analysis, Insights and Forecast - by Location of Deployment
- 5.1.1. Onshore
- 5.1.2. Offshore
- 5.2. Market Analysis, Insights and Forecast - by Capacity
- 5.2.1. Small
- 5.2.2. Medium
- 5.2.3. Large
- 5.3. Market Analysis, Insights and Forecast - by Region
- 5.3.1. North America
- 5.3.2. Europe
- 5.3.3. Asia Pacific
- 5.3.4. South America
- 5.3.5. Middle East and Africa
- 5.1. Market Analysis, Insights and Forecast - by Location of Deployment
- 6. Global Wind Turbine Market Analysis, Insights and Forecast, 2021-2033
- 6.1. Market Analysis, Insights and Forecast - by Location of Deployment
- 6.1.1. Onshore
- 6.1.2. Offshore
- 6.2. Market Analysis, Insights and Forecast - by Capacity
- 6.2.1. Small
- 6.2.2. Medium
- 6.2.3. Large
- 6.1. Market Analysis, Insights and Forecast - by Location of Deployment
- 7. North America Wind Turbine Market Analysis, Insights and Forecast, 2020-2032
- 7.1. Market Analysis, Insights and Forecast - by Location of Deployment
- 7.1.1. Onshore
- 7.1.2. Offshore
- 7.2. Market Analysis, Insights and Forecast - by Capacity
- 7.2.1. Small
- 7.2.2. Medium
- 7.2.3. Large
- 7.1. Market Analysis, Insights and Forecast - by Location of Deployment
- 8. Europe Wind Turbine Market Analysis, Insights and Forecast, 2020-2032
- 8.1. Market Analysis, Insights and Forecast - by Location of Deployment
- 8.1.1. Onshore
- 8.1.2. Offshore
- 8.2. Market Analysis, Insights and Forecast - by Capacity
- 8.2.1. Small
- 8.2.2. Medium
- 8.2.3. Large
- 8.1. Market Analysis, Insights and Forecast - by Location of Deployment
- 9. Asia Pacific Wind Turbine Market Analysis, Insights and Forecast, 2020-2032
- 9.1. Market Analysis, Insights and Forecast - by Location of Deployment
- 9.1.1. Onshore
- 9.1.2. Offshore
- 9.2. Market Analysis, Insights and Forecast - by Capacity
- 9.2.1. Small
- 9.2.2. Medium
- 9.2.3. Large
- 9.1. Market Analysis, Insights and Forecast - by Location of Deployment
- 10. South America Wind Turbine Market Analysis, Insights and Forecast, 2020-2032
- 10.1. Market Analysis, Insights and Forecast - by Location of Deployment
- 10.1.1. Onshore
- 10.1.2. Offshore
- 10.2. Market Analysis, Insights and Forecast - by Capacity
- 10.2.1. Small
- 10.2.2. Medium
- 10.2.3. Large
- 10.1. Market Analysis, Insights and Forecast - by Location of Deployment
- 11. Middle East and Africa Wind Turbine Market Analysis, Insights and Forecast, 2020-2032
- 11.1. Market Analysis, Insights and Forecast - by Location of Deployment
- 11.1.1. Onshore
- 11.1.2. Offshore
- 11.2. Market Analysis, Insights and Forecast - by Capacity
- 11.2.1. Small
- 11.2.2. Medium
- 11.2.3. Large
- 11.1. Market Analysis, Insights and Forecast - by Location of Deployment
- 12. Competitive Analysis
- 12.1. Company Profiles
- 12.1.1 Xinjiang Goldwind Science & Technology Co Ltd
- 12.1.1.1. Company Overview
- 12.1.1.2. Products
- 12.1.1.3. Company Financials
- 12.1.1.4. SWOT Analysis
- 12.1.2 Hitachi Ltd
- 12.1.2.1. Company Overview
- 12.1.2.2. Products
- 12.1.2.3. Company Financials
- 12.1.2.4. SWOT Analysis
- 12.1.3 Siemens Gamesa Renewable Energy SA
- 12.1.3.1. Company Overview
- 12.1.3.2. Products
- 12.1.3.3. Company Financials
- 12.1.3.4. SWOT Analysis
- 12.1.4 Eaton Corporation PLC
- 12.1.4.1. Company Overview
- 12.1.4.2. Products
- 12.1.4.3. Company Financials
- 12.1.4.4. SWOT Analysis
- 12.1.5 Suzlon Energy Limited
- 12.1.5.1. Company Overview
- 12.1.5.2. Products
- 12.1.5.3. Company Financials
- 12.1.5.4. SWOT Analysis
- 12.1.6 Vestas Wind Systems AS
- 12.1.6.1. Company Overview
- 12.1.6.2. Products
- 12.1.6.3. Company Financials
- 12.1.6.4. SWOT Analysis
- 12.1.7 Vergnet
- 12.1.7.1. Company Overview
- 12.1.7.2. Products
- 12.1.7.3. Company Financials
- 12.1.7.4. SWOT Analysis
- 12.1.8 General Electric Company
- 12.1.8.1. Company Overview
- 12.1.8.2. Products
- 12.1.8.3. Company Financials
- 12.1.8.4. SWOT Analysis
- 12.1.9 Enercon GmbH
- 12.1.9.1. Company Overview
- 12.1.9.2. Products
- 12.1.9.3. Company Financials
- 12.1.9.4. SWOT Analysis
- 12.1.10 Nordex SE
- 12.1.10.1. Company Overview
- 12.1.10.2. Products
- 12.1.10.3. Company Financials
- 12.1.10.4. SWOT Analysis
- 12.1.1 Xinjiang Goldwind Science & Technology Co Ltd
- 12.2. Market Entropy
- 12.2.1 Company's Key Areas Served
- 12.2.2 Recent Developments
- 12.3. Company Market Share Analysis 2025
- 12.3.1 Top 5 Companies Market Share Analysis
- 12.3.2 Top 3 Companies Market Share Analysis
- 12.4. List of Potential Customers
- 13. Research Methodology
List of Figures
- Figure 1: Global Wind Turbine Market Revenue Breakdown (billion, %) by Region 2025 & 2033
- Figure 2: Global Wind Turbine Market Volume Breakdown (gigawatt, %) by Region 2025 & 2033
- Figure 3: North America Wind Turbine Market Revenue (billion), by Location of Deployment 2025 & 2033
- Figure 4: North America Wind Turbine Market Volume (gigawatt), by Location of Deployment 2025 & 2033
- Figure 5: North America Wind Turbine Market Revenue Share (%), by Location of Deployment 2025 & 2033
- Figure 6: North America Wind Turbine Market Volume Share (%), by Location of Deployment 2025 & 2033
- Figure 7: North America Wind Turbine Market Revenue (billion), by Capacity 2025 & 2033
- Figure 8: North America Wind Turbine Market Volume (gigawatt), by Capacity 2025 & 2033
- Figure 9: North America Wind Turbine Market Revenue Share (%), by Capacity 2025 & 2033
- Figure 10: North America Wind Turbine Market Volume Share (%), by Capacity 2025 & 2033
- Figure 11: North America Wind Turbine Market Revenue (billion), by Country 2025 & 2033
- Figure 12: North America Wind Turbine Market Volume (gigawatt), by Country 2025 & 2033
- Figure 13: North America Wind Turbine Market Revenue Share (%), by Country 2025 & 2033
- Figure 14: North America Wind Turbine Market Volume Share (%), by Country 2025 & 2033
- Figure 15: Europe Wind Turbine Market Revenue (billion), by Location of Deployment 2025 & 2033
- Figure 16: Europe Wind Turbine Market Volume (gigawatt), by Location of Deployment 2025 & 2033
- Figure 17: Europe Wind Turbine Market Revenue Share (%), by Location of Deployment 2025 & 2033
- Figure 18: Europe Wind Turbine Market Volume Share (%), by Location of Deployment 2025 & 2033
- Figure 19: Europe Wind Turbine Market Revenue (billion), by Capacity 2025 & 2033
- Figure 20: Europe Wind Turbine Market Volume (gigawatt), by Capacity 2025 & 2033
- Figure 21: Europe Wind Turbine Market Revenue Share (%), by Capacity 2025 & 2033
- Figure 22: Europe Wind Turbine Market Volume Share (%), by Capacity 2025 & 2033
- Figure 23: Europe Wind Turbine Market Revenue (billion), by Country 2025 & 2033
- Figure 24: Europe Wind Turbine Market Volume (gigawatt), by Country 2025 & 2033
- Figure 25: Europe Wind Turbine Market Revenue Share (%), by Country 2025 & 2033
- Figure 26: Europe Wind Turbine Market Volume Share (%), by Country 2025 & 2033
- Figure 27: Asia Pacific Wind Turbine Market Revenue (billion), by Location of Deployment 2025 & 2033
- Figure 28: Asia Pacific Wind Turbine Market Volume (gigawatt), by Location of Deployment 2025 & 2033
- Figure 29: Asia Pacific Wind Turbine Market Revenue Share (%), by Location of Deployment 2025 & 2033
- Figure 30: Asia Pacific Wind Turbine Market Volume Share (%), by Location of Deployment 2025 & 2033
- Figure 31: Asia Pacific Wind Turbine Market Revenue (billion), by Capacity 2025 & 2033
- Figure 32: Asia Pacific Wind Turbine Market Volume (gigawatt), by Capacity 2025 & 2033
- Figure 33: Asia Pacific Wind Turbine Market Revenue Share (%), by Capacity 2025 & 2033
- Figure 34: Asia Pacific Wind Turbine Market Volume Share (%), by Capacity 2025 & 2033
- Figure 35: Asia Pacific Wind Turbine Market Revenue (billion), by Country 2025 & 2033
- Figure 36: Asia Pacific Wind Turbine Market Volume (gigawatt), by Country 2025 & 2033
- Figure 37: Asia Pacific Wind Turbine Market Revenue Share (%), by Country 2025 & 2033
- Figure 38: Asia Pacific Wind Turbine Market Volume Share (%), by Country 2025 & 2033
- Figure 39: South America Wind Turbine Market Revenue (billion), by Location of Deployment 2025 & 2033
- Figure 40: South America Wind Turbine Market Volume (gigawatt), by Location of Deployment 2025 & 2033
- Figure 41: South America Wind Turbine Market Revenue Share (%), by Location of Deployment 2025 & 2033
- Figure 42: South America Wind Turbine Market Volume Share (%), by Location of Deployment 2025 & 2033
- Figure 43: South America Wind Turbine Market Revenue (billion), by Capacity 2025 & 2033
- Figure 44: South America Wind Turbine Market Volume (gigawatt), by Capacity 2025 & 2033
- Figure 45: South America Wind Turbine Market Revenue Share (%), by Capacity 2025 & 2033
- Figure 46: South America Wind Turbine Market Volume Share (%), by Capacity 2025 & 2033
- Figure 47: South America Wind Turbine Market Revenue (billion), by Country 2025 & 2033
- Figure 48: South America Wind Turbine Market Volume (gigawatt), by Country 2025 & 2033
- Figure 49: South America Wind Turbine Market Revenue Share (%), by Country 2025 & 2033
- Figure 50: South America Wind Turbine Market Volume Share (%), by Country 2025 & 2033
- Figure 51: Middle East and Africa Wind Turbine Market Revenue (billion), by Location of Deployment 2025 & 2033
- Figure 52: Middle East and Africa Wind Turbine Market Volume (gigawatt), by Location of Deployment 2025 & 2033
- Figure 53: Middle East and Africa Wind Turbine Market Revenue Share (%), by Location of Deployment 2025 & 2033
- Figure 54: Middle East and Africa Wind Turbine Market Volume Share (%), by Location of Deployment 2025 & 2033
- Figure 55: Middle East and Africa Wind Turbine Market Revenue (billion), by Capacity 2025 & 2033
- Figure 56: Middle East and Africa Wind Turbine Market Volume (gigawatt), by Capacity 2025 & 2033
- Figure 57: Middle East and Africa Wind Turbine Market Revenue Share (%), by Capacity 2025 & 2033
- Figure 58: Middle East and Africa Wind Turbine Market Volume Share (%), by Capacity 2025 & 2033
- Figure 59: Middle East and Africa Wind Turbine Market Revenue (billion), by Country 2025 & 2033
- Figure 60: Middle East and Africa Wind Turbine Market Volume (gigawatt), by Country 2025 & 2033
- Figure 61: Middle East and Africa Wind Turbine Market Revenue Share (%), by Country 2025 & 2033
- Figure 62: Middle East and Africa Wind Turbine Market Volume Share (%), by Country 2025 & 2033
List of Tables
- Table 1: Global Wind Turbine Market Revenue billion Forecast, by Location of Deployment 2020 & 2033
- Table 2: Global Wind Turbine Market Volume gigawatt Forecast, by Location of Deployment 2020 & 2033
- Table 3: Global Wind Turbine Market Revenue billion Forecast, by Capacity 2020 & 2033
- Table 4: Global Wind Turbine Market Volume gigawatt Forecast, by Capacity 2020 & 2033
- Table 5: Global Wind Turbine Market Revenue billion Forecast, by Region 2020 & 2033
- Table 6: Global Wind Turbine Market Volume gigawatt Forecast, by Region 2020 & 2033
- Table 7: Global Wind Turbine Market Revenue billion Forecast, by Location of Deployment 2020 & 2033
- Table 8: Global Wind Turbine Market Volume gigawatt Forecast, by Location of Deployment 2020 & 2033
- Table 9: Global Wind Turbine Market Revenue billion Forecast, by Capacity 2020 & 2033
- Table 10: Global Wind Turbine Market Volume gigawatt Forecast, by Capacity 2020 & 2033
- Table 11: Global Wind Turbine Market Revenue billion Forecast, by Country 2020 & 2033
- Table 12: Global Wind Turbine Market Volume gigawatt Forecast, by Country 2020 & 2033
- Table 13: United States Wind Turbine Market Revenue (billion) Forecast, by Application 2020 & 2033
- Table 14: United States Wind Turbine Market Volume (gigawatt) Forecast, by Application 2020 & 2033
- Table 15: Canada Wind Turbine Market Revenue (billion) Forecast, by Application 2020 & 2033
- Table 16: Canada Wind Turbine Market Volume (gigawatt) Forecast, by Application 2020 & 2033
- Table 17: Rest of the North America Wind Turbine Market Revenue (billion) Forecast, by Application 2020 & 2033
- Table 18: Rest of the North America Wind Turbine Market Volume (gigawatt) Forecast, by Application 2020 & 2033
- Table 19: Global Wind Turbine Market Revenue billion Forecast, by Location of Deployment 2020 & 2033
- Table 20: Global Wind Turbine Market Volume gigawatt Forecast, by Location of Deployment 2020 & 2033
- Table 21: Global Wind Turbine Market Revenue billion Forecast, by Capacity 2020 & 2033
- Table 22: Global Wind Turbine Market Volume gigawatt Forecast, by Capacity 2020 & 2033
- Table 23: Global Wind Turbine Market Revenue billion Forecast, by Country 2020 & 2033
- Table 24: Global Wind Turbine Market Volume gigawatt Forecast, by Country 2020 & 2033
- Table 25: Germany Wind Turbine Market Revenue (billion) Forecast, by Application 2020 & 2033
- Table 26: Germany Wind Turbine Market Volume (gigawatt) Forecast, by Application 2020 & 2033
- Table 27: United Kingdom Wind Turbine Market Revenue (billion) Forecast, by Application 2020 & 2033
- Table 28: United Kingdom Wind Turbine Market Volume (gigawatt) Forecast, by Application 2020 & 2033
- Table 29: France Wind Turbine Market Revenue (billion) Forecast, by Application 2020 & 2033
- Table 30: France Wind Turbine Market Volume (gigawatt) Forecast, by Application 2020 & 2033
- Table 31: Spain Wind Turbine Market Revenue (billion) Forecast, by Application 2020 & 2033
- Table 32: Spain Wind Turbine Market Volume (gigawatt) Forecast, by Application 2020 & 2033
- Table 33: Russia Wind Turbine Market Revenue (billion) Forecast, by Application 2020 & 2033
- Table 34: Russia Wind Turbine Market Volume (gigawatt) Forecast, by Application 2020 & 2033
- Table 35: NORDIC Wind Turbine Market Revenue (billion) Forecast, by Application 2020 & 2033
- Table 36: NORDIC Wind Turbine Market Volume (gigawatt) Forecast, by Application 2020 & 2033
- Table 37: Italy Wind Turbine Market Revenue (billion) Forecast, by Application 2020 & 2033
- Table 38: Italy Wind Turbine Market Volume (gigawatt) Forecast, by Application 2020 & 2033
- Table 39: Turkey Wind Turbine Market Revenue (billion) Forecast, by Application 2020 & 2033
- Table 40: Turkey Wind Turbine Market Volume (gigawatt) Forecast, by Application 2020 & 2033
- Table 41: Rest of the Europe Wind Turbine Market Revenue (billion) Forecast, by Application 2020 & 2033
- Table 42: Rest of the Europe Wind Turbine Market Volume (gigawatt) Forecast, by Application 2020 & 2033
- Table 43: Global Wind Turbine Market Revenue billion Forecast, by Location of Deployment 2020 & 2033
- Table 44: Global Wind Turbine Market Volume gigawatt Forecast, by Location of Deployment 2020 & 2033
- Table 45: Global Wind Turbine Market Revenue billion Forecast, by Capacity 2020 & 2033
- Table 46: Global Wind Turbine Market Volume gigawatt Forecast, by Capacity 2020 & 2033
- Table 47: Global Wind Turbine Market Revenue billion Forecast, by Country 2020 & 2033
- Table 48: Global Wind Turbine Market Volume gigawatt Forecast, by Country 2020 & 2033
- Table 49: China Wind Turbine Market Revenue (billion) Forecast, by Application 2020 & 2033
- Table 50: China Wind Turbine Market Volume (gigawatt) Forecast, by Application 2020 & 2033
- Table 51: India Wind Turbine Market Revenue (billion) Forecast, by Application 2020 & 2033
- Table 52: India Wind Turbine Market Volume (gigawatt) Forecast, by Application 2020 & 2033
- Table 53: Japan Wind Turbine Market Revenue (billion) Forecast, by Application 2020 & 2033
- Table 54: Japan Wind Turbine Market Volume (gigawatt) Forecast, by Application 2020 & 2033
- Table 55: Australia Wind Turbine Market Revenue (billion) Forecast, by Application 2020 & 2033
- Table 56: Australia Wind Turbine Market Volume (gigawatt) Forecast, by Application 2020 & 2033
- Table 57: Thailand Wind Turbine Market Revenue (billion) Forecast, by Application 2020 & 2033
- Table 58: Thailand Wind Turbine Market Volume (gigawatt) Forecast, by Application 2020 & 2033
- Table 59: Vietnam Wind Turbine Market Revenue (billion) Forecast, by Application 2020 & 2033
- Table 60: Vietnam Wind Turbine Market Volume (gigawatt) Forecast, by Application 2020 & 2033
- Table 61: Malaysia Wind Turbine Market Revenue (billion) Forecast, by Application 2020 & 2033
- Table 62: Malaysia Wind Turbine Market Volume (gigawatt) Forecast, by Application 2020 & 2033
- Table 63: Indonesia Wind Turbine Market Revenue (billion) Forecast, by Application 2020 & 2033
- Table 64: Indonesia Wind Turbine Market Volume (gigawatt) Forecast, by Application 2020 & 2033
- Table 65: Rest of the Asia Pacific Wind Turbine Market Revenue (billion) Forecast, by Application 2020 & 2033
- Table 66: Rest of the Asia Pacific Wind Turbine Market Volume (gigawatt) Forecast, by Application 2020 & 2033
- Table 67: Global Wind Turbine Market Revenue billion Forecast, by Location of Deployment 2020 & 2033
- Table 68: Global Wind Turbine Market Volume gigawatt Forecast, by Location of Deployment 2020 & 2033
- Table 69: Global Wind Turbine Market Revenue billion Forecast, by Capacity 2020 & 2033
- Table 70: Global Wind Turbine Market Volume gigawatt Forecast, by Capacity 2020 & 2033
- Table 71: Global Wind Turbine Market Revenue billion Forecast, by Country 2020 & 2033
- Table 72: Global Wind Turbine Market Volume gigawatt Forecast, by Country 2020 & 2033
- Table 73: Brazil Wind Turbine Market Revenue (billion) Forecast, by Application 2020 & 2033
- Table 74: Brazil Wind Turbine Market Volume (gigawatt) Forecast, by Application 2020 & 2033
- Table 75: Argentina Wind Turbine Market Revenue (billion) Forecast, by Application 2020 & 2033
- Table 76: Argentina Wind Turbine Market Volume (gigawatt) Forecast, by Application 2020 & 2033
- Table 77: Colombia Wind Turbine Market Revenue (billion) Forecast, by Application 2020 & 2033
- Table 78: Colombia Wind Turbine Market Volume (gigawatt) Forecast, by Application 2020 & 2033
- Table 79: Rest of the South America Wind Turbine Market Revenue (billion) Forecast, by Application 2020 & 2033
- Table 80: Rest of the South America Wind Turbine Market Volume (gigawatt) Forecast, by Application 2020 & 2033
- Table 81: Global Wind Turbine Market Revenue billion Forecast, by Location of Deployment 2020 & 2033
- Table 82: Global Wind Turbine Market Volume gigawatt Forecast, by Location of Deployment 2020 & 2033
- Table 83: Global Wind Turbine Market Revenue billion Forecast, by Capacity 2020 & 2033
- Table 84: Global Wind Turbine Market Volume gigawatt Forecast, by Capacity 2020 & 2033
- Table 85: Global Wind Turbine Market Revenue billion Forecast, by Country 2020 & 2033
- Table 86: Global Wind Turbine Market Volume gigawatt Forecast, by Country 2020 & 2033
- Table 87: United Arab Emirates Wind Turbine Market Revenue (billion) Forecast, by Application 2020 & 2033
- Table 88: United Arab Emirates Wind Turbine Market Volume (gigawatt) Forecast, by Application 2020 & 2033
- Table 89: Saudi Arabia Wind Turbine Market Revenue (billion) Forecast, by Application 2020 & 2033
- Table 90: Saudi Arabia Wind Turbine Market Volume (gigawatt) Forecast, by Application 2020 & 2033
- Table 91: South Africa Wind Turbine Market Revenue (billion) Forecast, by Application 2020 & 2033
- Table 92: South Africa Wind Turbine Market Volume (gigawatt) Forecast, by Application 2020 & 2033
- Table 93: Egypt Wind Turbine Market Revenue (billion) Forecast, by Application 2020 & 2033
- Table 94: Egypt Wind Turbine Market Volume (gigawatt) Forecast, by Application 2020 & 2033
- Table 95: Qatar Wind Turbine Market Revenue (billion) Forecast, by Application 2020 & 2033
- Table 96: Qatar Wind Turbine Market Volume (gigawatt) Forecast, by Application 2020 & 2033
- Table 97: Nigeria Wind Turbine Market Revenue (billion) Forecast, by Application 2020 & 2033
- Table 98: Nigeria Wind Turbine Market Volume (gigawatt) Forecast, by Application 2020 & 2033
- Table 99: Rest of the Middle East and Africa Wind Turbine Market Revenue (billion) Forecast, by Application 2020 & 2033
- Table 100: Rest of the Middle East and Africa Wind Turbine Market Volume (gigawatt) Forecast, by Application 2020 & 2033
Frequently Asked Questions
1. What is the projected Compound Annual Growth Rate (CAGR) of the Wind Turbine Market?
The projected CAGR is approximately 7.69%.
2. Which companies are prominent players in the Wind Turbine Market?
Key companies in the market include Xinjiang Goldwind Science & Technology Co Ltd, Hitachi Ltd, Siemens Gamesa Renewable Energy SA, Eaton Corporation PLC, Suzlon Energy Limited, Vestas Wind Systems AS, Vergnet, General Electric Company, Enercon GmbH, Nordex SE.
3. What are the main segments of the Wind Turbine Market?
The market segments include Location of Deployment, Capacity.
4. Can you provide details about the market size?
The market size is estimated to be USD 161.83 billion as of 2022.
5. What are some drivers contributing to market growth?
4.; Increasing Demand for Renewable Energy Sources4.; Efforts to Reduce the Reliance on Fossil Fuel-Based Power Generation.
6. What are the notable trends driving market growth?
Offshore Wind Turbine to Witness Significant Growth.
7. Are there any restraints impacting market growth?
4.; The Adoption of Alternative Clean Energy Sources.
8. Can you provide examples of recent developments in the market?
January 2024: Suzlon Group made a new 225 MW wind energy order from Everrenew Energy. As per the order, the company will install 75 wind turbine generators with a Hybrid Lattice Tubular tower and a rated capacity of 3 MW each at Everrenew Energy's sites at Vengaimandalam, Trichy district, and Ottapidaram, Tuticorin district in Tamil Nadu.
9. What pricing options are available for accessing the report?
Pricing options include single-user, multi-user, and enterprise licenses priced at USD 4750, USD 5250, and USD 8750 respectively.
10. Is the market size provided in terms of value or volume?
The market size is provided in terms of value, measured in billion and volume, measured in gigawatt.
11. Are there any specific market keywords associated with the report?
Yes, the market keyword associated with the report is "Wind Turbine Market," which aids in identifying and referencing the specific market segment covered.
12. How do I determine which pricing option suits my needs best?
The pricing options vary based on user requirements and access needs. Individual users may opt for single-user licenses, while businesses requiring broader access may choose multi-user or enterprise licenses for cost-effective access to the report.
13. Are there any additional resources or data provided in the Wind Turbine Market report?
While the report offers comprehensive insights, it's advisable to review the specific contents or supplementary materials provided to ascertain if additional resources or data are available.
14. How can I stay updated on further developments or reports in the Wind Turbine Market?
To stay informed about further developments, trends, and reports in the Wind Turbine Market, consider subscribing to industry newsletters, following relevant companies and organizations, or regularly checking reputable industry news sources and publications.
Methodology
Step 1 - Identification of Relevant Samples Size from Population Database


Step 2 - Approaches for Defining Global Market Size (Value, Volume* & Price*)

Note*: In applicable scenarios
Step 3 - Data Sources
Primary Research
- Web Analytics
- Survey Reports
- Research Institute
- Latest Research Reports
- Opinion Leaders
Secondary Research
- Annual Reports
- White Paper
- Latest Press Release
- Industry Association
- Paid Database
- Investor Presentations

Step 4 - Data Triangulation
Involves using different sources of information in order to increase the validity of a study
These sources are likely to be stakeholders in a program - participants, other researchers, program staff, other community members, and so on.
Then we put all data in single framework & apply various statistical tools to find out the dynamic on the market.
During the analysis stage, feedback from the stakeholder groups would be compared to determine areas of agreement as well as areas of divergence