

Key Insights
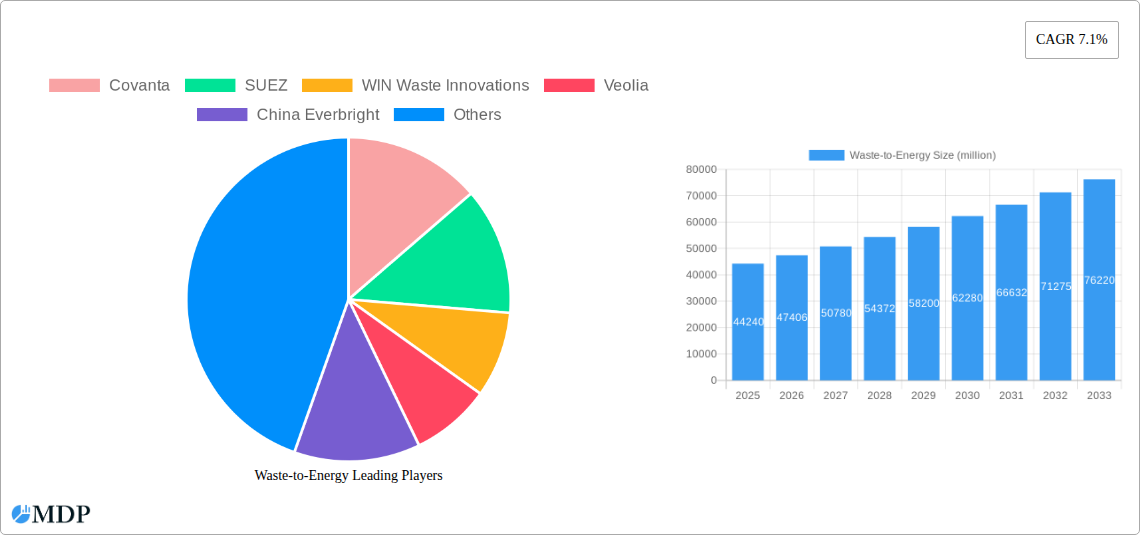
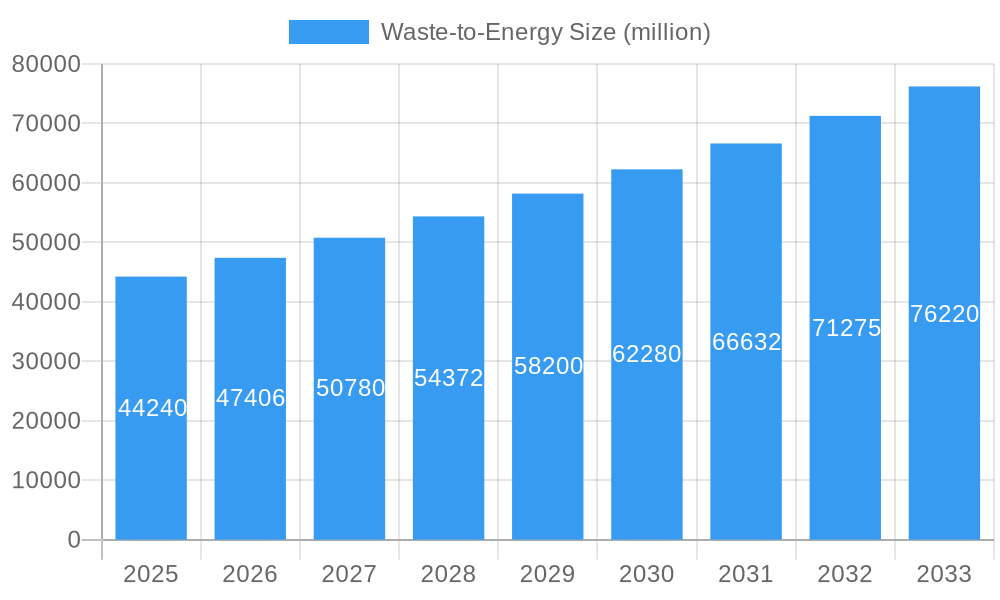
The waste-to-energy (WtE) market, currently valued at $44,240 million (2025), is projected to experience robust growth, driven by increasing urbanization, stringent environmental regulations, and the urgent need for sustainable waste management solutions. A Compound Annual Growth Rate (CAGR) of 7.1% from 2025 to 2033 signifies a significant expansion, with the market expected to surpass $80 billion by 2033. Key drivers include the escalating costs of landfilling, growing public awareness of environmental sustainability, and the potential for WtE to generate renewable energy and reduce greenhouse gas emissions. Technological advancements in waste treatment processes, including improved gasification and pyrolysis techniques, are further contributing to market expansion. While challenges remain, such as the high capital investment required for WtE plants and the potential for public resistance concerning siting and potential environmental impacts, the long-term outlook remains positive, fueled by supportive government policies promoting renewable energy sources and circular economy initiatives. The competitive landscape is characterized by a mix of large multinational corporations and regional players, with companies like Covanta, Suez, and Veolia holding significant market share. Future growth will likely be influenced by factors like technological innovation, regulatory changes, and the increasing adoption of sustainable waste management practices globally.
Waste-to-Energy Market Size (In Billion)
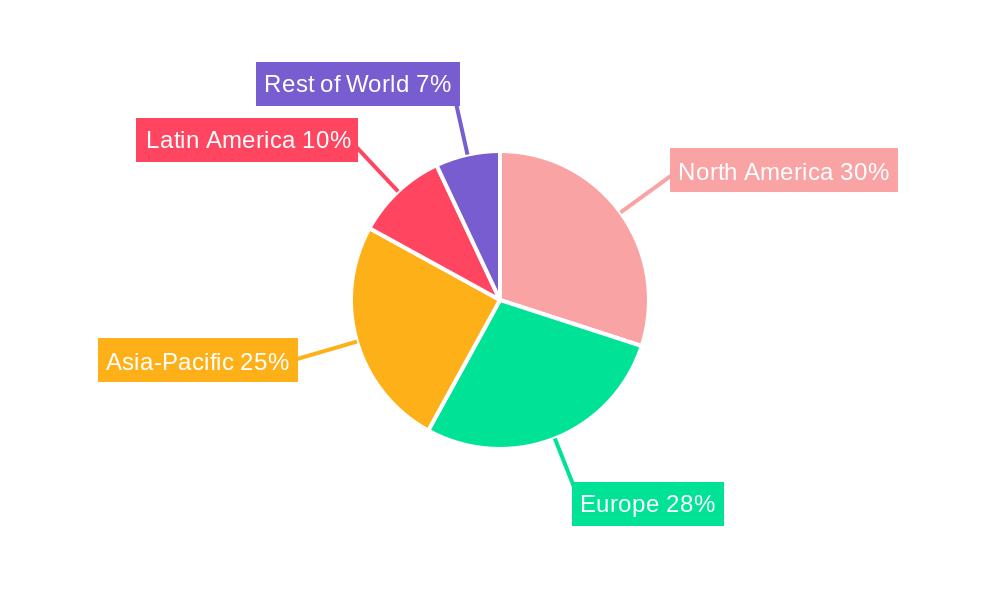
The geographic distribution of the WtE market is expected to be diverse, with developed regions like North America and Europe continuing to dominate due to established infrastructure and stringent environmental regulations. However, rapid economic growth and urbanization in developing economies in Asia-Pacific and Latin America will create significant new opportunities. These regions are likely to witness substantial investments in WtE infrastructure in the coming years, driven by the need to manage growing waste streams and meet the increasing energy demands. The segmentation of the market, while not fully detailed, will likely involve various waste types (municipal solid waste, industrial waste, etc.) and technologies employed (incineration, gasification, anaerobic digestion). This diversity necessitates a nuanced understanding of regional specifics and technological advancements to accurately forecast the market's trajectory.
Waste-to-Energy Company Market Share
Waste-to-Energy Market Report: 2019-2033 - A Comprehensive Analysis
Unlock the potential of the multi-billion dollar Waste-to-Energy market with this in-depth report, providing crucial insights for strategic decision-making. This comprehensive study analyzes market dynamics, leading players, technological advancements, and future growth prospects within the global Waste-to-Energy sector from 2019 to 2033. The report covers key segments, dominant regions, and emerging opportunities, empowering businesses to navigate the complexities of this rapidly evolving industry.
Study Period: 2019–2033; Base Year: 2025; Estimated Year: 2025; Forecast Period: 2025–2033; Historical Period: 2019–2024
Waste-to-Energy Market Dynamics & Concentration
This section analyzes the competitive landscape of the Waste-to-Energy market, evaluating market concentration, innovation, regulatory impacts, and mergers & acquisitions (M&A) activity. The global Waste-to-Energy market, valued at $XX billion in 2025, is expected to reach $XX billion by 2033, exhibiting a CAGR of XX%. Market concentration is moderate, with a few large players holding significant market share. Stringent environmental regulations are driving innovation and pushing companies toward more sustainable and efficient waste management solutions.
- Market Share: Covanta holds an estimated XX% market share, followed by Suez (XX%), and Veolia (XX%). Other key players, including WIN Waste Innovations, contribute to the remaining market share.
- M&A Activity: The historical period (2019-2024) witnessed approximately XX M&A deals, signaling consolidation within the industry. The forecast period is expected to see a similar or higher level of M&A activity, driven by expansion strategies and technological integration.
- Innovation Drivers: Technological advancements in gasification, pyrolysis, and anaerobic digestion are key innovation drivers, leading to improved energy efficiency and reduced emissions.
- Regulatory Frameworks: Government policies promoting renewable energy and waste reduction significantly influence market growth. Stringent emission standards are pushing companies to adopt cleaner technologies.
- Product Substitutes: While Waste-to-Energy offers a valuable solution for waste management and energy generation, other waste management methods such as landfill and recycling remain competitive.
- End-User Trends: Increasing awareness of environmental sustainability and the need for efficient waste management fuels the demand for Waste-to-Energy solutions across diverse end-user sectors.
Waste-to-Energy Industry Trends & Analysis
This section delves into the key trends shaping the Waste-to-Energy market. The industry is experiencing significant growth, propelled by factors such as increasing urbanization, rising waste generation, and the growing adoption of renewable energy sources. Technological innovations are transforming the sector, improving efficiency, and reducing environmental impact. Consumer preferences are also shifting towards sustainable waste management solutions, driving demand for innovative and eco-friendly technologies. The competitive landscape is characterized by both established players and emerging companies, leading to continuous technological advancements and market consolidation.
Leading Markets & Segments in Waste-to-Energy
Europe and North America currently dominate the global Waste-to-Energy market, driven by robust infrastructure, stringent environmental regulations, and supportive government policies. Asia-Pacific is expected to witness significant growth in the forecast period due to rapid urbanization and increasing industrialization.
- Key Drivers in Europe: Stringent environmental regulations, substantial investments in renewable energy infrastructure, and advanced waste management technologies contribute to the region's dominance.
- Key Drivers in North America: Government incentives promoting renewable energy, robust waste management infrastructure, and a strong focus on sustainable practices are driving market growth.
- Key Drivers in Asia-Pacific: Rapid urbanization, rising industrial activity, and government initiatives to reduce landfill waste are creating significant opportunities for Waste-to-Energy technologies. China, in particular, is a key market, with major players like China Everbright and Tianjin Teda driving significant growth.
Waste-to-Energy Product Developments
Recent product innovations focus on enhancing efficiency, reducing emissions, and diversifying energy outputs. Advancements in gasification and pyrolysis technologies are enabling higher energy recovery rates and producing valuable byproducts. The market is seeing increased integration of smart technologies and data analytics for optimized plant operation and improved waste management strategies. These developments offer significant competitive advantages, allowing companies to offer more sustainable and cost-effective solutions.
Key Drivers of Waste-to-Energy Growth
Several factors fuel the growth of the Waste-to-Energy market. Stringent environmental regulations globally are driving the adoption of cleaner technologies for waste management. The increasing focus on renewable energy and energy independence across countries contributes to the market's expansion. Technological advancements, particularly in gasification and anaerobic digestion, enhance efficiency and reduce emissions, making Waste-to-Energy a more attractive option. Economic incentives, like feed-in tariffs and carbon credits, further incentivize investment in Waste-to-Energy projects.
Challenges in the Waste-to-Energy Market
Despite its growth potential, the Waste-to-Energy market faces several challenges. High capital costs associated with setting up and maintaining Waste-to-Energy plants pose a significant barrier for smaller companies. The fluctuating prices of raw materials, like waste streams, can impact profitability. Obtaining necessary permits and navigating complex regulatory frameworks remains a hurdle for many projects. Furthermore, competition from other waste management technologies (landfills and recycling) influences market growth.
Emerging Opportunities in Waste-to-Energy
Long-term growth is propelled by technological advancements that enhance efficiency, reduce emissions, and diversify energy outputs. The development of new materials from waste through pyrolysis and gasification processes is also an exciting area. Strategic partnerships between waste management companies and energy producers will facilitate market expansion and resource optimization. Government initiatives to promote circular economy models and reduce reliance on landfills present further growth opportunities for the Waste-to-Energy market.
Key Milestones in Waste-to-Energy Industry
- 2020: Significant advancements in gasification technology improve energy efficiency and reduce greenhouse gas emissions.
- 2021: Several large-scale Waste-to-Energy projects commenced in Asia-Pacific, driven by government initiatives.
- 2022: A major merger between two leading players reshapes the market landscape.
- 2023: Launch of innovative waste sorting technologies that enhance the quality of waste suitable for energy recovery.
- 2024: Increased adoption of circular economy models promoting waste reduction and resource recovery.
Strategic Outlook for Waste-to-Energy Market
The Waste-to-Energy market is poised for substantial growth in the coming years. Technological innovation, coupled with supportive government policies, will drive market expansion. Strategic partnerships among industry players will accelerate the development and deployment of advanced technologies. Companies focusing on sustainability, efficiency, and technological leadership will dominate the market. The increasing demand for renewable energy sources and growing concerns over environmental sustainability will bolster demand for innovative Waste-to-Energy solutions, opening up lucrative opportunities for market players.
Waste-to-Energy Segmentation
-
1. Application
- 1.1. Waste Disposal
- 1.2. Energy
- 1.3. Others
-
2. Types
- 2.1. Thermal Technologies
- 2.2. Biochemical Reactions
Waste-to-Energy Segmentation By Geography
-
1. North America
- 1.1. United States
- 1.2. Canada
- 1.3. Mexico
-
2. South America
- 2.1. Brazil
- 2.2. Argentina
- 2.3. Rest of South America
-
3. Europe
- 3.1. United Kingdom
- 3.2. Germany
- 3.3. France
- 3.4. Italy
- 3.5. Spain
- 3.6. Russia
- 3.7. Benelux
- 3.8. Nordics
- 3.9. Rest of Europe
-
4. Middle East & Africa
- 4.1. Turkey
- 4.2. Israel
- 4.3. GCC
- 4.4. North Africa
- 4.5. South Africa
- 4.6. Rest of Middle East & Africa
-
5. Asia Pacific
- 5.1. China
- 5.2. India
- 5.3. Japan
- 5.4. South Korea
- 5.5. ASEAN
- 5.6. Oceania
- 5.7. Rest of Asia Pacific
Waste-to-Energy Regional Market Share
Geographic Coverage of Waste-to-Energy
Waste-to-Energy REPORT HIGHLIGHTS
| Aspects | Details |
|---|---|
| Study Period | 2020-2034 |
| Base Year | 2025 |
| Estimated Year | 2026 |
| Forecast Period | 2026-2034 |
| Historical Period | 2020-2025 |
| Growth Rate | CAGR of 7.1% from 2020-2034 |
| Segmentation |
|
Table of Contents
- 1. Introduction
- 1.1. Research Scope
- 1.2. Market Segmentation
- 1.3. Research Objective
- 1.4. Definitions and Assumptions
- 2. Executive Summary
- 2.1. Market Snapshot
- 3. Market Dynamics
- 3.1. Market Drivers
- 3.2. Market Restrains
- 3.3. Market Trends
- 3.4. Market Opportunities
- 4. Market Factor Analysis
- 4.1. Porters Five Forces
- 4.1.1. Bargaining Power of Suppliers
- 4.1.2. Bargaining Power of Buyers
- 4.1.3. Threat of New Entrants
- 4.1.4. Threat of Substitutes
- 4.1.5. Competitive Rivalry
- 4.2. PESTEL analysis
- 4.3. BCG Analysis
- 4.3.1. Stars (High Growth, High Market Share)
- 4.3.2. Cash Cows (Low Growth, High Market Share)
- 4.3.3. Question Mark (High Growth, Low Market Share)
- 4.3.4. Dogs (Low Growth, Low Market Share)
- 4.4. Ansoff Matrix Analysis
- 4.5. Supply Chain Analysis
- 4.6. Regulatory Landscape
- 4.7. Current Market Potential and Opportunity Assessment (TAM–SAM–SOM Framework)
- 4.8. MDP Analyst Note
- 4.1. Porters Five Forces
- 5. Market Analysis, Insights and Forecast 2021-2033
- 5.1. Market Analysis, Insights and Forecast - by Application
- 5.1.1. Waste Disposal
- 5.1.2. Energy
- 5.1.3. Others
- 5.2. Market Analysis, Insights and Forecast - by Types
- 5.2.1. Thermal Technologies
- 5.2.2. Biochemical Reactions
- 5.3. Market Analysis, Insights and Forecast - by Region
- 5.3.1. North America
- 5.3.2. South America
- 5.3.3. Europe
- 5.3.4. Middle East & Africa
- 5.3.5. Asia Pacific
- 5.1. Market Analysis, Insights and Forecast - by Application
- 6. Global Waste-to-Energy Analysis, Insights and Forecast, 2021-2033
- 6.1. Market Analysis, Insights and Forecast - by Application
- 6.1.1. Waste Disposal
- 6.1.2. Energy
- 6.1.3. Others
- 6.2. Market Analysis, Insights and Forecast - by Types
- 6.2.1. Thermal Technologies
- 6.2.2. Biochemical Reactions
- 6.1. Market Analysis, Insights and Forecast - by Application
- 7. North America Waste-to-Energy Analysis, Insights and Forecast, 2020-2032
- 7.1. Market Analysis, Insights and Forecast - by Application
- 7.1.1. Waste Disposal
- 7.1.2. Energy
- 7.1.3. Others
- 7.2. Market Analysis, Insights and Forecast - by Types
- 7.2.1. Thermal Technologies
- 7.2.2. Biochemical Reactions
- 7.1. Market Analysis, Insights and Forecast - by Application
- 8. South America Waste-to-Energy Analysis, Insights and Forecast, 2020-2032
- 8.1. Market Analysis, Insights and Forecast - by Application
- 8.1.1. Waste Disposal
- 8.1.2. Energy
- 8.1.3. Others
- 8.2. Market Analysis, Insights and Forecast - by Types
- 8.2.1. Thermal Technologies
- 8.2.2. Biochemical Reactions
- 8.1. Market Analysis, Insights and Forecast - by Application
- 9. Europe Waste-to-Energy Analysis, Insights and Forecast, 2020-2032
- 9.1. Market Analysis, Insights and Forecast - by Application
- 9.1.1. Waste Disposal
- 9.1.2. Energy
- 9.1.3. Others
- 9.2. Market Analysis, Insights and Forecast - by Types
- 9.2.1. Thermal Technologies
- 9.2.2. Biochemical Reactions
- 9.1. Market Analysis, Insights and Forecast - by Application
- 10. Middle East & Africa Waste-to-Energy Analysis, Insights and Forecast, 2020-2032
- 10.1. Market Analysis, Insights and Forecast - by Application
- 10.1.1. Waste Disposal
- 10.1.2. Energy
- 10.1.3. Others
- 10.2. Market Analysis, Insights and Forecast - by Types
- 10.2.1. Thermal Technologies
- 10.2.2. Biochemical Reactions
- 10.1. Market Analysis, Insights and Forecast - by Application
- 11. Asia Pacific Waste-to-Energy Analysis, Insights and Forecast, 2020-2032
- 11.1. Market Analysis, Insights and Forecast - by Application
- 11.1.1. Waste Disposal
- 11.1.2. Energy
- 11.1.3. Others
- 11.2. Market Analysis, Insights and Forecast - by Types
- 11.2.1. Thermal Technologies
- 11.2.2. Biochemical Reactions
- 11.1. Market Analysis, Insights and Forecast - by Application
- 12. Competitive Analysis
- 12.1. Company Profiles
- 12.1.1 Covanta
- 12.1.1.1. Company Overview
- 12.1.1.2. Products
- 12.1.1.3. Company Financials
- 12.1.1.4. SWOT Analysis
- 12.1.2 SUEZ
- 12.1.2.1. Company Overview
- 12.1.2.2. Products
- 12.1.2.3. Company Financials
- 12.1.2.4. SWOT Analysis
- 12.1.3 WIN Waste Innovations
- 12.1.3.1. Company Overview
- 12.1.3.2. Products
- 12.1.3.3. Company Financials
- 12.1.3.4. SWOT Analysis
- 12.1.4 Veolia
- 12.1.4.1. Company Overview
- 12.1.4.2. Products
- 12.1.4.3. Company Financials
- 12.1.4.4. SWOT Analysis
- 12.1.5 China Everbright
- 12.1.5.1. Company Overview
- 12.1.5.2. Products
- 12.1.5.3. Company Financials
- 12.1.5.4. SWOT Analysis
- 12.1.6 EEW
- 12.1.6.1. Company Overview
- 12.1.6.2. Products
- 12.1.6.3. Company Financials
- 12.1.6.4. SWOT Analysis
- 12.1.7 Attero
- 12.1.7.1. Company Overview
- 12.1.7.2. Products
- 12.1.7.3. Company Financials
- 12.1.7.4. SWOT Analysis
- 12.1.8 Paprec
- 12.1.8.1. Company Overview
- 12.1.8.2. Products
- 12.1.8.3. Company Financials
- 12.1.8.4. SWOT Analysis
- 12.1.9 AEB Amsterdam
- 12.1.9.1. Company Overview
- 12.1.9.2. Products
- 12.1.9.3. Company Financials
- 12.1.9.4. SWOT Analysis
- 12.1.10 Viridor
- 12.1.10.1. Company Overview
- 12.1.10.2. Products
- 12.1.10.3. Company Financials
- 12.1.10.4. SWOT Analysis
- 12.1.11 AVR
- 12.1.11.1. Company Overview
- 12.1.11.2. Products
- 12.1.11.3. Company Financials
- 12.1.11.4. SWOT Analysis
- 12.1.12 Tianjin Teda
- 12.1.12.1. Company Overview
- 12.1.12.2. Products
- 12.1.12.3. Company Financials
- 12.1.12.4. SWOT Analysis
- 12.1.13 Shanghai Environment
- 12.1.13.1. Company Overview
- 12.1.13.2. Products
- 12.1.13.3. Company Financials
- 12.1.13.4. SWOT Analysis
- 12.1.14 CNTY
- 12.1.14.1. Company Overview
- 12.1.14.2. Products
- 12.1.14.3. Company Financials
- 12.1.14.4. SWOT Analysis
- 12.1.15 Grandblue
- 12.1.15.1. Company Overview
- 12.1.15.2. Products
- 12.1.15.3. Company Financials
- 12.1.15.4. SWOT Analysis
- 12.1.16 Sanfeng Environment
- 12.1.16.1. Company Overview
- 12.1.16.2. Products
- 12.1.16.3. Company Financials
- 12.1.16.4. SWOT Analysis
- 12.1.1 Covanta
- 12.2. Market Entropy
- 12.2.1 Company's Key Areas Served
- 12.2.2 Recent Developments
- 12.3. Company Market Share Analysis 2025
- 12.3.1 Top 5 Companies Market Share Analysis
- 12.3.2 Top 3 Companies Market Share Analysis
- 12.4. List of Potential Customers
- 13. Research Methodology
List of Figures
- Figure 1: Global Waste-to-Energy Revenue Breakdown (million, %) by Region 2025 & 2033
- Figure 2: Global Waste-to-Energy Volume Breakdown (K, %) by Region 2025 & 2033
- Figure 3: North America Waste-to-Energy Revenue (million), by Application 2025 & 2033
- Figure 4: North America Waste-to-Energy Volume (K), by Application 2025 & 2033
- Figure 5: North America Waste-to-Energy Revenue Share (%), by Application 2025 & 2033
- Figure 6: North America Waste-to-Energy Volume Share (%), by Application 2025 & 2033
- Figure 7: North America Waste-to-Energy Revenue (million), by Types 2025 & 2033
- Figure 8: North America Waste-to-Energy Volume (K), by Types 2025 & 2033
- Figure 9: North America Waste-to-Energy Revenue Share (%), by Types 2025 & 2033
- Figure 10: North America Waste-to-Energy Volume Share (%), by Types 2025 & 2033
- Figure 11: North America Waste-to-Energy Revenue (million), by Country 2025 & 2033
- Figure 12: North America Waste-to-Energy Volume (K), by Country 2025 & 2033
- Figure 13: North America Waste-to-Energy Revenue Share (%), by Country 2025 & 2033
- Figure 14: North America Waste-to-Energy Volume Share (%), by Country 2025 & 2033
- Figure 15: South America Waste-to-Energy Revenue (million), by Application 2025 & 2033
- Figure 16: South America Waste-to-Energy Volume (K), by Application 2025 & 2033
- Figure 17: South America Waste-to-Energy Revenue Share (%), by Application 2025 & 2033
- Figure 18: South America Waste-to-Energy Volume Share (%), by Application 2025 & 2033
- Figure 19: South America Waste-to-Energy Revenue (million), by Types 2025 & 2033
- Figure 20: South America Waste-to-Energy Volume (K), by Types 2025 & 2033
- Figure 21: South America Waste-to-Energy Revenue Share (%), by Types 2025 & 2033
- Figure 22: South America Waste-to-Energy Volume Share (%), by Types 2025 & 2033
- Figure 23: South America Waste-to-Energy Revenue (million), by Country 2025 & 2033
- Figure 24: South America Waste-to-Energy Volume (K), by Country 2025 & 2033
- Figure 25: South America Waste-to-Energy Revenue Share (%), by Country 2025 & 2033
- Figure 26: South America Waste-to-Energy Volume Share (%), by Country 2025 & 2033
- Figure 27: Europe Waste-to-Energy Revenue (million), by Application 2025 & 2033
- Figure 28: Europe Waste-to-Energy Volume (K), by Application 2025 & 2033
- Figure 29: Europe Waste-to-Energy Revenue Share (%), by Application 2025 & 2033
- Figure 30: Europe Waste-to-Energy Volume Share (%), by Application 2025 & 2033
- Figure 31: Europe Waste-to-Energy Revenue (million), by Types 2025 & 2033
- Figure 32: Europe Waste-to-Energy Volume (K), by Types 2025 & 2033
- Figure 33: Europe Waste-to-Energy Revenue Share (%), by Types 2025 & 2033
- Figure 34: Europe Waste-to-Energy Volume Share (%), by Types 2025 & 2033
- Figure 35: Europe Waste-to-Energy Revenue (million), by Country 2025 & 2033
- Figure 36: Europe Waste-to-Energy Volume (K), by Country 2025 & 2033
- Figure 37: Europe Waste-to-Energy Revenue Share (%), by Country 2025 & 2033
- Figure 38: Europe Waste-to-Energy Volume Share (%), by Country 2025 & 2033
- Figure 39: Middle East & Africa Waste-to-Energy Revenue (million), by Application 2025 & 2033
- Figure 40: Middle East & Africa Waste-to-Energy Volume (K), by Application 2025 & 2033
- Figure 41: Middle East & Africa Waste-to-Energy Revenue Share (%), by Application 2025 & 2033
- Figure 42: Middle East & Africa Waste-to-Energy Volume Share (%), by Application 2025 & 2033
- Figure 43: Middle East & Africa Waste-to-Energy Revenue (million), by Types 2025 & 2033
- Figure 44: Middle East & Africa Waste-to-Energy Volume (K), by Types 2025 & 2033
- Figure 45: Middle East & Africa Waste-to-Energy Revenue Share (%), by Types 2025 & 2033
- Figure 46: Middle East & Africa Waste-to-Energy Volume Share (%), by Types 2025 & 2033
- Figure 47: Middle East & Africa Waste-to-Energy Revenue (million), by Country 2025 & 2033
- Figure 48: Middle East & Africa Waste-to-Energy Volume (K), by Country 2025 & 2033
- Figure 49: Middle East & Africa Waste-to-Energy Revenue Share (%), by Country 2025 & 2033
- Figure 50: Middle East & Africa Waste-to-Energy Volume Share (%), by Country 2025 & 2033
- Figure 51: Asia Pacific Waste-to-Energy Revenue (million), by Application 2025 & 2033
- Figure 52: Asia Pacific Waste-to-Energy Volume (K), by Application 2025 & 2033
- Figure 53: Asia Pacific Waste-to-Energy Revenue Share (%), by Application 2025 & 2033
- Figure 54: Asia Pacific Waste-to-Energy Volume Share (%), by Application 2025 & 2033
- Figure 55: Asia Pacific Waste-to-Energy Revenue (million), by Types 2025 & 2033
- Figure 56: Asia Pacific Waste-to-Energy Volume (K), by Types 2025 & 2033
- Figure 57: Asia Pacific Waste-to-Energy Revenue Share (%), by Types 2025 & 2033
- Figure 58: Asia Pacific Waste-to-Energy Volume Share (%), by Types 2025 & 2033
- Figure 59: Asia Pacific Waste-to-Energy Revenue (million), by Country 2025 & 2033
- Figure 60: Asia Pacific Waste-to-Energy Volume (K), by Country 2025 & 2033
- Figure 61: Asia Pacific Waste-to-Energy Revenue Share (%), by Country 2025 & 2033
- Figure 62: Asia Pacific Waste-to-Energy Volume Share (%), by Country 2025 & 2033
List of Tables
- Table 1: Global Waste-to-Energy Revenue million Forecast, by Application 2020 & 2033
- Table 2: Global Waste-to-Energy Volume K Forecast, by Application 2020 & 2033
- Table 3: Global Waste-to-Energy Revenue million Forecast, by Types 2020 & 2033
- Table 4: Global Waste-to-Energy Volume K Forecast, by Types 2020 & 2033
- Table 5: Global Waste-to-Energy Revenue million Forecast, by Region 2020 & 2033
- Table 6: Global Waste-to-Energy Volume K Forecast, by Region 2020 & 2033
- Table 7: Global Waste-to-Energy Revenue million Forecast, by Application 2020 & 2033
- Table 8: Global Waste-to-Energy Volume K Forecast, by Application 2020 & 2033
- Table 9: Global Waste-to-Energy Revenue million Forecast, by Types 2020 & 2033
- Table 10: Global Waste-to-Energy Volume K Forecast, by Types 2020 & 2033
- Table 11: Global Waste-to-Energy Revenue million Forecast, by Country 2020 & 2033
- Table 12: Global Waste-to-Energy Volume K Forecast, by Country 2020 & 2033
- Table 13: United States Waste-to-Energy Revenue (million) Forecast, by Application 2020 & 2033
- Table 14: United States Waste-to-Energy Volume (K) Forecast, by Application 2020 & 2033
- Table 15: Canada Waste-to-Energy Revenue (million) Forecast, by Application 2020 & 2033
- Table 16: Canada Waste-to-Energy Volume (K) Forecast, by Application 2020 & 2033
- Table 17: Mexico Waste-to-Energy Revenue (million) Forecast, by Application 2020 & 2033
- Table 18: Mexico Waste-to-Energy Volume (K) Forecast, by Application 2020 & 2033
- Table 19: Global Waste-to-Energy Revenue million Forecast, by Application 2020 & 2033
- Table 20: Global Waste-to-Energy Volume K Forecast, by Application 2020 & 2033
- Table 21: Global Waste-to-Energy Revenue million Forecast, by Types 2020 & 2033
- Table 22: Global Waste-to-Energy Volume K Forecast, by Types 2020 & 2033
- Table 23: Global Waste-to-Energy Revenue million Forecast, by Country 2020 & 2033
- Table 24: Global Waste-to-Energy Volume K Forecast, by Country 2020 & 2033
- Table 25: Brazil Waste-to-Energy Revenue (million) Forecast, by Application 2020 & 2033
- Table 26: Brazil Waste-to-Energy Volume (K) Forecast, by Application 2020 & 2033
- Table 27: Argentina Waste-to-Energy Revenue (million) Forecast, by Application 2020 & 2033
- Table 28: Argentina Waste-to-Energy Volume (K) Forecast, by Application 2020 & 2033
- Table 29: Rest of South America Waste-to-Energy Revenue (million) Forecast, by Application 2020 & 2033
- Table 30: Rest of South America Waste-to-Energy Volume (K) Forecast, by Application 2020 & 2033
- Table 31: Global Waste-to-Energy Revenue million Forecast, by Application 2020 & 2033
- Table 32: Global Waste-to-Energy Volume K Forecast, by Application 2020 & 2033
- Table 33: Global Waste-to-Energy Revenue million Forecast, by Types 2020 & 2033
- Table 34: Global Waste-to-Energy Volume K Forecast, by Types 2020 & 2033
- Table 35: Global Waste-to-Energy Revenue million Forecast, by Country 2020 & 2033
- Table 36: Global Waste-to-Energy Volume K Forecast, by Country 2020 & 2033
- Table 37: United Kingdom Waste-to-Energy Revenue (million) Forecast, by Application 2020 & 2033
- Table 38: United Kingdom Waste-to-Energy Volume (K) Forecast, by Application 2020 & 2033
- Table 39: Germany Waste-to-Energy Revenue (million) Forecast, by Application 2020 & 2033
- Table 40: Germany Waste-to-Energy Volume (K) Forecast, by Application 2020 & 2033
- Table 41: France Waste-to-Energy Revenue (million) Forecast, by Application 2020 & 2033
- Table 42: France Waste-to-Energy Volume (K) Forecast, by Application 2020 & 2033
- Table 43: Italy Waste-to-Energy Revenue (million) Forecast, by Application 2020 & 2033
- Table 44: Italy Waste-to-Energy Volume (K) Forecast, by Application 2020 & 2033
- Table 45: Spain Waste-to-Energy Revenue (million) Forecast, by Application 2020 & 2033
- Table 46: Spain Waste-to-Energy Volume (K) Forecast, by Application 2020 & 2033
- Table 47: Russia Waste-to-Energy Revenue (million) Forecast, by Application 2020 & 2033
- Table 48: Russia Waste-to-Energy Volume (K) Forecast, by Application 2020 & 2033
- Table 49: Benelux Waste-to-Energy Revenue (million) Forecast, by Application 2020 & 2033
- Table 50: Benelux Waste-to-Energy Volume (K) Forecast, by Application 2020 & 2033
- Table 51: Nordics Waste-to-Energy Revenue (million) Forecast, by Application 2020 & 2033
- Table 52: Nordics Waste-to-Energy Volume (K) Forecast, by Application 2020 & 2033
- Table 53: Rest of Europe Waste-to-Energy Revenue (million) Forecast, by Application 2020 & 2033
- Table 54: Rest of Europe Waste-to-Energy Volume (K) Forecast, by Application 2020 & 2033
- Table 55: Global Waste-to-Energy Revenue million Forecast, by Application 2020 & 2033
- Table 56: Global Waste-to-Energy Volume K Forecast, by Application 2020 & 2033
- Table 57: Global Waste-to-Energy Revenue million Forecast, by Types 2020 & 2033
- Table 58: Global Waste-to-Energy Volume K Forecast, by Types 2020 & 2033
- Table 59: Global Waste-to-Energy Revenue million Forecast, by Country 2020 & 2033
- Table 60: Global Waste-to-Energy Volume K Forecast, by Country 2020 & 2033
- Table 61: Turkey Waste-to-Energy Revenue (million) Forecast, by Application 2020 & 2033
- Table 62: Turkey Waste-to-Energy Volume (K) Forecast, by Application 2020 & 2033
- Table 63: Israel Waste-to-Energy Revenue (million) Forecast, by Application 2020 & 2033
- Table 64: Israel Waste-to-Energy Volume (K) Forecast, by Application 2020 & 2033
- Table 65: GCC Waste-to-Energy Revenue (million) Forecast, by Application 2020 & 2033
- Table 66: GCC Waste-to-Energy Volume (K) Forecast, by Application 2020 & 2033
- Table 67: North Africa Waste-to-Energy Revenue (million) Forecast, by Application 2020 & 2033
- Table 68: North Africa Waste-to-Energy Volume (K) Forecast, by Application 2020 & 2033
- Table 69: South Africa Waste-to-Energy Revenue (million) Forecast, by Application 2020 & 2033
- Table 70: South Africa Waste-to-Energy Volume (K) Forecast, by Application 2020 & 2033
- Table 71: Rest of Middle East & Africa Waste-to-Energy Revenue (million) Forecast, by Application 2020 & 2033
- Table 72: Rest of Middle East & Africa Waste-to-Energy Volume (K) Forecast, by Application 2020 & 2033
- Table 73: Global Waste-to-Energy Revenue million Forecast, by Application 2020 & 2033
- Table 74: Global Waste-to-Energy Volume K Forecast, by Application 2020 & 2033
- Table 75: Global Waste-to-Energy Revenue million Forecast, by Types 2020 & 2033
- Table 76: Global Waste-to-Energy Volume K Forecast, by Types 2020 & 2033
- Table 77: Global Waste-to-Energy Revenue million Forecast, by Country 2020 & 2033
- Table 78: Global Waste-to-Energy Volume K Forecast, by Country 2020 & 2033
- Table 79: China Waste-to-Energy Revenue (million) Forecast, by Application 2020 & 2033
- Table 80: China Waste-to-Energy Volume (K) Forecast, by Application 2020 & 2033
- Table 81: India Waste-to-Energy Revenue (million) Forecast, by Application 2020 & 2033
- Table 82: India Waste-to-Energy Volume (K) Forecast, by Application 2020 & 2033
- Table 83: Japan Waste-to-Energy Revenue (million) Forecast, by Application 2020 & 2033
- Table 84: Japan Waste-to-Energy Volume (K) Forecast, by Application 2020 & 2033
- Table 85: South Korea Waste-to-Energy Revenue (million) Forecast, by Application 2020 & 2033
- Table 86: South Korea Waste-to-Energy Volume (K) Forecast, by Application 2020 & 2033
- Table 87: ASEAN Waste-to-Energy Revenue (million) Forecast, by Application 2020 & 2033
- Table 88: ASEAN Waste-to-Energy Volume (K) Forecast, by Application 2020 & 2033
- Table 89: Oceania Waste-to-Energy Revenue (million) Forecast, by Application 2020 & 2033
- Table 90: Oceania Waste-to-Energy Volume (K) Forecast, by Application 2020 & 2033
- Table 91: Rest of Asia Pacific Waste-to-Energy Revenue (million) Forecast, by Application 2020 & 2033
- Table 92: Rest of Asia Pacific Waste-to-Energy Volume (K) Forecast, by Application 2020 & 2033
Frequently Asked Questions
1. What is the projected Compound Annual Growth Rate (CAGR) of the Waste-to-Energy?
The projected CAGR is approximately 7.1%.
2. Which companies are prominent players in the Waste-to-Energy?
Key companies in the market include Covanta, SUEZ, WIN Waste Innovations, Veolia, China Everbright, EEW, Attero, Paprec, AEB Amsterdam, Viridor, AVR, Tianjin Teda, Shanghai Environment, CNTY, Grandblue, Sanfeng Environment.
3. What are the main segments of the Waste-to-Energy?
The market segments include Application, Types.
4. Can you provide details about the market size?
The market size is estimated to be USD 44240 million as of 2022.
5. What are some drivers contributing to market growth?
N/A
6. What are the notable trends driving market growth?
N/A
7. Are there any restraints impacting market growth?
N/A
8. Can you provide examples of recent developments in the market?
N/A
9. What pricing options are available for accessing the report?
Pricing options include single-user, multi-user, and enterprise licenses priced at USD 3950.00, USD 5925.00, and USD 7900.00 respectively.
10. Is the market size provided in terms of value or volume?
The market size is provided in terms of value, measured in million and volume, measured in K.
11. Are there any specific market keywords associated with the report?
Yes, the market keyword associated with the report is "Waste-to-Energy," which aids in identifying and referencing the specific market segment covered.
12. How do I determine which pricing option suits my needs best?
The pricing options vary based on user requirements and access needs. Individual users may opt for single-user licenses, while businesses requiring broader access may choose multi-user or enterprise licenses for cost-effective access to the report.
13. Are there any additional resources or data provided in the Waste-to-Energy report?
While the report offers comprehensive insights, it's advisable to review the specific contents or supplementary materials provided to ascertain if additional resources or data are available.
14. How can I stay updated on further developments or reports in the Waste-to-Energy?
To stay informed about further developments, trends, and reports in the Waste-to-Energy, consider subscribing to industry newsletters, following relevant companies and organizations, or regularly checking reputable industry news sources and publications.
Methodology
Step 1 - Identification of Relevant Samples Size from Population Database


Step 2 - Approaches for Defining Global Market Size (Value, Volume* & Price*)

Note*: In applicable scenarios
Step 3 - Data Sources
Primary Research
- Web Analytics
- Survey Reports
- Research Institute
- Latest Research Reports
- Opinion Leaders
Secondary Research
- Annual Reports
- White Paper
- Latest Press Release
- Industry Association
- Paid Database
- Investor Presentations

Step 4 - Data Triangulation
Involves using different sources of information in order to increase the validity of a study
These sources are likely to be stakeholders in a program - participants, other researchers, program staff, other community members, and so on.
Then we put all data in single framework & apply various statistical tools to find out the dynamic on the market.
During the analysis stage, feedback from the stakeholder groups would be compared to determine areas of agreement as well as areas of divergence