

Key Insights
The global market for Ultrathin and Superlight Solar Cells is poised for significant expansion, projected to reach USD 15.12 billion in 2025. This robust growth is driven by an estimated Compound Annual Growth Rate (CAGR) of 7.49%, indicating a dynamic and evolving industry. A primary driver for this market is the increasing demand for lightweight and flexible solar solutions across various sectors. The burgeoning renewable energy sector, coupled with government initiatives promoting solar adoption, further bolsters market expansion. Emerging applications in portable electronics, wearable technology, and the Internet of Things (IoT) are creating new avenues for ultrathin and superlight solar cells, demanding solutions that offer both high efficiency and minimal weight. The technological advancements in materials science and manufacturing processes are also contributing to improved performance and cost-effectiveness, making these solar cells more competitive.

Ultrathin and Superlight Solar Cells Market Size (In Billion)
The market's trajectory is further shaped by key trends, including the integration of these advanced solar cells into building-integrated photovoltaics (BIPV) and the development of transparent and semi-transparent solar technologies for architectural applications. While the market enjoys strong growth, it faces certain restraints such as the higher initial manufacturing costs compared to traditional silicon solar cells, though this gap is narrowing. Additionally, the performance and durability of some ultrathin and superlight solar technologies in extreme environmental conditions are areas of ongoing research and development. Despite these challenges, the inherent advantages of flexibility, light weight, and diverse application potential position the Ultrathin and Superlight Solar Cells market for sustained and accelerated growth, with significant opportunities arising from the energy transition and the demand for innovative power solutions in diverse end-user industries.

Ultrathin and Superlight Solar Cells Company Market Share
This comprehensive report, "Ultrathin and Superlight Solar Cells Market Dynamics & Concentration," delves into the transformative landscape of advanced solar technology. Spanning a study period from 2019 to 2033, with a base year of 2025 and a forecast period from 2025 to 2033, this analysis provides critical insights into a market poised for exponential growth. We meticulously examine the innovation drivers, regulatory frameworks, and evolving end-user trends that are shaping the adoption of ultrathin and superlight solar cells across diverse industries. With a focus on actionable intelligence, this report equips stakeholders with the knowledge to navigate market concentration, identify innovation drivers, and capitalize on emerging opportunities. The estimated market size for 2025 is valued at over $50 billion, with a projected Compound Annual Growth Rate (CAGR) of approximately 25% during the forecast period.
Ultrathin and Superlight Solar Cells Market Dynamics & Concentration
The ultrathin and superlight solar cells market is characterized by dynamic growth, driven by continuous innovation and a burgeoning demand for flexible, lightweight photovoltaic solutions. Market concentration is gradually shifting as key players invest heavily in research and development. Currently, the top five companies, including Jinko Solar, Trina Solar, and First Solar, hold a combined market share of roughly 65% as of 2025. However, the landscape is becoming more competitive with the emergence of specialized manufacturers and advancements in material science. Innovation drivers are primarily centered around improving power conversion efficiency (PCE), enhancing durability, and reducing manufacturing costs. Regulatory frameworks globally are increasingly favoring renewable energy integration, providing a significant tailwind. Product substitutes, such as traditional rigid solar panels, are facing competition from the unique advantages of ultrathin and superlight cells, particularly in niche applications. End-user trends are rapidly evolving, with growing interest from the automotive, aviation, and portable electronics sectors. Merger and acquisition (M&A) activities are expected to increase, with an estimated 10-15 significant deals anticipated between 2025 and 2033, aiming to consolidate expertise and expand market reach. The market penetration of these advanced solar technologies is projected to reach over 15% of the total solar market by 2033.
Ultrathin and Superlight Solar Cells Industry Trends & Analysis
The ultrathin and superlight solar cells industry is on an unprecedented growth trajectory, fueled by a confluence of technological advancements, favorable economic policies, and increasing environmental consciousness. The fundamental market growth drivers revolve around the unparalleled advantages offered by these advanced photovoltaic materials: their reduced weight, enhanced flexibility, and customizable form factors. These attributes make them ideal for applications where traditional rigid solar panels are impractical or impossible to implement. Technological disruptions are a constant feature, with ongoing breakthroughs in perovskite solar cells, organic photovoltaics (OPVs), and advanced thin-film technologies consistently pushing the boundaries of power conversion efficiency (PCE) and longevity. PCEs are expected to surpass 30% for some emerging technologies by 2033, a significant leap from current levels. Consumer preferences are shifting towards integrated and aesthetically pleasing solar solutions, a demand that ultrathin and superlight cells are uniquely positioned to meet, especially in the consumer electronics and building-integrated photovoltaics (BIPV) sectors. The competitive dynamics are intensifying, with established solar giants like Jinko Solar, Trina Solar, and Canadian Solar investing aggressively in R&D and production capacity, alongside innovative startups focusing on niche markets. The estimated market size for ultrathin and superlight solar cells is projected to reach over $100 billion by 2033, with a robust CAGR of approximately 25% from 2025 to 2033. Market penetration is projected to reach over 15% of the total solar market by 2033, indicating a substantial shift in market share from conventional technologies. This growth is further bolstered by government incentives and mandates aimed at accelerating renewable energy adoption.
Leading Markets & Segments in Ultrathin and Superlight Solar Cells
The dominance of specific markets and segments within the ultrathin and superlight solar cells sector is a critical indicator of current and future growth potential. Geographically, Asia-Pacific, particularly China, is the leading market, driven by robust manufacturing capabilities, government support, and extensive adoption across various applications. North America and Europe are also significant markets, fueled by stringent environmental regulations and a strong push for renewable energy integration in the automotive and construction industries.
Application Segments:
- Automotive: This segment is witnessing rapid growth due to the increasing demand for electric vehicles (EVs) with integrated solar charging capabilities and reduced vehicle weight for improved efficiency. The potential to power auxiliary systems or even contribute to primary charging is a key driver.
- Aviation: Ultralight solar cells are crucial for powering unmanned aerial vehicles (UAVs) and enabling longer flight times for solar-powered aircraft. Their minimal weight is paramount in this sector.
- Marine: Applications range from powering onboard electronics in recreational boats to supporting autonomous maritime vessels and offshore oil and gas platforms, where weight and durability are critical considerations.
- Oil And Gas: Integration into remote exploration and production facilities for power generation, reducing reliance on traditional fossil fuels for off-grid operations.
- Chemical: Powering sensors, monitoring equipment, and remote facilities within chemical plants, offering a safe and reliable energy source in potentially hazardous environments.
- Power: While traditional solar dominates large-scale power generation, ultrathin and superlight cells are carving out niches in distributed generation, portable power solutions, and specialized grid applications.
Types of Solar Cells:
- Thin Film Solar Cells: This category is the most dominant within the ultrathin and superlight solar cells market. This includes technologies like Cadmium Telluride (CdTe), Copper Indium Gallium Selenide (CIGS), and amorphous silicon, which are inherently flexible and lightweight.
- Monocrystalline Solar Cells: Advancements in wafer thinning and flexible substrate integration are enabling the development of ultrathin monocrystalline cells, offering higher efficiency but with manufacturing challenges for extreme flexibility.
- Polycrystalline Solar Cells: While less common in the ultralight category compared to thin films, advancements in cell processing are also being explored for thinner and lighter polycrystalline modules.
The dominance analysis reveals that the Automotive and Aviation sectors, driven by their stringent weight requirements and the pursuit of enhanced efficiency and range, are emerging as high-potential growth areas for ultrathin and superlight solar cells. Economic policies supporting electric vehicle adoption and drone technology development are significant drivers. Infrastructure development for charging stations and the increasing use of UAVs for surveillance and delivery services further bolster these segments. The Thin Film Solar Cell type is the undisputed leader, constituting over 80% of the current market share due to its inherent properties.
Ultrathin and Superlight Solar Cells Product Developments
Product development in the ultrathin and superlight solar cells sector is characterized by a relentless pursuit of enhanced efficiency, flexibility, and durability. Innovations are focusing on advanced materials like perovskites and organic semiconductors to achieve higher power conversion efficiencies (PCEs) exceeding 25% in laboratory settings and paving the way for commercial applications. The competitive advantage lies in their lightweight nature, allowing for seamless integration into diverse applications such as wearable electronics, self-powered sensors, and aesthetically integrated building materials. Market fit is being broadened by reducing manufacturing costs and increasing scalability.
Key Drivers of Ultrathin and Superlight Solar Cells Growth
The growth of the ultrathin and superlight solar cells market is propelled by a synergistic interplay of technological, economic, and regulatory factors. Technologically, breakthroughs in material science are yielding higher power conversion efficiencies (PCEs) and improved durability, making these cells more commercially viable. Economically, the declining cost of manufacturing and the increasing demand for lightweight, flexible energy solutions across various sectors are significant catalysts. Regulatory support, including government incentives for renewable energy adoption and mandates for energy efficiency, further accelerates market penetration. The integration of these cells into electric vehicles and portable electronics also drives demand.
Challenges in the Ultrathin and Superlight Solar Cells Market
Despite robust growth, the ultrathin and superlight solar cells market faces several challenges. Regulatory hurdles related to safety standards and grid integration for novel photovoltaic technologies can slow adoption. Supply chain issues, particularly for raw materials like rare earth elements and specialized manufacturing equipment, can impact scalability and cost-effectiveness. Competitive pressures from established rigid solar panel manufacturers and the need for significant upfront investment in new manufacturing processes also pose barriers. Ensuring long-term degradation rates and performance in diverse environmental conditions remains an ongoing area of research and development, with an estimated 5-10% potential impact on market adoption if not addressed effectively.
Emerging Opportunities in Ultrathin and Superlight Solar Cells
Catalysts for long-term growth in the ultrathin and superlight solar cells market are abundant, driven by technological breakthroughs and expanding application frontiers. The maturation of perovskite solar cell technology promises cost-effective, high-efficiency solutions, while advancements in roll-to-roll manufacturing are poised to drastically reduce production costs. Strategic partnerships between material suppliers, cell manufacturers, and end-user industries are crucial for co-development and market entry. Market expansion into emerging economies and new sectors like aerospace and smart textiles represents significant untapped potential, with projections indicating an additional $30 billion market expansion by 2033.
Leading Players in the Ultrathin and Superlight Solar Cells Sector
- Mitsubishi Electric Corporation
- Jinko Solar
- Trina Solar
- Canadian Solar
- First Solar
- Moser Baer India Ltd.
- Yingli Solar
- SunPower Corporation
- Sunedison, Inc.
- Indosolar
- Tata Power Solar Systems Ltd.
- GreenBrilliance
- SolarWorld
Key Milestones in Ultrathin and Superlight Solar Cells Industry
- 2019: Significant advancements in perovskite solar cell stability, reaching over 1,000 hours of operational life in laboratory conditions.
- 2020: First commercial application of ultrathin solar cells in a consumer drone, demonstrating extended flight capabilities.
- 2021: Major breakthroughs in roll-to-roll manufacturing processes for organic photovoltaics, promising cost reductions.
- 2022: Key automotive manufacturers announce pilot programs for integrating thin-film solar panels into electric vehicle roofs.
- 2023: Major solar manufacturers begin significant R&D investment into flexible and ultralight solar technologies, signaling industry shift.
- 2024: Launch of first-generation building-integrated ultrathin solar panels with improved aesthetics and performance.
- 2025 (Projected): Expectation of significant market growth acceleration as manufacturing scalability improves and efficiency benchmarks are met for wider commercial adoption.
Strategic Outlook for Ultrathin and Superlight Solar Cells Market
The strategic outlook for the ultrathin and superlight solar cells market is overwhelmingly positive, driven by ongoing technological innovation and increasing demand for versatile energy solutions. Growth accelerators include the continued development of higher efficiency, more durable materials, and cost-effective manufacturing techniques, such as advanced roll-to-roll processing. The expanding application scope across automotive, aviation, and the Internet of Things (IoT) presents immense future market potential. Strategic opportunities lie in fostering collaborations between research institutions, material developers, and industry leaders to expedite product commercialization and market penetration, aiming for a sustained market expansion valued at over $150 billion by 2033.
Ultrathin and Superlight Solar Cells Segmentation
-
1. Application
- 1.1. Automotive
- 1.2. Aviation
- 1.3. Marine
- 1.4. Oil And Gas
- 1.5. Chemical
- 1.6. Power
-
2. Types
- 2.1. Monocrystalline Solar Cells
- 2.2. Polycrystalline Solar Cells
- 2.3. Thin Film Solar Cells
Ultrathin and Superlight Solar Cells Segmentation By Geography
-
1. North America
- 1.1. United States
- 1.2. Canada
- 1.3. Mexico
-
2. South America
- 2.1. Brazil
- 2.2. Argentina
- 2.3. Rest of South America
-
3. Europe
- 3.1. United Kingdom
- 3.2. Germany
- 3.3. France
- 3.4. Italy
- 3.5. Spain
- 3.6. Russia
- 3.7. Benelux
- 3.8. Nordics
- 3.9. Rest of Europe
-
4. Middle East & Africa
- 4.1. Turkey
- 4.2. Israel
- 4.3. GCC
- 4.4. North Africa
- 4.5. South Africa
- 4.6. Rest of Middle East & Africa
-
5. Asia Pacific
- 5.1. China
- 5.2. India
- 5.3. Japan
- 5.4. South Korea
- 5.5. ASEAN
- 5.6. Oceania
- 5.7. Rest of Asia Pacific
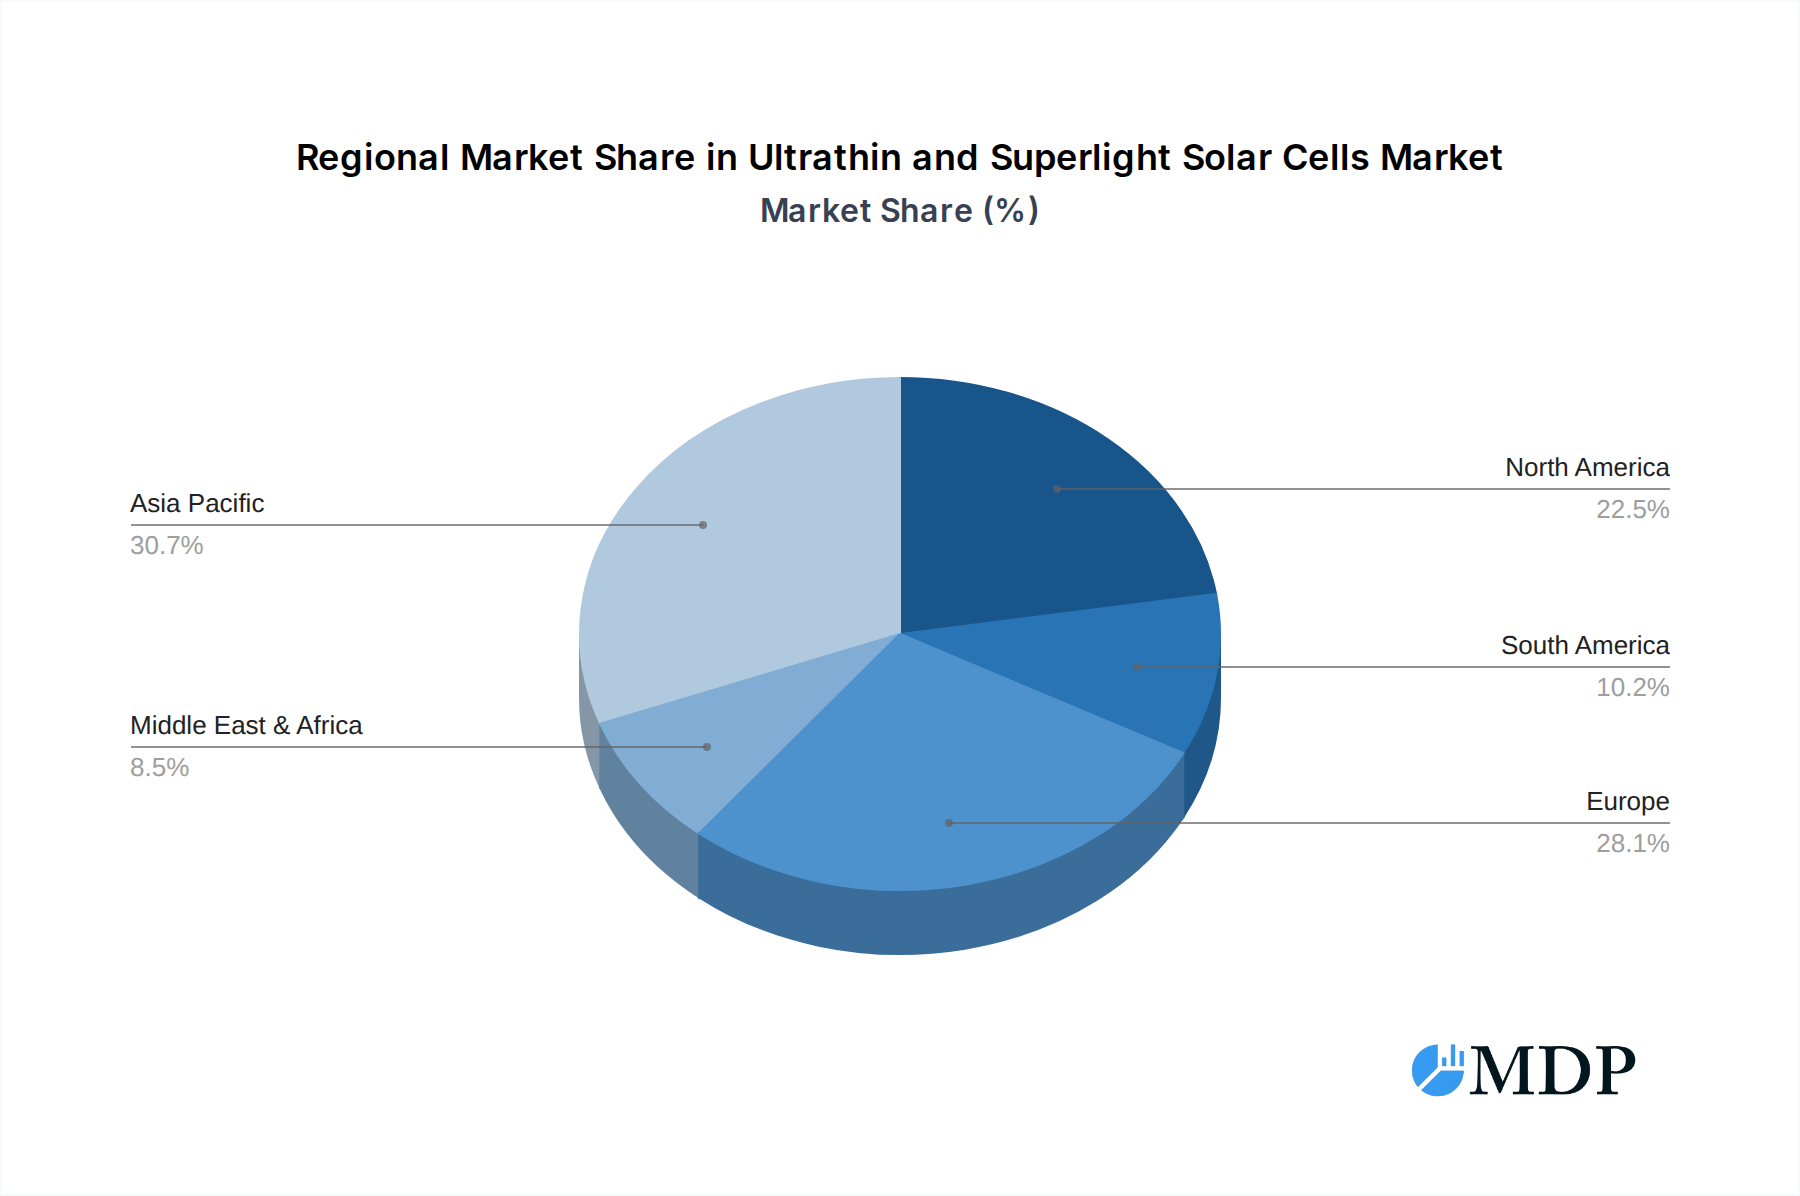
Ultrathin and Superlight Solar Cells Regional Market Share
Geographic Coverage of Ultrathin and Superlight Solar Cells
Ultrathin and Superlight Solar Cells REPORT HIGHLIGHTS
| Aspects | Details |
|---|---|
| Study Period | 2020-2034 |
| Base Year | 2025 |
| Estimated Year | 2026 |
| Forecast Period | 2026-2034 |
| Historical Period | 2020-2025 |
| Growth Rate | CAGR of 7.49% from 2020-2034 |
| Segmentation |
|
Table of Contents
- 1. Introduction
- 1.1. Research Scope
- 1.2. Market Segmentation
- 1.3. Research Objective
- 1.4. Definitions and Assumptions
- 2. Executive Summary
- 2.1. Market Snapshot
- 3. Market Dynamics
- 3.1. Market Drivers
- 3.2. Market Restrains
- 3.3. Market Trends
- 3.4. Market Opportunities
- 4. Market Factor Analysis
- 4.1. Porters Five Forces
- 4.1.1. Bargaining Power of Suppliers
- 4.1.2. Bargaining Power of Buyers
- 4.1.3. Threat of New Entrants
- 4.1.4. Threat of Substitutes
- 4.1.5. Competitive Rivalry
- 4.2. PESTEL analysis
- 4.3. BCG Analysis
- 4.3.1. Stars (High Growth, High Market Share)
- 4.3.2. Cash Cows (Low Growth, High Market Share)
- 4.3.3. Question Mark (High Growth, Low Market Share)
- 4.3.4. Dogs (Low Growth, Low Market Share)
- 4.4. Ansoff Matrix Analysis
- 4.5. Supply Chain Analysis
- 4.6. Regulatory Landscape
- 4.7. Current Market Potential and Opportunity Assessment (TAM–SAM–SOM Framework)
- 4.8. MDP Analyst Note
- 4.1. Porters Five Forces
- 5. Market Analysis, Insights and Forecast 2021-2033
- 5.1. Market Analysis, Insights and Forecast - by Application
- 5.1.1. Automotive
- 5.1.2. Aviation
- 5.1.3. Marine
- 5.1.4. Oil And Gas
- 5.1.5. Chemical
- 5.1.6. Power
- 5.2. Market Analysis, Insights and Forecast - by Types
- 5.2.1. Monocrystalline Solar Cells
- 5.2.2. Polycrystalline Solar Cells
- 5.2.3. Thin Film Solar Cells
- 5.3. Market Analysis, Insights and Forecast - by Region
- 5.3.1. North America
- 5.3.2. South America
- 5.3.3. Europe
- 5.3.4. Middle East & Africa
- 5.3.5. Asia Pacific
- 5.1. Market Analysis, Insights and Forecast - by Application
- 6. Global Ultrathin and Superlight Solar Cells Analysis, Insights and Forecast, 2021-2033
- 6.1. Market Analysis, Insights and Forecast - by Application
- 6.1.1. Automotive
- 6.1.2. Aviation
- 6.1.3. Marine
- 6.1.4. Oil And Gas
- 6.1.5. Chemical
- 6.1.6. Power
- 6.2. Market Analysis, Insights and Forecast - by Types
- 6.2.1. Monocrystalline Solar Cells
- 6.2.2. Polycrystalline Solar Cells
- 6.2.3. Thin Film Solar Cells
- 6.1. Market Analysis, Insights and Forecast - by Application
- 7. North America Ultrathin and Superlight Solar Cells Analysis, Insights and Forecast, 2020-2032
- 7.1. Market Analysis, Insights and Forecast - by Application
- 7.1.1. Automotive
- 7.1.2. Aviation
- 7.1.3. Marine
- 7.1.4. Oil And Gas
- 7.1.5. Chemical
- 7.1.6. Power
- 7.2. Market Analysis, Insights and Forecast - by Types
- 7.2.1. Monocrystalline Solar Cells
- 7.2.2. Polycrystalline Solar Cells
- 7.2.3. Thin Film Solar Cells
- 7.1. Market Analysis, Insights and Forecast - by Application
- 8. South America Ultrathin and Superlight Solar Cells Analysis, Insights and Forecast, 2020-2032
- 8.1. Market Analysis, Insights and Forecast - by Application
- 8.1.1. Automotive
- 8.1.2. Aviation
- 8.1.3. Marine
- 8.1.4. Oil And Gas
- 8.1.5. Chemical
- 8.1.6. Power
- 8.2. Market Analysis, Insights and Forecast - by Types
- 8.2.1. Monocrystalline Solar Cells
- 8.2.2. Polycrystalline Solar Cells
- 8.2.3. Thin Film Solar Cells
- 8.1. Market Analysis, Insights and Forecast - by Application
- 9. Europe Ultrathin and Superlight Solar Cells Analysis, Insights and Forecast, 2020-2032
- 9.1. Market Analysis, Insights and Forecast - by Application
- 9.1.1. Automotive
- 9.1.2. Aviation
- 9.1.3. Marine
- 9.1.4. Oil And Gas
- 9.1.5. Chemical
- 9.1.6. Power
- 9.2. Market Analysis, Insights and Forecast - by Types
- 9.2.1. Monocrystalline Solar Cells
- 9.2.2. Polycrystalline Solar Cells
- 9.2.3. Thin Film Solar Cells
- 9.1. Market Analysis, Insights and Forecast - by Application
- 10. Middle East & Africa Ultrathin and Superlight Solar Cells Analysis, Insights and Forecast, 2020-2032
- 10.1. Market Analysis, Insights and Forecast - by Application
- 10.1.1. Automotive
- 10.1.2. Aviation
- 10.1.3. Marine
- 10.1.4. Oil And Gas
- 10.1.5. Chemical
- 10.1.6. Power
- 10.2. Market Analysis, Insights and Forecast - by Types
- 10.2.1. Monocrystalline Solar Cells
- 10.2.2. Polycrystalline Solar Cells
- 10.2.3. Thin Film Solar Cells
- 10.1. Market Analysis, Insights and Forecast - by Application
- 11. Asia Pacific Ultrathin and Superlight Solar Cells Analysis, Insights and Forecast, 2020-2032
- 11.1. Market Analysis, Insights and Forecast - by Application
- 11.1.1. Automotive
- 11.1.2. Aviation
- 11.1.3. Marine
- 11.1.4. Oil And Gas
- 11.1.5. Chemical
- 11.1.6. Power
- 11.2. Market Analysis, Insights and Forecast - by Types
- 11.2.1. Monocrystalline Solar Cells
- 11.2.2. Polycrystalline Solar Cells
- 11.2.3. Thin Film Solar Cells
- 11.1. Market Analysis, Insights and Forecast - by Application
- 12. Competitive Analysis
- 12.1. Company Profiles
- 12.1.1 Mitsubishi Electric Corporation
- 12.1.1.1. Company Overview
- 12.1.1.2. Products
- 12.1.1.3. Company Financials
- 12.1.1.4. SWOT Analysis
- 12.1.2 Jinko Solar
- 12.1.2.1. Company Overview
- 12.1.2.2. Products
- 12.1.2.3. Company Financials
- 12.1.2.4. SWOT Analysis
- 12.1.3 Trina Solar
- 12.1.3.1. Company Overview
- 12.1.3.2. Products
- 12.1.3.3. Company Financials
- 12.1.3.4. SWOT Analysis
- 12.1.4 Canadian Solar
- 12.1.4.1. Company Overview
- 12.1.4.2. Products
- 12.1.4.3. Company Financials
- 12.1.4.4. SWOT Analysis
- 12.1.5 First Solar
- 12.1.5.1. Company Overview
- 12.1.5.2. Products
- 12.1.5.3. Company Financials
- 12.1.5.4. SWOT Analysis
- 12.1.6 Moser Baer India Ltd.
- 12.1.6.1. Company Overview
- 12.1.6.2. Products
- 12.1.6.3. Company Financials
- 12.1.6.4. SWOT Analysis
- 12.1.7 Yingli Solar
- 12.1.7.1. Company Overview
- 12.1.7.2. Products
- 12.1.7.3. Company Financials
- 12.1.7.4. SWOT Analysis
- 12.1.8 SunPower Corporation
- 12.1.8.1. Company Overview
- 12.1.8.2. Products
- 12.1.8.3. Company Financials
- 12.1.8.4. SWOT Analysis
- 12.1.9 Sunedison
- 12.1.9.1. Company Overview
- 12.1.9.2. Products
- 12.1.9.3. Company Financials
- 12.1.9.4. SWOT Analysis
- 12.1.10 Inc.
- 12.1.10.1. Company Overview
- 12.1.10.2. Products
- 12.1.10.3. Company Financials
- 12.1.10.4. SWOT Analysis
- 12.1.11 Indosolar
- 12.1.11.1. Company Overview
- 12.1.11.2. Products
- 12.1.11.3. Company Financials
- 12.1.11.4. SWOT Analysis
- 12.1.12 Tata Power Solar Systems Ltd.
- 12.1.12.1. Company Overview
- 12.1.12.2. Products
- 12.1.12.3. Company Financials
- 12.1.12.4. SWOT Analysis
- 12.1.13 GreenBrilliance
- 12.1.13.1. Company Overview
- 12.1.13.2. Products
- 12.1.13.3. Company Financials
- 12.1.13.4. SWOT Analysis
- 12.1.14 SolarWorld
- 12.1.14.1. Company Overview
- 12.1.14.2. Products
- 12.1.14.3. Company Financials
- 12.1.14.4. SWOT Analysis
- 12.1.1 Mitsubishi Electric Corporation
- 12.2. Market Entropy
- 12.2.1 Company's Key Areas Served
- 12.2.2 Recent Developments
- 12.3. Company Market Share Analysis 2025
- 12.3.1 Top 5 Companies Market Share Analysis
- 12.3.2 Top 3 Companies Market Share Analysis
- 12.4. List of Potential Customers
- 13. Research Methodology
List of Figures
- Figure 1: Global Ultrathin and Superlight Solar Cells Revenue Breakdown (billion, %) by Region 2025 & 2033
- Figure 2: Global Ultrathin and Superlight Solar Cells Volume Breakdown (K, %) by Region 2025 & 2033
- Figure 3: North America Ultrathin and Superlight Solar Cells Revenue (billion), by Application 2025 & 2033
- Figure 4: North America Ultrathin and Superlight Solar Cells Volume (K), by Application 2025 & 2033
- Figure 5: North America Ultrathin and Superlight Solar Cells Revenue Share (%), by Application 2025 & 2033
- Figure 6: North America Ultrathin and Superlight Solar Cells Volume Share (%), by Application 2025 & 2033
- Figure 7: North America Ultrathin and Superlight Solar Cells Revenue (billion), by Types 2025 & 2033
- Figure 8: North America Ultrathin and Superlight Solar Cells Volume (K), by Types 2025 & 2033
- Figure 9: North America Ultrathin and Superlight Solar Cells Revenue Share (%), by Types 2025 & 2033
- Figure 10: North America Ultrathin and Superlight Solar Cells Volume Share (%), by Types 2025 & 2033
- Figure 11: North America Ultrathin and Superlight Solar Cells Revenue (billion), by Country 2025 & 2033
- Figure 12: North America Ultrathin and Superlight Solar Cells Volume (K), by Country 2025 & 2033
- Figure 13: North America Ultrathin and Superlight Solar Cells Revenue Share (%), by Country 2025 & 2033
- Figure 14: North America Ultrathin and Superlight Solar Cells Volume Share (%), by Country 2025 & 2033
- Figure 15: South America Ultrathin and Superlight Solar Cells Revenue (billion), by Application 2025 & 2033
- Figure 16: South America Ultrathin and Superlight Solar Cells Volume (K), by Application 2025 & 2033
- Figure 17: South America Ultrathin and Superlight Solar Cells Revenue Share (%), by Application 2025 & 2033
- Figure 18: South America Ultrathin and Superlight Solar Cells Volume Share (%), by Application 2025 & 2033
- Figure 19: South America Ultrathin and Superlight Solar Cells Revenue (billion), by Types 2025 & 2033
- Figure 20: South America Ultrathin and Superlight Solar Cells Volume (K), by Types 2025 & 2033
- Figure 21: South America Ultrathin and Superlight Solar Cells Revenue Share (%), by Types 2025 & 2033
- Figure 22: South America Ultrathin and Superlight Solar Cells Volume Share (%), by Types 2025 & 2033
- Figure 23: South America Ultrathin and Superlight Solar Cells Revenue (billion), by Country 2025 & 2033
- Figure 24: South America Ultrathin and Superlight Solar Cells Volume (K), by Country 2025 & 2033
- Figure 25: South America Ultrathin and Superlight Solar Cells Revenue Share (%), by Country 2025 & 2033
- Figure 26: South America Ultrathin and Superlight Solar Cells Volume Share (%), by Country 2025 & 2033
- Figure 27: Europe Ultrathin and Superlight Solar Cells Revenue (billion), by Application 2025 & 2033
- Figure 28: Europe Ultrathin and Superlight Solar Cells Volume (K), by Application 2025 & 2033
- Figure 29: Europe Ultrathin and Superlight Solar Cells Revenue Share (%), by Application 2025 & 2033
- Figure 30: Europe Ultrathin and Superlight Solar Cells Volume Share (%), by Application 2025 & 2033
- Figure 31: Europe Ultrathin and Superlight Solar Cells Revenue (billion), by Types 2025 & 2033
- Figure 32: Europe Ultrathin and Superlight Solar Cells Volume (K), by Types 2025 & 2033
- Figure 33: Europe Ultrathin and Superlight Solar Cells Revenue Share (%), by Types 2025 & 2033
- Figure 34: Europe Ultrathin and Superlight Solar Cells Volume Share (%), by Types 2025 & 2033
- Figure 35: Europe Ultrathin and Superlight Solar Cells Revenue (billion), by Country 2025 & 2033
- Figure 36: Europe Ultrathin and Superlight Solar Cells Volume (K), by Country 2025 & 2033
- Figure 37: Europe Ultrathin and Superlight Solar Cells Revenue Share (%), by Country 2025 & 2033
- Figure 38: Europe Ultrathin and Superlight Solar Cells Volume Share (%), by Country 2025 & 2033
- Figure 39: Middle East & Africa Ultrathin and Superlight Solar Cells Revenue (billion), by Application 2025 & 2033
- Figure 40: Middle East & Africa Ultrathin and Superlight Solar Cells Volume (K), by Application 2025 & 2033
- Figure 41: Middle East & Africa Ultrathin and Superlight Solar Cells Revenue Share (%), by Application 2025 & 2033
- Figure 42: Middle East & Africa Ultrathin and Superlight Solar Cells Volume Share (%), by Application 2025 & 2033
- Figure 43: Middle East & Africa Ultrathin and Superlight Solar Cells Revenue (billion), by Types 2025 & 2033
- Figure 44: Middle East & Africa Ultrathin and Superlight Solar Cells Volume (K), by Types 2025 & 2033
- Figure 45: Middle East & Africa Ultrathin and Superlight Solar Cells Revenue Share (%), by Types 2025 & 2033
- Figure 46: Middle East & Africa Ultrathin and Superlight Solar Cells Volume Share (%), by Types 2025 & 2033
- Figure 47: Middle East & Africa Ultrathin and Superlight Solar Cells Revenue (billion), by Country 2025 & 2033
- Figure 48: Middle East & Africa Ultrathin and Superlight Solar Cells Volume (K), by Country 2025 & 2033
- Figure 49: Middle East & Africa Ultrathin and Superlight Solar Cells Revenue Share (%), by Country 2025 & 2033
- Figure 50: Middle East & Africa Ultrathin and Superlight Solar Cells Volume Share (%), by Country 2025 & 2033
- Figure 51: Asia Pacific Ultrathin and Superlight Solar Cells Revenue (billion), by Application 2025 & 2033
- Figure 52: Asia Pacific Ultrathin and Superlight Solar Cells Volume (K), by Application 2025 & 2033
- Figure 53: Asia Pacific Ultrathin and Superlight Solar Cells Revenue Share (%), by Application 2025 & 2033
- Figure 54: Asia Pacific Ultrathin and Superlight Solar Cells Volume Share (%), by Application 2025 & 2033
- Figure 55: Asia Pacific Ultrathin and Superlight Solar Cells Revenue (billion), by Types 2025 & 2033
- Figure 56: Asia Pacific Ultrathin and Superlight Solar Cells Volume (K), by Types 2025 & 2033
- Figure 57: Asia Pacific Ultrathin and Superlight Solar Cells Revenue Share (%), by Types 2025 & 2033
- Figure 58: Asia Pacific Ultrathin and Superlight Solar Cells Volume Share (%), by Types 2025 & 2033
- Figure 59: Asia Pacific Ultrathin and Superlight Solar Cells Revenue (billion), by Country 2025 & 2033
- Figure 60: Asia Pacific Ultrathin and Superlight Solar Cells Volume (K), by Country 2025 & 2033
- Figure 61: Asia Pacific Ultrathin and Superlight Solar Cells Revenue Share (%), by Country 2025 & 2033
- Figure 62: Asia Pacific Ultrathin and Superlight Solar Cells Volume Share (%), by Country 2025 & 2033
List of Tables
- Table 1: Global Ultrathin and Superlight Solar Cells Revenue billion Forecast, by Application 2020 & 2033
- Table 2: Global Ultrathin and Superlight Solar Cells Volume K Forecast, by Application 2020 & 2033
- Table 3: Global Ultrathin and Superlight Solar Cells Revenue billion Forecast, by Types 2020 & 2033
- Table 4: Global Ultrathin and Superlight Solar Cells Volume K Forecast, by Types 2020 & 2033
- Table 5: Global Ultrathin and Superlight Solar Cells Revenue billion Forecast, by Region 2020 & 2033
- Table 6: Global Ultrathin and Superlight Solar Cells Volume K Forecast, by Region 2020 & 2033
- Table 7: Global Ultrathin and Superlight Solar Cells Revenue billion Forecast, by Application 2020 & 2033
- Table 8: Global Ultrathin and Superlight Solar Cells Volume K Forecast, by Application 2020 & 2033
- Table 9: Global Ultrathin and Superlight Solar Cells Revenue billion Forecast, by Types 2020 & 2033
- Table 10: Global Ultrathin and Superlight Solar Cells Volume K Forecast, by Types 2020 & 2033
- Table 11: Global Ultrathin and Superlight Solar Cells Revenue billion Forecast, by Country 2020 & 2033
- Table 12: Global Ultrathin and Superlight Solar Cells Volume K Forecast, by Country 2020 & 2033
- Table 13: United States Ultrathin and Superlight Solar Cells Revenue (billion) Forecast, by Application 2020 & 2033
- Table 14: United States Ultrathin and Superlight Solar Cells Volume (K) Forecast, by Application 2020 & 2033
- Table 15: Canada Ultrathin and Superlight Solar Cells Revenue (billion) Forecast, by Application 2020 & 2033
- Table 16: Canada Ultrathin and Superlight Solar Cells Volume (K) Forecast, by Application 2020 & 2033
- Table 17: Mexico Ultrathin and Superlight Solar Cells Revenue (billion) Forecast, by Application 2020 & 2033
- Table 18: Mexico Ultrathin and Superlight Solar Cells Volume (K) Forecast, by Application 2020 & 2033
- Table 19: Global Ultrathin and Superlight Solar Cells Revenue billion Forecast, by Application 2020 & 2033
- Table 20: Global Ultrathin and Superlight Solar Cells Volume K Forecast, by Application 2020 & 2033
- Table 21: Global Ultrathin and Superlight Solar Cells Revenue billion Forecast, by Types 2020 & 2033
- Table 22: Global Ultrathin and Superlight Solar Cells Volume K Forecast, by Types 2020 & 2033
- Table 23: Global Ultrathin and Superlight Solar Cells Revenue billion Forecast, by Country 2020 & 2033
- Table 24: Global Ultrathin and Superlight Solar Cells Volume K Forecast, by Country 2020 & 2033
- Table 25: Brazil Ultrathin and Superlight Solar Cells Revenue (billion) Forecast, by Application 2020 & 2033
- Table 26: Brazil Ultrathin and Superlight Solar Cells Volume (K) Forecast, by Application 2020 & 2033
- Table 27: Argentina Ultrathin and Superlight Solar Cells Revenue (billion) Forecast, by Application 2020 & 2033
- Table 28: Argentina Ultrathin and Superlight Solar Cells Volume (K) Forecast, by Application 2020 & 2033
- Table 29: Rest of South America Ultrathin and Superlight Solar Cells Revenue (billion) Forecast, by Application 2020 & 2033
- Table 30: Rest of South America Ultrathin and Superlight Solar Cells Volume (K) Forecast, by Application 2020 & 2033
- Table 31: Global Ultrathin and Superlight Solar Cells Revenue billion Forecast, by Application 2020 & 2033
- Table 32: Global Ultrathin and Superlight Solar Cells Volume K Forecast, by Application 2020 & 2033
- Table 33: Global Ultrathin and Superlight Solar Cells Revenue billion Forecast, by Types 2020 & 2033
- Table 34: Global Ultrathin and Superlight Solar Cells Volume K Forecast, by Types 2020 & 2033
- Table 35: Global Ultrathin and Superlight Solar Cells Revenue billion Forecast, by Country 2020 & 2033
- Table 36: Global Ultrathin and Superlight Solar Cells Volume K Forecast, by Country 2020 & 2033
- Table 37: United Kingdom Ultrathin and Superlight Solar Cells Revenue (billion) Forecast, by Application 2020 & 2033
- Table 38: United Kingdom Ultrathin and Superlight Solar Cells Volume (K) Forecast, by Application 2020 & 2033
- Table 39: Germany Ultrathin and Superlight Solar Cells Revenue (billion) Forecast, by Application 2020 & 2033
- Table 40: Germany Ultrathin and Superlight Solar Cells Volume (K) Forecast, by Application 2020 & 2033
- Table 41: France Ultrathin and Superlight Solar Cells Revenue (billion) Forecast, by Application 2020 & 2033
- Table 42: France Ultrathin and Superlight Solar Cells Volume (K) Forecast, by Application 2020 & 2033
- Table 43: Italy Ultrathin and Superlight Solar Cells Revenue (billion) Forecast, by Application 2020 & 2033
- Table 44: Italy Ultrathin and Superlight Solar Cells Volume (K) Forecast, by Application 2020 & 2033
- Table 45: Spain Ultrathin and Superlight Solar Cells Revenue (billion) Forecast, by Application 2020 & 2033
- Table 46: Spain Ultrathin and Superlight Solar Cells Volume (K) Forecast, by Application 2020 & 2033
- Table 47: Russia Ultrathin and Superlight Solar Cells Revenue (billion) Forecast, by Application 2020 & 2033
- Table 48: Russia Ultrathin and Superlight Solar Cells Volume (K) Forecast, by Application 2020 & 2033
- Table 49: Benelux Ultrathin and Superlight Solar Cells Revenue (billion) Forecast, by Application 2020 & 2033
- Table 50: Benelux Ultrathin and Superlight Solar Cells Volume (K) Forecast, by Application 2020 & 2033
- Table 51: Nordics Ultrathin and Superlight Solar Cells Revenue (billion) Forecast, by Application 2020 & 2033
- Table 52: Nordics Ultrathin and Superlight Solar Cells Volume (K) Forecast, by Application 2020 & 2033
- Table 53: Rest of Europe Ultrathin and Superlight Solar Cells Revenue (billion) Forecast, by Application 2020 & 2033
- Table 54: Rest of Europe Ultrathin and Superlight Solar Cells Volume (K) Forecast, by Application 2020 & 2033
- Table 55: Global Ultrathin and Superlight Solar Cells Revenue billion Forecast, by Application 2020 & 2033
- Table 56: Global Ultrathin and Superlight Solar Cells Volume K Forecast, by Application 2020 & 2033
- Table 57: Global Ultrathin and Superlight Solar Cells Revenue billion Forecast, by Types 2020 & 2033
- Table 58: Global Ultrathin and Superlight Solar Cells Volume K Forecast, by Types 2020 & 2033
- Table 59: Global Ultrathin and Superlight Solar Cells Revenue billion Forecast, by Country 2020 & 2033
- Table 60: Global Ultrathin and Superlight Solar Cells Volume K Forecast, by Country 2020 & 2033
- Table 61: Turkey Ultrathin and Superlight Solar Cells Revenue (billion) Forecast, by Application 2020 & 2033
- Table 62: Turkey Ultrathin and Superlight Solar Cells Volume (K) Forecast, by Application 2020 & 2033
- Table 63: Israel Ultrathin and Superlight Solar Cells Revenue (billion) Forecast, by Application 2020 & 2033
- Table 64: Israel Ultrathin and Superlight Solar Cells Volume (K) Forecast, by Application 2020 & 2033
- Table 65: GCC Ultrathin and Superlight Solar Cells Revenue (billion) Forecast, by Application 2020 & 2033
- Table 66: GCC Ultrathin and Superlight Solar Cells Volume (K) Forecast, by Application 2020 & 2033
- Table 67: North Africa Ultrathin and Superlight Solar Cells Revenue (billion) Forecast, by Application 2020 & 2033
- Table 68: North Africa Ultrathin and Superlight Solar Cells Volume (K) Forecast, by Application 2020 & 2033
- Table 69: South Africa Ultrathin and Superlight Solar Cells Revenue (billion) Forecast, by Application 2020 & 2033
- Table 70: South Africa Ultrathin and Superlight Solar Cells Volume (K) Forecast, by Application 2020 & 2033
- Table 71: Rest of Middle East & Africa Ultrathin and Superlight Solar Cells Revenue (billion) Forecast, by Application 2020 & 2033
- Table 72: Rest of Middle East & Africa Ultrathin and Superlight Solar Cells Volume (K) Forecast, by Application 2020 & 2033
- Table 73: Global Ultrathin and Superlight Solar Cells Revenue billion Forecast, by Application 2020 & 2033
- Table 74: Global Ultrathin and Superlight Solar Cells Volume K Forecast, by Application 2020 & 2033
- Table 75: Global Ultrathin and Superlight Solar Cells Revenue billion Forecast, by Types 2020 & 2033
- Table 76: Global Ultrathin and Superlight Solar Cells Volume K Forecast, by Types 2020 & 2033
- Table 77: Global Ultrathin and Superlight Solar Cells Revenue billion Forecast, by Country 2020 & 2033
- Table 78: Global Ultrathin and Superlight Solar Cells Volume K Forecast, by Country 2020 & 2033
- Table 79: China Ultrathin and Superlight Solar Cells Revenue (billion) Forecast, by Application 2020 & 2033
- Table 80: China Ultrathin and Superlight Solar Cells Volume (K) Forecast, by Application 2020 & 2033
- Table 81: India Ultrathin and Superlight Solar Cells Revenue (billion) Forecast, by Application 2020 & 2033
- Table 82: India Ultrathin and Superlight Solar Cells Volume (K) Forecast, by Application 2020 & 2033
- Table 83: Japan Ultrathin and Superlight Solar Cells Revenue (billion) Forecast, by Application 2020 & 2033
- Table 84: Japan Ultrathin and Superlight Solar Cells Volume (K) Forecast, by Application 2020 & 2033
- Table 85: South Korea Ultrathin and Superlight Solar Cells Revenue (billion) Forecast, by Application 2020 & 2033
- Table 86: South Korea Ultrathin and Superlight Solar Cells Volume (K) Forecast, by Application 2020 & 2033
- Table 87: ASEAN Ultrathin and Superlight Solar Cells Revenue (billion) Forecast, by Application 2020 & 2033
- Table 88: ASEAN Ultrathin and Superlight Solar Cells Volume (K) Forecast, by Application 2020 & 2033
- Table 89: Oceania Ultrathin and Superlight Solar Cells Revenue (billion) Forecast, by Application 2020 & 2033
- Table 90: Oceania Ultrathin and Superlight Solar Cells Volume (K) Forecast, by Application 2020 & 2033
- Table 91: Rest of Asia Pacific Ultrathin and Superlight Solar Cells Revenue (billion) Forecast, by Application 2020 & 2033
- Table 92: Rest of Asia Pacific Ultrathin and Superlight Solar Cells Volume (K) Forecast, by Application 2020 & 2033
Frequently Asked Questions
1. What is the projected Compound Annual Growth Rate (CAGR) of the Ultrathin and Superlight Solar Cells?
The projected CAGR is approximately 7.49%.
2. Which companies are prominent players in the Ultrathin and Superlight Solar Cells?
Key companies in the market include Mitsubishi Electric Corporation, Jinko Solar, Trina Solar, Canadian Solar, First Solar, Moser Baer India Ltd., Yingli Solar, SunPower Corporation, Sunedison, Inc., Indosolar, Tata Power Solar Systems Ltd., GreenBrilliance, SolarWorld.
3. What are the main segments of the Ultrathin and Superlight Solar Cells?
The market segments include Application, Types.
4. Can you provide details about the market size?
The market size is estimated to be USD 15.12 billion as of 2022.
5. What are some drivers contributing to market growth?
N/A
6. What are the notable trends driving market growth?
N/A
7. Are there any restraints impacting market growth?
N/A
8. Can you provide examples of recent developments in the market?
N/A
9. What pricing options are available for accessing the report?
Pricing options include single-user, multi-user, and enterprise licenses priced at USD 3350.00, USD 5025.00, and USD 6700.00 respectively.
10. Is the market size provided in terms of value or volume?
The market size is provided in terms of value, measured in billion and volume, measured in K.
11. Are there any specific market keywords associated with the report?
Yes, the market keyword associated with the report is "Ultrathin and Superlight Solar Cells," which aids in identifying and referencing the specific market segment covered.
12. How do I determine which pricing option suits my needs best?
The pricing options vary based on user requirements and access needs. Individual users may opt for single-user licenses, while businesses requiring broader access may choose multi-user or enterprise licenses for cost-effective access to the report.
13. Are there any additional resources or data provided in the Ultrathin and Superlight Solar Cells report?
While the report offers comprehensive insights, it's advisable to review the specific contents or supplementary materials provided to ascertain if additional resources or data are available.
14. How can I stay updated on further developments or reports in the Ultrathin and Superlight Solar Cells?
To stay informed about further developments, trends, and reports in the Ultrathin and Superlight Solar Cells, consider subscribing to industry newsletters, following relevant companies and organizations, or regularly checking reputable industry news sources and publications.
Methodology
Step 1 - Identification of Relevant Samples Size from Population Database


Step 2 - Approaches for Defining Global Market Size (Value, Volume* & Price*)

Note*: In applicable scenarios
Step 3 - Data Sources
Primary Research
- Web Analytics
- Survey Reports
- Research Institute
- Latest Research Reports
- Opinion Leaders
Secondary Research
- Annual Reports
- White Paper
- Latest Press Release
- Industry Association
- Paid Database
- Investor Presentations

Step 4 - Data Triangulation
Involves using different sources of information in order to increase the validity of a study
These sources are likely to be stakeholders in a program - participants, other researchers, program staff, other community members, and so on.
Then we put all data in single framework & apply various statistical tools to find out the dynamic on the market.
During the analysis stage, feedback from the stakeholder groups would be compared to determine areas of agreement as well as areas of divergence