

Key Insights
The global turbine monitoring and control systems market is experiencing robust growth, driven by the increasing demand for efficient and reliable power generation across various sectors. A compound annual growth rate (CAGR) exceeding 2.5% indicates a consistently expanding market, projected to reach a substantial size over the forecast period (2025-2033). This growth is fueled by several key factors. The global shift towards renewable energy sources, particularly wind and solar, necessitates sophisticated control systems to optimize energy output and grid stability. Furthermore, the aging infrastructure in many established power generation facilities is driving the need for upgrades and replacements with more advanced monitoring and control technologies. Stringent emission regulations are also pushing the adoption of advanced control systems capable of optimizing fuel consumption and reducing environmental impact. The market is segmented by turbine type (steam, gas, wind, hydro) and control function (speed, temperature, load, pressure), offering diverse opportunities for specialized solutions. Major players like Rockwell Automation, Honeywell, ABB, and Siemens are actively involved in developing innovative solutions and expanding their market presence through strategic partnerships and acquisitions. Geographic growth is diverse, with North America and Europe currently holding significant market share, while the Asia-Pacific region is expected to witness rapid expansion due to significant investments in power infrastructure development.
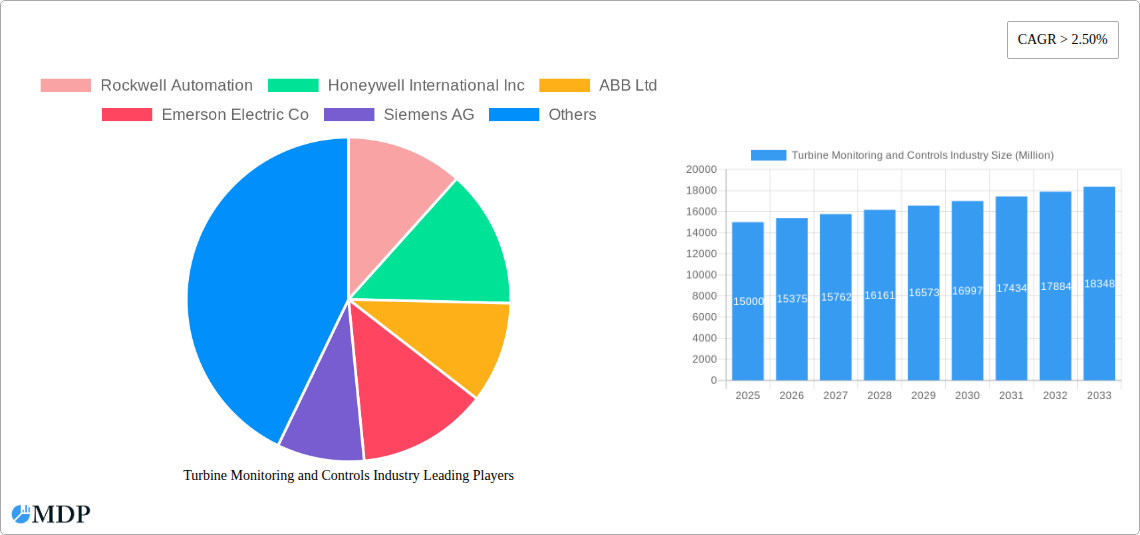
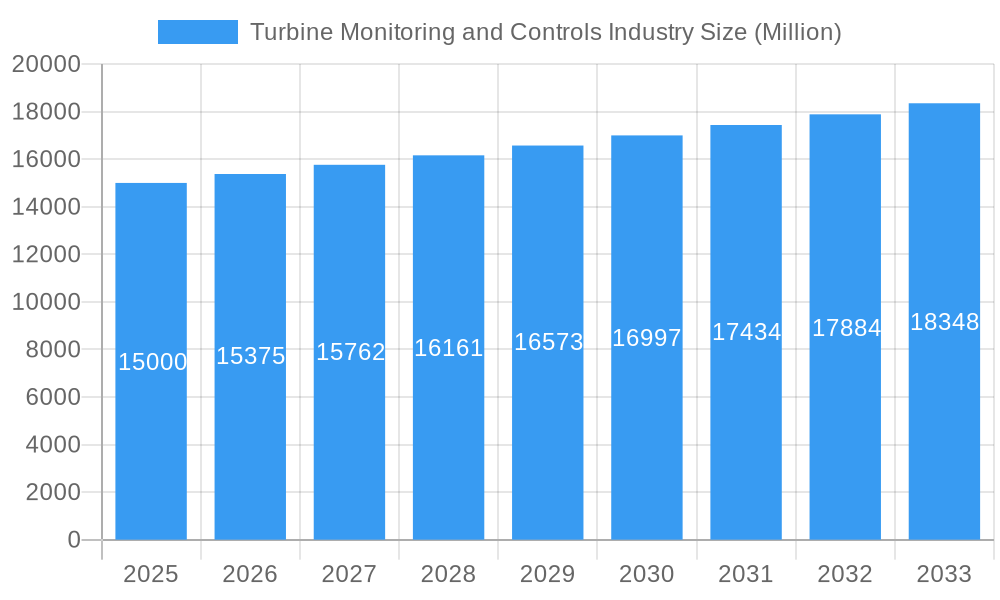
Turbine Monitoring and Controls Industry Market Size (In Billion)
The competitive landscape is characterized by both established players and emerging technology providers, leading to innovation in areas like predictive maintenance, AI-powered diagnostics, and remote monitoring capabilities. The market faces certain challenges, including the high initial investment costs associated with implementing these advanced systems and the complexity of integrating them into existing infrastructure. However, the long-term benefits of improved efficiency, reduced downtime, and enhanced safety are expected to overcome these barriers. The increasing adoption of digitalization and Industry 4.0 principles is further accelerating market growth, paving the way for sophisticated data analytics and remote operational capabilities. This evolving landscape presents significant opportunities for businesses involved in design, manufacturing, installation, and maintenance of turbine monitoring and control systems. Future growth will likely be shaped by technological advancements, regulatory changes, and evolving energy demands globally. We estimate the market size in 2025 to be approximately $15 Billion, based on the provided CAGR and considering the global energy landscape. This is a conservative estimate and could be significantly higher depending on several macro-economic factors.
Turbine Monitoring and Controls Industry Company Market Share
Turbine Monitoring and Controls Industry: A Comprehensive Market Report (2019-2033)
This in-depth report provides a comprehensive analysis of the Turbine Monitoring and Controls industry, offering invaluable insights for stakeholders seeking to navigate this dynamic market. With a detailed study period spanning 2019-2033 (Base Year: 2025, Forecast Period: 2025-2033), this report delivers critical data and forecasts valued at Millions of dollars, empowering informed decision-making. The report covers key segments, leading players, and emerging trends, providing a complete picture of this crucial sector.
Turbine Monitoring and Controls Industry Market Dynamics & Concentration
The global turbine monitoring and controls market is characterized by a moderately concentrated landscape, with several major players holding significant market share. Rockwell Automation, Honeywell International Inc, ABB Ltd, Emerson Electric Co, and Siemens AG are among the key players, collectively commanding an estimated xx% of the market in 2025. However, the market also features numerous smaller, specialized companies catering to niche segments.
Market concentration is influenced by factors including:
- High barriers to entry: Significant capital investment and specialized expertise are required for developing and deploying advanced turbine monitoring and control systems.
- Innovation drivers: Continuous advancements in sensor technology, data analytics, and artificial intelligence (AI) are driving innovation and competition.
- Regulatory frameworks: Stringent safety and environmental regulations are shaping industry practices and influencing technological choices. Compliance costs can vary across regions, impacting profitability.
- Product substitutes: While direct substitutes are limited, indirect competition arises from alternative energy sources and optimization strategies.
- End-user trends: The increasing demand for energy efficiency and the integration of renewable energy sources are driving the adoption of sophisticated monitoring and control solutions.
- M&A activities: Consolidation within the industry has been observed, with several major players engaging in strategic acquisitions to expand their market presence and technological capabilities. An estimated xx M&A deals occurred between 2019 and 2024.
Turbine Monitoring and Controls Industry Industry Trends & Analysis
The global turbine monitoring and controls market is projected to experience significant growth, with a CAGR of xx% during the forecast period (2025-2033). This growth is propelled by several key factors:
- Increasing demand for renewable energy: The global shift towards renewable energy sources, particularly wind and solar power, is driving the demand for advanced turbine monitoring and control systems for optimizing performance and efficiency. Market penetration of these systems within renewable energy sectors is estimated to reach xx% by 2033.
- Technological advancements: Innovations in sensor technology, cloud computing, and AI-powered analytics are leading to more efficient and reliable turbine monitoring and control solutions. The integration of predictive maintenance capabilities is further boosting market adoption.
- Growing focus on energy efficiency: The need to reduce energy consumption and improve overall efficiency is driving the adoption of smart monitoring and control systems, leading to significant cost savings for operators.
- Stringent environmental regulations: Governments worldwide are imposing stricter environmental regulations, pushing industries to adopt technologies that minimize emissions and improve environmental performance. This regulatory landscape significantly influences technology choices and market growth.
- Competitive dynamics: The market is characterized by intense competition among both established players and emerging technology providers, leading to continuous innovation and price optimization.
Leading Markets & Segments in Turbine Monitoring and Controls Industry
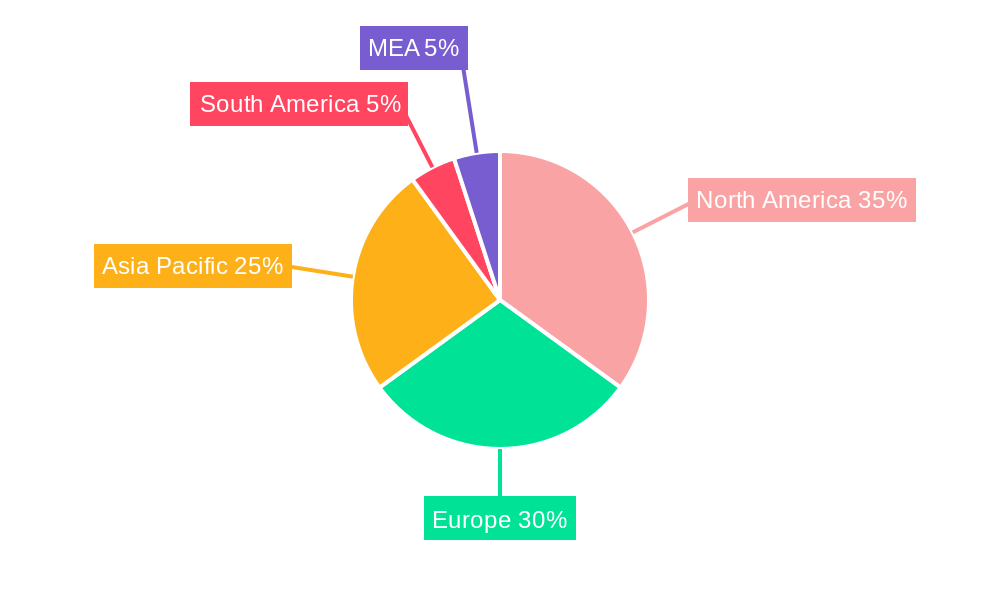
The North American market currently holds the largest market share, driven by strong investments in renewable energy infrastructure and advanced technologies. However, the Asia-Pacific region is expected to experience the fastest growth during the forecast period due to significant expansion of power generation capacity, particularly in developing economies.
Key Drivers:
- North America: Government support for renewable energy initiatives, robust industrial base, and high adoption rates for advanced technologies.
- Europe: Stringent environmental regulations, focus on decarbonization, and a significant installed base of turbines.
- Asia-Pacific: Rapid economic growth, increasing energy demand, and significant investments in power generation infrastructure.
Dominant Segments:
- By Type: The wind turbine control system segment is currently the largest and fastest-growing segment, driven by the rapid expansion of wind power capacity worldwide.
- By Function: Speed control systems maintain optimum operational parameters, while increasingly sophisticated load and pressure control features maximize efficiency and safety.
Turbine Monitoring and Controls Industry Product Developments
Recent innovations focus on improving accuracy, reliability, and predictive capabilities of turbine monitoring and control systems. This includes advancements in sensor technology, AI-powered predictive maintenance algorithms, and cloud-based data analytics platforms. These innovations enhance operational efficiency, reduce maintenance costs, and extend the lifespan of turbines. The integration of these technologies into existing and new turbines improves market fit and strengthens competitive advantages.
Key Drivers of Turbine Monitoring and Controls Industry Growth
Several key factors are driving growth in the turbine monitoring and controls industry:
- Technological advancements: The continuous development of more efficient and reliable control systems, driven by AI and IoT technologies, is a primary growth driver.
- Increased focus on energy efficiency: Governments and businesses are actively seeking ways to improve energy efficiency and reduce energy consumption.
- Stringent environmental regulations: The implementation of stricter environmental regulations is further driving the adoption of advanced monitoring and control systems that minimize environmental impact. For example, the European Union's commitment to carbon neutrality is driving innovation and investment in the sector.
Challenges in the Turbine Monitoring and Controls Industry Market
The industry faces several challenges:
- High initial investment costs: Implementing advanced monitoring and control systems can be expensive, which can be a barrier to entry for smaller companies. This leads to a concentration of market share amongst larger players.
- Cybersecurity risks: The increasing reliance on interconnected systems makes these systems vulnerable to cyberattacks, posing a significant risk to operational security and reliability. Addressing these security concerns is a major industry challenge.
- Supply chain disruptions: The global supply chain for key components can be disrupted, impacting the timely delivery of products and services. These disruptions can lead to project delays and increased costs.
Emerging Opportunities in Turbine Monitoring and Controls Industry
Several factors present significant opportunities for long-term growth:
- Integration of renewable energy sources: The integration of renewable energy sources into existing power grids is creating new opportunities for advanced monitoring and control systems.
- Expansion of smart grids: The development of smart grids is driving demand for more sophisticated monitoring and control systems to optimize grid performance and stability.
- Growth in the offshore wind power sector: The increasing adoption of offshore wind power is creating significant opportunities for companies specializing in offshore turbine monitoring and control solutions.
Leading Players in the Turbine Monitoring and Controls Industry Sector
- Rockwell Automation
- Honeywell International Inc
- ABB Ltd
- Emerson Electric Co
- Siemens AG
- Mita-Teknik AS
- Mitsubishi Heavy Industries Ltd
- Innoway-sea Group
- General Electric Company
- Rolls-Royce Holding PLC
Key Milestones in Turbine Monitoring and Controls Industry Industry
- December 2021: Emerson Electric secures a contract for the modernization of the Wansley power plant, showcasing the growing demand for advanced control and monitoring solutions.
- December 2021: The Danish government announces plans to increase offshore wind capacity, signaling significant growth potential for wind turbine monitoring and control systems.
Strategic Outlook for Turbine Monitoring and Controls Industry Market
The turbine monitoring and controls market is poised for continued expansion, driven by the global shift towards renewable energy, advancements in technology, and increasing focus on energy efficiency. Strategic partnerships, technological innovations, and expansion into emerging markets will be key for companies seeking to capitalize on this growth potential. The market's future success hinges on delivering cost-effective, reliable, and secure solutions capable of integrating seamlessly into modern energy infrastructure.
Turbine Monitoring and Controls Industry Segmentation
-
1. Type
- 1.1. Steam Turbine Control System
- 1.2. Gas Turbine Control System
- 1.3. Wind Turbine Control System
- 1.4. Hydro Turbine Control System
-
2. Function
- 2.1. Speed Control
- 2.2. Temperature Control
- 2.3. Load Control
- 2.4. Pressure Control
- 2.5. Other Functions
Turbine Monitoring and Controls Industry Segmentation By Geography
- 1. North America
- 2. Europe
- 3. Asia Pacific
- 4. South America
- 5. Middle East
Turbine Monitoring and Controls Industry Regional Market Share
Geographic Coverage of Turbine Monitoring and Controls Industry
Turbine Monitoring and Controls Industry REPORT HIGHLIGHTS
| Aspects | Details |
|---|---|
| Study Period | 2020-2034 |
| Base Year | 2025 |
| Estimated Year | 2026 |
| Forecast Period | 2026-2034 |
| Historical Period | 2020-2025 |
| Growth Rate | CAGR of 5.8% from 2020-2034 |
| Segmentation |
|
Table of Contents
- 1. Introduction
- 1.1. Research Scope
- 1.2. Market Segmentation
- 1.3. Research Objective
- 1.4. Definitions and Assumptions
- 2. Executive Summary
- 2.1. Market Snapshot
- 3. Market Dynamics
- 3.1. Market Drivers
- 3.2. Market Restrains
- 3.3. Market Trends
- 3.4. Market Opportunities
- 4. Market Factor Analysis
- 4.1. Porters Five Forces
- 4.1.1. Bargaining Power of Suppliers
- 4.1.2. Bargaining Power of Buyers
- 4.1.3. Threat of New Entrants
- 4.1.4. Threat of Substitutes
- 4.1.5. Competitive Rivalry
- 4.2. PESTEL analysis
- 4.3. BCG Analysis
- 4.3.1. Stars (High Growth, High Market Share)
- 4.3.2. Cash Cows (Low Growth, High Market Share)
- 4.3.3. Question Mark (High Growth, Low Market Share)
- 4.3.4. Dogs (Low Growth, Low Market Share)
- 4.4. Ansoff Matrix Analysis
- 4.5. Supply Chain Analysis
- 4.6. Regulatory Landscape
- 4.7. Current Market Potential and Opportunity Assessment (TAM–SAM–SOM Framework)
- 4.8. MDP Analyst Note
- 4.1. Porters Five Forces
- 5. Market Analysis, Insights and Forecast 2021-2033
- 5.1. Market Analysis, Insights and Forecast - by Type
- 5.1.1. Steam Turbine Control System
- 5.1.2. Gas Turbine Control System
- 5.1.3. Wind Turbine Control System
- 5.1.4. Hydro Turbine Control System
- 5.2. Market Analysis, Insights and Forecast - by Function
- 5.2.1. Speed Control
- 5.2.2. Temperature Control
- 5.2.3. Load Control
- 5.2.4. Pressure Control
- 5.2.5. Other Functions
- 5.3. Market Analysis, Insights and Forecast - by Region
- 5.3.1. North America
- 5.3.2. Europe
- 5.3.3. Asia Pacific
- 5.3.4. South America
- 5.3.5. Middle East
- 5.1. Market Analysis, Insights and Forecast - by Type
- 6. Global Turbine Monitoring and Controls Industry Analysis, Insights and Forecast, 2021-2033
- 6.1. Market Analysis, Insights and Forecast - by Type
- 6.1.1. Steam Turbine Control System
- 6.1.2. Gas Turbine Control System
- 6.1.3. Wind Turbine Control System
- 6.1.4. Hydro Turbine Control System
- 6.2. Market Analysis, Insights and Forecast - by Function
- 6.2.1. Speed Control
- 6.2.2. Temperature Control
- 6.2.3. Load Control
- 6.2.4. Pressure Control
- 6.2.5. Other Functions
- 6.1. Market Analysis, Insights and Forecast - by Type
- 7. North America Turbine Monitoring and Controls Industry Analysis, Insights and Forecast, 2020-2032
- 7.1. Market Analysis, Insights and Forecast - by Type
- 7.1.1. Steam Turbine Control System
- 7.1.2. Gas Turbine Control System
- 7.1.3. Wind Turbine Control System
- 7.1.4. Hydro Turbine Control System
- 7.2. Market Analysis, Insights and Forecast - by Function
- 7.2.1. Speed Control
- 7.2.2. Temperature Control
- 7.2.3. Load Control
- 7.2.4. Pressure Control
- 7.2.5. Other Functions
- 7.1. Market Analysis, Insights and Forecast - by Type
- 8. Europe Turbine Monitoring and Controls Industry Analysis, Insights and Forecast, 2020-2032
- 8.1. Market Analysis, Insights and Forecast - by Type
- 8.1.1. Steam Turbine Control System
- 8.1.2. Gas Turbine Control System
- 8.1.3. Wind Turbine Control System
- 8.1.4. Hydro Turbine Control System
- 8.2. Market Analysis, Insights and Forecast - by Function
- 8.2.1. Speed Control
- 8.2.2. Temperature Control
- 8.2.3. Load Control
- 8.2.4. Pressure Control
- 8.2.5. Other Functions
- 8.1. Market Analysis, Insights and Forecast - by Type
- 9. Asia Pacific Turbine Monitoring and Controls Industry Analysis, Insights and Forecast, 2020-2032
- 9.1. Market Analysis, Insights and Forecast - by Type
- 9.1.1. Steam Turbine Control System
- 9.1.2. Gas Turbine Control System
- 9.1.3. Wind Turbine Control System
- 9.1.4. Hydro Turbine Control System
- 9.2. Market Analysis, Insights and Forecast - by Function
- 9.2.1. Speed Control
- 9.2.2. Temperature Control
- 9.2.3. Load Control
- 9.2.4. Pressure Control
- 9.2.5. Other Functions
- 9.1. Market Analysis, Insights and Forecast - by Type
- 10. South America Turbine Monitoring and Controls Industry Analysis, Insights and Forecast, 2020-2032
- 10.1. Market Analysis, Insights and Forecast - by Type
- 10.1.1. Steam Turbine Control System
- 10.1.2. Gas Turbine Control System
- 10.1.3. Wind Turbine Control System
- 10.1.4. Hydro Turbine Control System
- 10.2. Market Analysis, Insights and Forecast - by Function
- 10.2.1. Speed Control
- 10.2.2. Temperature Control
- 10.2.3. Load Control
- 10.2.4. Pressure Control
- 10.2.5. Other Functions
- 10.1. Market Analysis, Insights and Forecast - by Type
- 11. Middle East Turbine Monitoring and Controls Industry Analysis, Insights and Forecast, 2020-2032
- 11.1. Market Analysis, Insights and Forecast - by Type
- 11.1.1. Steam Turbine Control System
- 11.1.2. Gas Turbine Control System
- 11.1.3. Wind Turbine Control System
- 11.1.4. Hydro Turbine Control System
- 11.2. Market Analysis, Insights and Forecast - by Function
- 11.2.1. Speed Control
- 11.2.2. Temperature Control
- 11.2.3. Load Control
- 11.2.4. Pressure Control
- 11.2.5. Other Functions
- 11.1. Market Analysis, Insights and Forecast - by Type
- 12. Competitive Analysis
- 12.1. Company Profiles
- 12.1.1 Rockwell Automation
- 12.1.1.1. Company Overview
- 12.1.1.2. Products
- 12.1.1.3. Company Financials
- 12.1.1.4. SWOT Analysis
- 12.1.2 Honeywell International Inc
- 12.1.2.1. Company Overview
- 12.1.2.2. Products
- 12.1.2.3. Company Financials
- 12.1.2.4. SWOT Analysis
- 12.1.3 ABB Ltd
- 12.1.3.1. Company Overview
- 12.1.3.2. Products
- 12.1.3.3. Company Financials
- 12.1.3.4. SWOT Analysis
- 12.1.4 Emerson Electric Co
- 12.1.4.1. Company Overview
- 12.1.4.2. Products
- 12.1.4.3. Company Financials
- 12.1.4.4. SWOT Analysis
- 12.1.5 Siemens AG
- 12.1.5.1. Company Overview
- 12.1.5.2. Products
- 12.1.5.3. Company Financials
- 12.1.5.4. SWOT Analysis
- 12.1.6 Mita-Teknik AS
- 12.1.6.1. Company Overview
- 12.1.6.2. Products
- 12.1.6.3. Company Financials
- 12.1.6.4. SWOT Analysis
- 12.1.7 Mitsubishi Heavy Industries Ltd*List Not Exhaustive
- 12.1.7.1. Company Overview
- 12.1.7.2. Products
- 12.1.7.3. Company Financials
- 12.1.7.4. SWOT Analysis
- 12.1.8 Innoway-sea Group
- 12.1.8.1. Company Overview
- 12.1.8.2. Products
- 12.1.8.3. Company Financials
- 12.1.8.4. SWOT Analysis
- 12.1.9 General Electric Company
- 12.1.9.1. Company Overview
- 12.1.9.2. Products
- 12.1.9.3. Company Financials
- 12.1.9.4. SWOT Analysis
- 12.1.10 Rolls-Royce Holding PLC
- 12.1.10.1. Company Overview
- 12.1.10.2. Products
- 12.1.10.3. Company Financials
- 12.1.10.4. SWOT Analysis
- 12.1.1 Rockwell Automation
- 12.2. Market Entropy
- 12.2.1 Company's Key Areas Served
- 12.2.2 Recent Developments
- 12.3. Company Market Share Analysis 2025
- 12.3.1 Top 5 Companies Market Share Analysis
- 12.3.2 Top 3 Companies Market Share Analysis
- 12.4. List of Potential Customers
- 13. Research Methodology
List of Figures
- Figure 1: Global Turbine Monitoring and Controls Industry Revenue Breakdown (billion, %) by Region 2025 & 2033
- Figure 2: North America Turbine Monitoring and Controls Industry Revenue (billion), by Type 2025 & 2033
- Figure 3: North America Turbine Monitoring and Controls Industry Revenue Share (%), by Type 2025 & 2033
- Figure 4: North America Turbine Monitoring and Controls Industry Revenue (billion), by Function 2025 & 2033
- Figure 5: North America Turbine Monitoring and Controls Industry Revenue Share (%), by Function 2025 & 2033
- Figure 6: North America Turbine Monitoring and Controls Industry Revenue (billion), by Country 2025 & 2033
- Figure 7: North America Turbine Monitoring and Controls Industry Revenue Share (%), by Country 2025 & 2033
- Figure 8: Europe Turbine Monitoring and Controls Industry Revenue (billion), by Type 2025 & 2033
- Figure 9: Europe Turbine Monitoring and Controls Industry Revenue Share (%), by Type 2025 & 2033
- Figure 10: Europe Turbine Monitoring and Controls Industry Revenue (billion), by Function 2025 & 2033
- Figure 11: Europe Turbine Monitoring and Controls Industry Revenue Share (%), by Function 2025 & 2033
- Figure 12: Europe Turbine Monitoring and Controls Industry Revenue (billion), by Country 2025 & 2033
- Figure 13: Europe Turbine Monitoring and Controls Industry Revenue Share (%), by Country 2025 & 2033
- Figure 14: Asia Pacific Turbine Monitoring and Controls Industry Revenue (billion), by Type 2025 & 2033
- Figure 15: Asia Pacific Turbine Monitoring and Controls Industry Revenue Share (%), by Type 2025 & 2033
- Figure 16: Asia Pacific Turbine Monitoring and Controls Industry Revenue (billion), by Function 2025 & 2033
- Figure 17: Asia Pacific Turbine Monitoring and Controls Industry Revenue Share (%), by Function 2025 & 2033
- Figure 18: Asia Pacific Turbine Monitoring and Controls Industry Revenue (billion), by Country 2025 & 2033
- Figure 19: Asia Pacific Turbine Monitoring and Controls Industry Revenue Share (%), by Country 2025 & 2033
- Figure 20: South America Turbine Monitoring and Controls Industry Revenue (billion), by Type 2025 & 2033
- Figure 21: South America Turbine Monitoring and Controls Industry Revenue Share (%), by Type 2025 & 2033
- Figure 22: South America Turbine Monitoring and Controls Industry Revenue (billion), by Function 2025 & 2033
- Figure 23: South America Turbine Monitoring and Controls Industry Revenue Share (%), by Function 2025 & 2033
- Figure 24: South America Turbine Monitoring and Controls Industry Revenue (billion), by Country 2025 & 2033
- Figure 25: South America Turbine Monitoring and Controls Industry Revenue Share (%), by Country 2025 & 2033
- Figure 26: Middle East Turbine Monitoring and Controls Industry Revenue (billion), by Type 2025 & 2033
- Figure 27: Middle East Turbine Monitoring and Controls Industry Revenue Share (%), by Type 2025 & 2033
- Figure 28: Middle East Turbine Monitoring and Controls Industry Revenue (billion), by Function 2025 & 2033
- Figure 29: Middle East Turbine Monitoring and Controls Industry Revenue Share (%), by Function 2025 & 2033
- Figure 30: Middle East Turbine Monitoring and Controls Industry Revenue (billion), by Country 2025 & 2033
- Figure 31: Middle East Turbine Monitoring and Controls Industry Revenue Share (%), by Country 2025 & 2033
List of Tables
- Table 1: Global Turbine Monitoring and Controls Industry Revenue billion Forecast, by Type 2020 & 2033
- Table 2: Global Turbine Monitoring and Controls Industry Revenue billion Forecast, by Function 2020 & 2033
- Table 3: Global Turbine Monitoring and Controls Industry Revenue billion Forecast, by Region 2020 & 2033
- Table 4: Global Turbine Monitoring and Controls Industry Revenue billion Forecast, by Type 2020 & 2033
- Table 5: Global Turbine Monitoring and Controls Industry Revenue billion Forecast, by Function 2020 & 2033
- Table 6: Global Turbine Monitoring and Controls Industry Revenue billion Forecast, by Country 2020 & 2033
- Table 7: Global Turbine Monitoring and Controls Industry Revenue billion Forecast, by Type 2020 & 2033
- Table 8: Global Turbine Monitoring and Controls Industry Revenue billion Forecast, by Function 2020 & 2033
- Table 9: Global Turbine Monitoring and Controls Industry Revenue billion Forecast, by Country 2020 & 2033
- Table 10: Global Turbine Monitoring and Controls Industry Revenue billion Forecast, by Type 2020 & 2033
- Table 11: Global Turbine Monitoring and Controls Industry Revenue billion Forecast, by Function 2020 & 2033
- Table 12: Global Turbine Monitoring and Controls Industry Revenue billion Forecast, by Country 2020 & 2033
- Table 13: Global Turbine Monitoring and Controls Industry Revenue billion Forecast, by Type 2020 & 2033
- Table 14: Global Turbine Monitoring and Controls Industry Revenue billion Forecast, by Function 2020 & 2033
- Table 15: Global Turbine Monitoring and Controls Industry Revenue billion Forecast, by Country 2020 & 2033
- Table 16: Global Turbine Monitoring and Controls Industry Revenue billion Forecast, by Type 2020 & 2033
- Table 17: Global Turbine Monitoring and Controls Industry Revenue billion Forecast, by Function 2020 & 2033
- Table 18: Global Turbine Monitoring and Controls Industry Revenue billion Forecast, by Country 2020 & 2033
Frequently Asked Questions
1. What is the projected Compound Annual Growth Rate (CAGR) of the Turbine Monitoring and Controls Industry?
The projected CAGR is approximately 5.8%.
2. Which companies are prominent players in the Turbine Monitoring and Controls Industry?
Key companies in the market include Rockwell Automation, Honeywell International Inc, ABB Ltd, Emerson Electric Co, Siemens AG, Mita-Teknik AS, Mitsubishi Heavy Industries Ltd*List Not Exhaustive, Innoway-sea Group, General Electric Company, Rolls-Royce Holding PLC.
3. What are the main segments of the Turbine Monitoring and Controls Industry?
The market segments include Type, Function.
4. Can you provide details about the market size?
The market size is estimated to be USD 21.6 billion as of 2022.
5. What are some drivers contributing to market growth?
4.; Increasing Power Generation Capacity Worldwide4.; Rise In Electricity Demand Due Increase Industrial And Infrastructural Development Activities.
6. What are the notable trends driving market growth?
Wind Turbine Control Systems Expected to Witness Significant Growth.
7. Are there any restraints impacting market growth?
4.; Growth In Distributed Energy Generation.
8. Can you provide examples of recent developments in the market?
In December 2021, Emerson Electric was selected by the Municipal Electric Authority of Georgia for the modernization of the Wansley power plant. Under the agreement, the old gas and steam turbine control systems will be replaced with a unified Ovation automation platform, which is an advanced control and monitoring solution offered by the company.
9. What pricing options are available for accessing the report?
Pricing options include single-user, multi-user, and enterprise licenses priced at USD 4750, USD 5250, and USD 8750 respectively.
10. Is the market size provided in terms of value or volume?
The market size is provided in terms of value, measured in billion.
11. Are there any specific market keywords associated with the report?
Yes, the market keyword associated with the report is "Turbine Monitoring and Controls Industry," which aids in identifying and referencing the specific market segment covered.
12. How do I determine which pricing option suits my needs best?
The pricing options vary based on user requirements and access needs. Individual users may opt for single-user licenses, while businesses requiring broader access may choose multi-user or enterprise licenses for cost-effective access to the report.
13. Are there any additional resources or data provided in the Turbine Monitoring and Controls Industry report?
While the report offers comprehensive insights, it's advisable to review the specific contents or supplementary materials provided to ascertain if additional resources or data are available.
14. How can I stay updated on further developments or reports in the Turbine Monitoring and Controls Industry?
To stay informed about further developments, trends, and reports in the Turbine Monitoring and Controls Industry, consider subscribing to industry newsletters, following relevant companies and organizations, or regularly checking reputable industry news sources and publications.
Methodology
Step 1 - Identification of Relevant Samples Size from Population Database


Step 2 - Approaches for Defining Global Market Size (Value, Volume* & Price*)

Note*: In applicable scenarios
Step 3 - Data Sources
Primary Research
- Web Analytics
- Survey Reports
- Research Institute
- Latest Research Reports
- Opinion Leaders
Secondary Research
- Annual Reports
- White Paper
- Latest Press Release
- Industry Association
- Paid Database
- Investor Presentations

Step 4 - Data Triangulation
Involves using different sources of information in order to increase the validity of a study
These sources are likely to be stakeholders in a program - participants, other researchers, program staff, other community members, and so on.
Then we put all data in single framework & apply various statistical tools to find out the dynamic on the market.
During the analysis stage, feedback from the stakeholder groups would be compared to determine areas of agreement as well as areas of divergence