

Key Insights
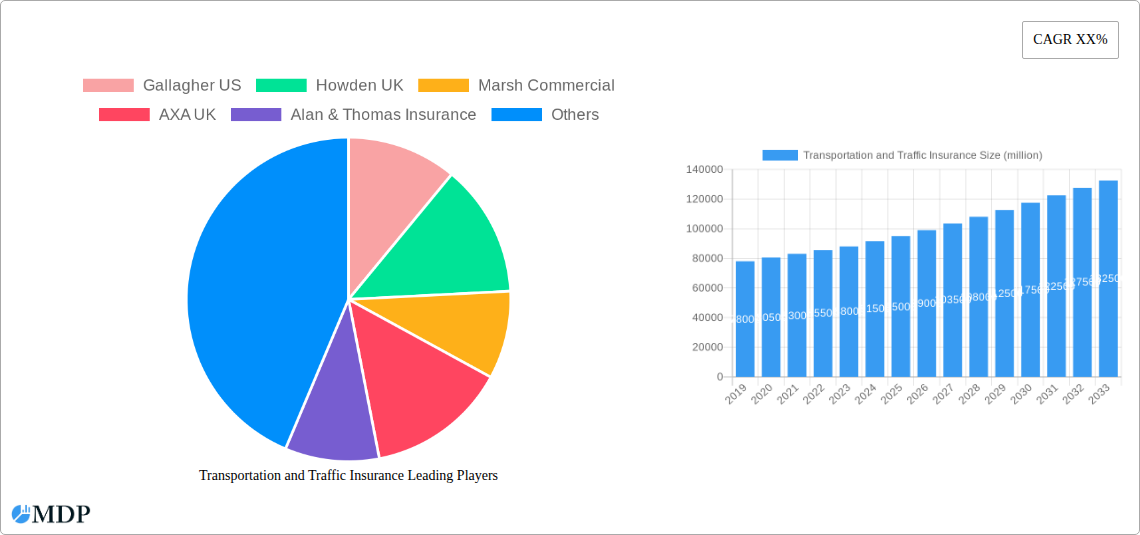
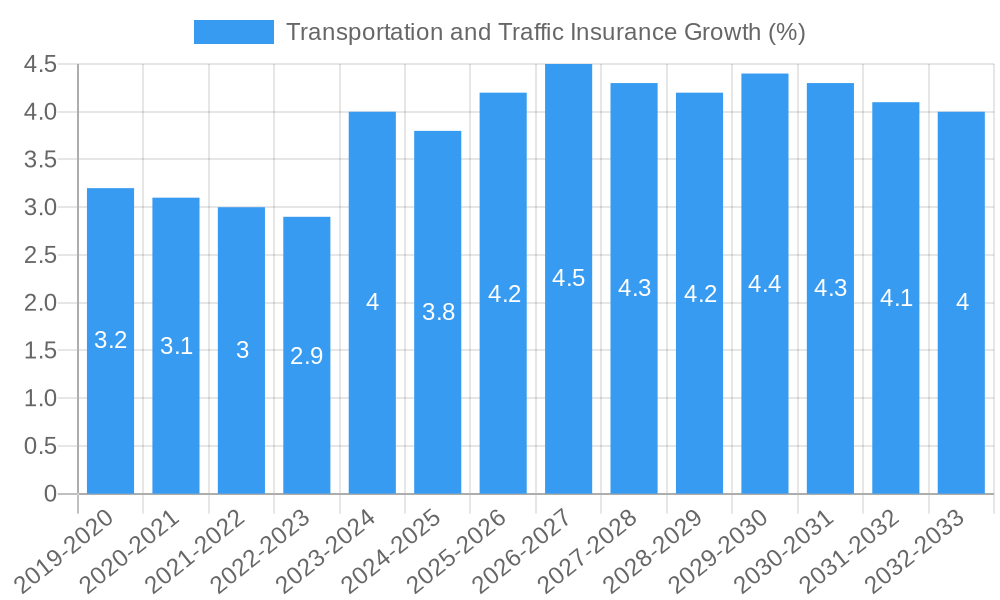
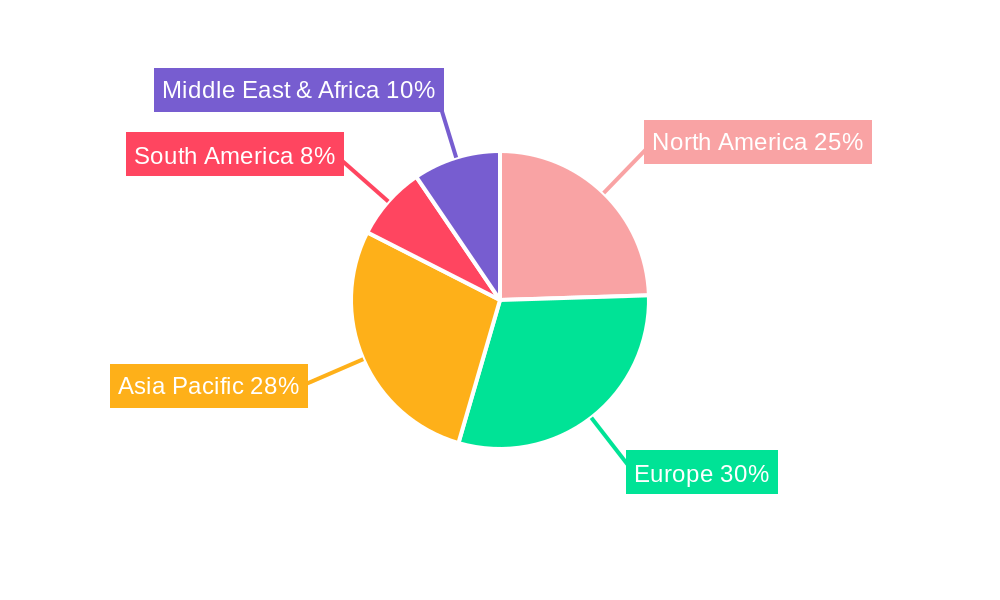
The global Transportation and Traffic Insurance market is poised for robust expansion, with an estimated market size of USD 95,000 million in 2025 and projected to reach approximately USD 135,000 million by 2033, exhibiting a Compound Annual Growth Rate (CAGR) of 5.2% during the forecast period. This substantial growth is primarily fueled by the escalating volume of global trade and the increasing complexity of supply chains, necessitating comprehensive insurance coverage for the diverse risks inherent in cargo transportation. Furthermore, a rising number of personal and commercial vehicles, coupled with heightened awareness of the financial implications of traffic accidents and personal injuries, is driving demand for motor vehicle and personal injury insurance segments. Regulatory mandates across various regions also play a crucial role in bolstering market penetration, ensuring a baseline level of coverage for transporters and vehicle owners alike. Emerging economies, particularly in Asia Pacific and South America, are emerging as significant growth pockets due to rapid industrialization, expanding middle classes, and increasing vehicle ownership.
However, the market is not without its challenges. Intense competition among established and emerging insurance providers, alongside price sensitivity in certain segments, could exert downward pressure on profit margins. Additionally, the increasing frequency and severity of natural disasters, geopolitical instabilities impacting trade routes, and evolving cyber threats pose significant underwriting challenges for insurers. Despite these restraints, the market is actively innovating. The integration of advanced technologies such as telematics, AI-powered risk assessment, and blockchain for enhanced transparency and efficiency is becoming increasingly prevalent. This digital transformation is not only improving claims processing and fraud detection but also enabling the development of more tailored and competitive insurance products, particularly for specialized transportation needs and sophisticated commercial fleets. The focus is shifting towards proactive risk management and value-added services beyond basic coverage.
This in-depth report delves into the dynamic Transportation and Traffic Insurance market, offering a critical analysis of its evolution from 2019 to 2033. Covering the historical period (2019-2024), base year (2025), estimated year (2025), and forecast period (2025-2033), this report provides actionable intelligence for industry stakeholders, including insurance providers, transportation companies, regulatory bodies, and investors. We explore the intricate market dynamics, leading players, burgeoning trends, and future opportunities within the global truck insurance, commercial auto insurance, freight insurance, and personal transportation insurance sectors.
Transportation and Traffic Insurance Market Dynamics & Concentration
The Transportation and Traffic Insurance market is characterized by a moderate to high level of concentration, with a few dominant players holding significant market share, estimated to be over 60% in key regions. Key innovation drivers include the increasing adoption of telematics for risk assessment, advancements in autonomous vehicle technology, and the growing demand for specialized cargo insurance for high-value goods. Regulatory frameworks, such as evolving emissions standards and road safety mandates, significantly shape product offerings and underwriting practices. The threat of product substitutes, while present in the form of self-insurance models for large enterprises, is mitigated by the inherent complexity and financial risk associated with transportation operations. End-user trends reveal a rising demand for comprehensive fleet insurance solutions and a preference for digitalized claims processes. Merger and acquisition (M&A) activities have been a notable feature, with an estimated average of 15 major deals annually over the past five years, aimed at consolidating market presence and expanding service portfolios.
Transportation and Traffic Insurance Industry Trends & Analysis
The Transportation and Traffic Insurance industry is experiencing robust growth, driven by several pivotal factors. The escalating volume of global trade and e-commerce continues to fuel the demand for cargo transportation insurance, as businesses seek to protect their supply chains. Technological disruptions are transforming risk management, with the integration of AI-powered analytics, IoT devices for real-time tracking and monitoring, and the development of parametric insurance solutions offering faster claims payouts. Consumer preferences are shifting towards more personalized and flexible insurance products, with a growing emphasis on cyber insurance for connected vehicles and logistics platforms. The competitive landscape is intensifying, marked by product differentiation, strategic partnerships between insurers and technology providers, and a focus on enhancing customer experience through digital channels. The compound annual growth rate (CAGR) for the global market is projected to be around 7.5% during the forecast period, with market penetration for specialized motor vehicle insurance for commercial fleets reaching approximately 85% in developed economies.
Leading Markets & Segments in Transportation and Traffic Insurance
The Commercial segment dominates the Transportation and Traffic Insurance market, accounting for an estimated 70% of the total market value. This dominance is propelled by the sheer volume and value of goods transported daily across various industries, necessitating comprehensive cargo transportation insurance. The Motor Vehicle Insurance type holds the largest share within this segment, reflecting the inherent risks associated with operating commercial fleets.
- Dominant Region: North America and Europe are the leading markets, driven by established logistics infrastructure, stringent safety regulations, and a high concentration of large transportation and logistics companies. Economic policies supporting trade and infrastructure development further bolster these regions.
- Dominant Country: The United States, with its vast geographical expanse and significant trade volumes, represents the largest single market for transportation insurance.
- Key Drivers for Commercial Segment Dominance:
- Increasing global trade and cross-border logistics.
- Rising value of goods in transit.
- Stringent regulatory requirements for commercial vehicle operators.
- Growing adoption of fleet management technologies.
- Key Drivers for Motor Vehicle Insurance Dominance:
- High incidence of road accidents involving commercial vehicles.
- Increasing fleet sizes across various industries.
- Technological advancements in vehicle safety and monitoring systems.
- Emerging Segment: The Personal segment, particularly for ride-sharing services and personal vehicle usage in commercial contexts, is witnessing a steady growth, albeit from a smaller base.
Transportation and Traffic Insurance Product Developments
Product innovation in Transportation and Traffic Insurance is increasingly focused on leveraging technology for enhanced risk mitigation and streamlined claims. Developments include sophisticated telematics-driven policies that reward safe driving behavior and IoT-enabled sensors for real-time cargo condition monitoring, offering granular insights into temperature, humidity, and shock. Parametric insurance solutions are gaining traction, enabling automatic payouts based on pre-defined triggers like weather events or delivery delays, significantly reducing claim processing times and providing greater financial certainty for policyholders. These innovations offer competitive advantages by lowering premiums, improving operational efficiency, and enhancing overall customer satisfaction in the freight insurance and logistics insurance spaces.
Key Drivers of Transportation and Traffic Insurance Growth
The growth of the Transportation and Traffic Insurance market is propelled by a confluence of factors. Technological advancements, such as the proliferation of telematics and IoT devices, enable more accurate risk assessment and proactive risk management for commercial auto insurance. Economic growth and the expansion of global trade continue to drive higher volumes of goods in transit, increasing the need for cargo transportation insurance. Furthermore, evolving regulatory landscapes, mandating stricter safety standards and insurance coverage for commercial vehicles, act as significant growth accelerators. The increasing complexity of supply chains and the growing adoption of digital solutions also contribute to the demand for specialized and integrated insurance offerings.
Challenges in the Transportation and Traffic Insurance Market
The Transportation and Traffic Insurance market faces several significant challenges. Stringent and varying regulatory hurdles across different jurisdictions can complicate market entry and product standardization. Persistent supply chain disruptions, exacerbated by geopolitical events and climate change, lead to increased claims frequency and severity, impacting underwriting profitability. Intense competitive pressures, particularly from specialized niche insurers and the potential for self-insurance by large entities, can lead to pricing wars and margin erosion. Furthermore, the increasing sophistication of cyber threats targeting connected vehicles and logistics systems presents a growing challenge for motor vehicle insurance providers.
Emerging Opportunities in Transportation and Traffic Insurance
Emerging opportunities in the Transportation and Traffic Insurance market are primarily driven by technological breakthroughs and evolving business models. The widespread adoption of electric and autonomous vehicles presents a unique opportunity for developing tailored insurance products that account for new risk profiles and maintenance requirements. Strategic partnerships between insurance companies and technology providers, particularly in the areas of AI, IoT, and blockchain, can lead to innovative solutions for fraud detection, claims automation, and enhanced risk assessment for truck insurance. Furthermore, expanding into developing markets with growing logistics sectors and offering specialized insurance for emerging transportation modes, such as drone delivery services, represents a significant growth avenue.
Leading Players in the Transportation and Traffic Insurance Sector
- Gallagher US
- Howden UK
- Marsh Commercial
- AXA UK
- Alan & Thomas Insurance
- WRS Insurance Brokers
- QBE European Operations
- Brokerswood Enterprises Limited
- AsstrA
- Grove & Dean Corporate Insurance
- Amwins
- M2 Assurance
- Heath Crawford
- Marsh
- Hensure
- Berkley Insurance
Key Milestones in Transportation and Traffic Insurance Industry
- 2021: Widespread adoption of advanced telematics systems in commercial fleets, enabling real-time driver behavior monitoring and risk reduction for fleet insurance.
- 2022: Introduction of parametric insurance solutions for supply chain disruptions, offering faster payouts for cargo transportation insurance.
- 2023: Increased regulatory focus on cybersecurity for connected vehicles, driving demand for enhanced cyber insurance within motor vehicle insurance.
- 2023: Significant surge in M&A activity, with companies consolidating to gain market share and expand service offerings in the commercial auto insurance sector.
- 2024: Growing interest in insuring electric and hybrid commercial fleets, necessitating specialized underwriting for new vehicle technologies.
Strategic Outlook for Transportation and Traffic Insurance Market
The strategic outlook for the Transportation and Traffic Insurance market is one of sustained growth and innovation. Key growth accelerators include the continued integration of AI and IoT for predictive analytics and proactive risk management, offering insurers unprecedented insights into fleet operations and cargo safety. The expansion of e-commerce and global trade will continue to fuel demand for comprehensive freight insurance and logistics insurance. Furthermore, the development of bespoke insurance products for emerging transportation technologies, such as autonomous vehicles and drone logistics, will unlock new market potential. Strategic partnerships and digital transformation initiatives will be crucial for insurers to remain competitive, enhance customer experience, and adapt to the evolving risk landscape in the truck insurance and broader transportation insurance sectors.
Transportation and Traffic Insurance Segmentation
-
1. Application
- 1.1. Personal
- 1.2. Commercial
- 1.3. Others
-
2. Types
- 2.1. Personal Injury Insurance
- 2.2. Cargo Transportation Insurance
- 2.3. Motor Vehicle Insurance
Transportation and Traffic Insurance Segmentation By Geography
-
1. North America
- 1.1. United States
- 1.2. Canada
- 1.3. Mexico
-
2. South America
- 2.1. Brazil
- 2.2. Argentina
- 2.3. Rest of South America
-
3. Europe
- 3.1. United Kingdom
- 3.2. Germany
- 3.3. France
- 3.4. Italy
- 3.5. Spain
- 3.6. Russia
- 3.7. Benelux
- 3.8. Nordics
- 3.9. Rest of Europe
-
4. Middle East & Africa
- 4.1. Turkey
- 4.2. Israel
- 4.3. GCC
- 4.4. North Africa
- 4.5. South Africa
- 4.6. Rest of Middle East & Africa
-
5. Asia Pacific
- 5.1. China
- 5.2. India
- 5.3. Japan
- 5.4. South Korea
- 5.5. ASEAN
- 5.6. Oceania
- 5.7. Rest of Asia Pacific
Transportation and Traffic Insurance REPORT HIGHLIGHTS
| Aspects | Details |
|---|---|
| Study Period | 2019-2033 |
| Base Year | 2024 |
| Estimated Year | 2025 |
| Forecast Period | 2025-2033 |
| Historical Period | 2019-2024 |
| Growth Rate | CAGR of XX% from 2019-2033 |
| Segmentation |
|
Table of Contents
- 1. Introduction
- 1.1. Research Scope
- 1.2. Market Segmentation
- 1.3. Research Methodology
- 1.4. Definitions and Assumptions
- 2. Executive Summary
- 2.1. Introduction
- 3. Market Dynamics
- 3.1. Introduction
- 3.2. Market Drivers
- 3.3. Market Restrains
- 3.4. Market Trends
- 4. Market Factor Analysis
- 4.1. Porters Five Forces
- 4.2. Supply/Value Chain
- 4.3. PESTEL analysis
- 4.4. Market Entropy
- 4.5. Patent/Trademark Analysis
- 5. Global Transportation and Traffic Insurance Analysis, Insights and Forecast, 2019-2031
- 5.1. Market Analysis, Insights and Forecast - by Application
- 5.1.1. Personal
- 5.1.2. Commercial
- 5.1.3. Others
- 5.2. Market Analysis, Insights and Forecast - by Types
- 5.2.1. Personal Injury Insurance
- 5.2.2. Cargo Transportation Insurance
- 5.2.3. Motor Vehicle Insurance
- 5.3. Market Analysis, Insights and Forecast - by Region
- 5.3.1. North America
- 5.3.2. South America
- 5.3.3. Europe
- 5.3.4. Middle East & Africa
- 5.3.5. Asia Pacific
- 5.1. Market Analysis, Insights and Forecast - by Application
- 6. North America Transportation and Traffic Insurance Analysis, Insights and Forecast, 2019-2031
- 6.1. Market Analysis, Insights and Forecast - by Application
- 6.1.1. Personal
- 6.1.2. Commercial
- 6.1.3. Others
- 6.2. Market Analysis, Insights and Forecast - by Types
- 6.2.1. Personal Injury Insurance
- 6.2.2. Cargo Transportation Insurance
- 6.2.3. Motor Vehicle Insurance
- 6.1. Market Analysis, Insights and Forecast - by Application
- 7. South America Transportation and Traffic Insurance Analysis, Insights and Forecast, 2019-2031
- 7.1. Market Analysis, Insights and Forecast - by Application
- 7.1.1. Personal
- 7.1.2. Commercial
- 7.1.3. Others
- 7.2. Market Analysis, Insights and Forecast - by Types
- 7.2.1. Personal Injury Insurance
- 7.2.2. Cargo Transportation Insurance
- 7.2.3. Motor Vehicle Insurance
- 7.1. Market Analysis, Insights and Forecast - by Application
- 8. Europe Transportation and Traffic Insurance Analysis, Insights and Forecast, 2019-2031
- 8.1. Market Analysis, Insights and Forecast - by Application
- 8.1.1. Personal
- 8.1.2. Commercial
- 8.1.3. Others
- 8.2. Market Analysis, Insights and Forecast - by Types
- 8.2.1. Personal Injury Insurance
- 8.2.2. Cargo Transportation Insurance
- 8.2.3. Motor Vehicle Insurance
- 8.1. Market Analysis, Insights and Forecast - by Application
- 9. Middle East & Africa Transportation and Traffic Insurance Analysis, Insights and Forecast, 2019-2031
- 9.1. Market Analysis, Insights and Forecast - by Application
- 9.1.1. Personal
- 9.1.2. Commercial
- 9.1.3. Others
- 9.2. Market Analysis, Insights and Forecast - by Types
- 9.2.1. Personal Injury Insurance
- 9.2.2. Cargo Transportation Insurance
- 9.2.3. Motor Vehicle Insurance
- 9.1. Market Analysis, Insights and Forecast - by Application
- 10. Asia Pacific Transportation and Traffic Insurance Analysis, Insights and Forecast, 2019-2031
- 10.1. Market Analysis, Insights and Forecast - by Application
- 10.1.1. Personal
- 10.1.2. Commercial
- 10.1.3. Others
- 10.2. Market Analysis, Insights and Forecast - by Types
- 10.2.1. Personal Injury Insurance
- 10.2.2. Cargo Transportation Insurance
- 10.2.3. Motor Vehicle Insurance
- 10.1. Market Analysis, Insights and Forecast - by Application
- 11. Competitive Analysis
- 11.1. Global Market Share Analysis 2024
- 11.2. Company Profiles
- 11.2.1 Gallagher US
- 11.2.1.1. Overview
- 11.2.1.2. Products
- 11.2.1.3. SWOT Analysis
- 11.2.1.4. Recent Developments
- 11.2.1.5. Financials (Based on Availability)
- 11.2.2 Howden UK
- 11.2.2.1. Overview
- 11.2.2.2. Products
- 11.2.2.3. SWOT Analysis
- 11.2.2.4. Recent Developments
- 11.2.2.5. Financials (Based on Availability)
- 11.2.3 Marsh Commercial
- 11.2.3.1. Overview
- 11.2.3.2. Products
- 11.2.3.3. SWOT Analysis
- 11.2.3.4. Recent Developments
- 11.2.3.5. Financials (Based on Availability)
- 11.2.4 AXA UK
- 11.2.4.1. Overview
- 11.2.4.2. Products
- 11.2.4.3. SWOT Analysis
- 11.2.4.4. Recent Developments
- 11.2.4.5. Financials (Based on Availability)
- 11.2.5 Alan & Thomas Insurance
- 11.2.5.1. Overview
- 11.2.5.2. Products
- 11.2.5.3. SWOT Analysis
- 11.2.5.4. Recent Developments
- 11.2.5.5. Financials (Based on Availability)
- 11.2.6 WRS Insurance Brokers
- 11.2.6.1. Overview
- 11.2.6.2. Products
- 11.2.6.3. SWOT Analysis
- 11.2.6.4. Recent Developments
- 11.2.6.5. Financials (Based on Availability)
- 11.2.7 QBE European Operations
- 11.2.7.1. Overview
- 11.2.7.2. Products
- 11.2.7.3. SWOT Analysis
- 11.2.7.4. Recent Developments
- 11.2.7.5. Financials (Based on Availability)
- 11.2.8 Brokerswood Enterprises Limited
- 11.2.8.1. Overview
- 11.2.8.2. Products
- 11.2.8.3. SWOT Analysis
- 11.2.8.4. Recent Developments
- 11.2.8.5. Financials (Based on Availability)
- 11.2.9 AsstrA
- 11.2.9.1. Overview
- 11.2.9.2. Products
- 11.2.9.3. SWOT Analysis
- 11.2.9.4. Recent Developments
- 11.2.9.5. Financials (Based on Availability)
- 11.2.10 Grove & Dean Corporate Insurance
- 11.2.10.1. Overview
- 11.2.10.2. Products
- 11.2.10.3. SWOT Analysis
- 11.2.10.4. Recent Developments
- 11.2.10.5. Financials (Based on Availability)
- 11.2.11 Amwins
- 11.2.11.1. Overview
- 11.2.11.2. Products
- 11.2.11.3. SWOT Analysis
- 11.2.11.4. Recent Developments
- 11.2.11.5. Financials (Based on Availability)
- 11.2.12 M2 Assurance
- 11.2.12.1. Overview
- 11.2.12.2. Products
- 11.2.12.3. SWOT Analysis
- 11.2.12.4. Recent Developments
- 11.2.12.5. Financials (Based on Availability)
- 11.2.13 Heath Crawford
- 11.2.13.1. Overview
- 11.2.13.2. Products
- 11.2.13.3. SWOT Analysis
- 11.2.13.4. Recent Developments
- 11.2.13.5. Financials (Based on Availability)
- 11.2.14 Marsh
- 11.2.14.1. Overview
- 11.2.14.2. Products
- 11.2.14.3. SWOT Analysis
- 11.2.14.4. Recent Developments
- 11.2.14.5. Financials (Based on Availability)
- 11.2.15 Hensure
- 11.2.15.1. Overview
- 11.2.15.2. Products
- 11.2.15.3. SWOT Analysis
- 11.2.15.4. Recent Developments
- 11.2.15.5. Financials (Based on Availability)
- 11.2.16 Berkley Insurance
- 11.2.16.1. Overview
- 11.2.16.2. Products
- 11.2.16.3. SWOT Analysis
- 11.2.16.4. Recent Developments
- 11.2.16.5. Financials (Based on Availability)
- 11.2.1 Gallagher US
List of Figures
- Figure 1: Global Transportation and Traffic Insurance Revenue Breakdown (million, %) by Region 2024 & 2032
- Figure 2: North America Transportation and Traffic Insurance Revenue (million), by Application 2024 & 2032
- Figure 3: North America Transportation and Traffic Insurance Revenue Share (%), by Application 2024 & 2032
- Figure 4: North America Transportation and Traffic Insurance Revenue (million), by Types 2024 & 2032
- Figure 5: North America Transportation and Traffic Insurance Revenue Share (%), by Types 2024 & 2032
- Figure 6: North America Transportation and Traffic Insurance Revenue (million), by Country 2024 & 2032
- Figure 7: North America Transportation and Traffic Insurance Revenue Share (%), by Country 2024 & 2032
- Figure 8: South America Transportation and Traffic Insurance Revenue (million), by Application 2024 & 2032
- Figure 9: South America Transportation and Traffic Insurance Revenue Share (%), by Application 2024 & 2032
- Figure 10: South America Transportation and Traffic Insurance Revenue (million), by Types 2024 & 2032
- Figure 11: South America Transportation and Traffic Insurance Revenue Share (%), by Types 2024 & 2032
- Figure 12: South America Transportation and Traffic Insurance Revenue (million), by Country 2024 & 2032
- Figure 13: South America Transportation and Traffic Insurance Revenue Share (%), by Country 2024 & 2032
- Figure 14: Europe Transportation and Traffic Insurance Revenue (million), by Application 2024 & 2032
- Figure 15: Europe Transportation and Traffic Insurance Revenue Share (%), by Application 2024 & 2032
- Figure 16: Europe Transportation and Traffic Insurance Revenue (million), by Types 2024 & 2032
- Figure 17: Europe Transportation and Traffic Insurance Revenue Share (%), by Types 2024 & 2032
- Figure 18: Europe Transportation and Traffic Insurance Revenue (million), by Country 2024 & 2032
- Figure 19: Europe Transportation and Traffic Insurance Revenue Share (%), by Country 2024 & 2032
- Figure 20: Middle East & Africa Transportation and Traffic Insurance Revenue (million), by Application 2024 & 2032
- Figure 21: Middle East & Africa Transportation and Traffic Insurance Revenue Share (%), by Application 2024 & 2032
- Figure 22: Middle East & Africa Transportation and Traffic Insurance Revenue (million), by Types 2024 & 2032
- Figure 23: Middle East & Africa Transportation and Traffic Insurance Revenue Share (%), by Types 2024 & 2032
- Figure 24: Middle East & Africa Transportation and Traffic Insurance Revenue (million), by Country 2024 & 2032
- Figure 25: Middle East & Africa Transportation and Traffic Insurance Revenue Share (%), by Country 2024 & 2032
- Figure 26: Asia Pacific Transportation and Traffic Insurance Revenue (million), by Application 2024 & 2032
- Figure 27: Asia Pacific Transportation and Traffic Insurance Revenue Share (%), by Application 2024 & 2032
- Figure 28: Asia Pacific Transportation and Traffic Insurance Revenue (million), by Types 2024 & 2032
- Figure 29: Asia Pacific Transportation and Traffic Insurance Revenue Share (%), by Types 2024 & 2032
- Figure 30: Asia Pacific Transportation and Traffic Insurance Revenue (million), by Country 2024 & 2032
- Figure 31: Asia Pacific Transportation and Traffic Insurance Revenue Share (%), by Country 2024 & 2032
List of Tables
- Table 1: Global Transportation and Traffic Insurance Revenue million Forecast, by Region 2019 & 2032
- Table 2: Global Transportation and Traffic Insurance Revenue million Forecast, by Application 2019 & 2032
- Table 3: Global Transportation and Traffic Insurance Revenue million Forecast, by Types 2019 & 2032
- Table 4: Global Transportation and Traffic Insurance Revenue million Forecast, by Region 2019 & 2032
- Table 5: Global Transportation and Traffic Insurance Revenue million Forecast, by Application 2019 & 2032
- Table 6: Global Transportation and Traffic Insurance Revenue million Forecast, by Types 2019 & 2032
- Table 7: Global Transportation and Traffic Insurance Revenue million Forecast, by Country 2019 & 2032
- Table 8: United States Transportation and Traffic Insurance Revenue (million) Forecast, by Application 2019 & 2032
- Table 9: Canada Transportation and Traffic Insurance Revenue (million) Forecast, by Application 2019 & 2032
- Table 10: Mexico Transportation and Traffic Insurance Revenue (million) Forecast, by Application 2019 & 2032
- Table 11: Global Transportation and Traffic Insurance Revenue million Forecast, by Application 2019 & 2032
- Table 12: Global Transportation and Traffic Insurance Revenue million Forecast, by Types 2019 & 2032
- Table 13: Global Transportation and Traffic Insurance Revenue million Forecast, by Country 2019 & 2032
- Table 14: Brazil Transportation and Traffic Insurance Revenue (million) Forecast, by Application 2019 & 2032
- Table 15: Argentina Transportation and Traffic Insurance Revenue (million) Forecast, by Application 2019 & 2032
- Table 16: Rest of South America Transportation and Traffic Insurance Revenue (million) Forecast, by Application 2019 & 2032
- Table 17: Global Transportation and Traffic Insurance Revenue million Forecast, by Application 2019 & 2032
- Table 18: Global Transportation and Traffic Insurance Revenue million Forecast, by Types 2019 & 2032
- Table 19: Global Transportation and Traffic Insurance Revenue million Forecast, by Country 2019 & 2032
- Table 20: United Kingdom Transportation and Traffic Insurance Revenue (million) Forecast, by Application 2019 & 2032
- Table 21: Germany Transportation and Traffic Insurance Revenue (million) Forecast, by Application 2019 & 2032
- Table 22: France Transportation and Traffic Insurance Revenue (million) Forecast, by Application 2019 & 2032
- Table 23: Italy Transportation and Traffic Insurance Revenue (million) Forecast, by Application 2019 & 2032
- Table 24: Spain Transportation and Traffic Insurance Revenue (million) Forecast, by Application 2019 & 2032
- Table 25: Russia Transportation and Traffic Insurance Revenue (million) Forecast, by Application 2019 & 2032
- Table 26: Benelux Transportation and Traffic Insurance Revenue (million) Forecast, by Application 2019 & 2032
- Table 27: Nordics Transportation and Traffic Insurance Revenue (million) Forecast, by Application 2019 & 2032
- Table 28: Rest of Europe Transportation and Traffic Insurance Revenue (million) Forecast, by Application 2019 & 2032
- Table 29: Global Transportation and Traffic Insurance Revenue million Forecast, by Application 2019 & 2032
- Table 30: Global Transportation and Traffic Insurance Revenue million Forecast, by Types 2019 & 2032
- Table 31: Global Transportation and Traffic Insurance Revenue million Forecast, by Country 2019 & 2032
- Table 32: Turkey Transportation and Traffic Insurance Revenue (million) Forecast, by Application 2019 & 2032
- Table 33: Israel Transportation and Traffic Insurance Revenue (million) Forecast, by Application 2019 & 2032
- Table 34: GCC Transportation and Traffic Insurance Revenue (million) Forecast, by Application 2019 & 2032
- Table 35: North Africa Transportation and Traffic Insurance Revenue (million) Forecast, by Application 2019 & 2032
- Table 36: South Africa Transportation and Traffic Insurance Revenue (million) Forecast, by Application 2019 & 2032
- Table 37: Rest of Middle East & Africa Transportation and Traffic Insurance Revenue (million) Forecast, by Application 2019 & 2032
- Table 38: Global Transportation and Traffic Insurance Revenue million Forecast, by Application 2019 & 2032
- Table 39: Global Transportation and Traffic Insurance Revenue million Forecast, by Types 2019 & 2032
- Table 40: Global Transportation and Traffic Insurance Revenue million Forecast, by Country 2019 & 2032
- Table 41: China Transportation and Traffic Insurance Revenue (million) Forecast, by Application 2019 & 2032
- Table 42: India Transportation and Traffic Insurance Revenue (million) Forecast, by Application 2019 & 2032
- Table 43: Japan Transportation and Traffic Insurance Revenue (million) Forecast, by Application 2019 & 2032
- Table 44: South Korea Transportation and Traffic Insurance Revenue (million) Forecast, by Application 2019 & 2032
- Table 45: ASEAN Transportation and Traffic Insurance Revenue (million) Forecast, by Application 2019 & 2032
- Table 46: Oceania Transportation and Traffic Insurance Revenue (million) Forecast, by Application 2019 & 2032
- Table 47: Rest of Asia Pacific Transportation and Traffic Insurance Revenue (million) Forecast, by Application 2019 & 2032
Frequently Asked Questions
1. What is the projected Compound Annual Growth Rate (CAGR) of the Transportation and Traffic Insurance?
The projected CAGR is approximately XX%.
2. Which companies are prominent players in the Transportation and Traffic Insurance?
Key companies in the market include Gallagher US, Howden UK, Marsh Commercial, AXA UK, Alan & Thomas Insurance, WRS Insurance Brokers, QBE European Operations, Brokerswood Enterprises Limited, AsstrA, Grove & Dean Corporate Insurance, Amwins, M2 Assurance, Heath Crawford, Marsh, Hensure, Berkley Insurance.
3. What are the main segments of the Transportation and Traffic Insurance?
The market segments include Application, Types.
4. Can you provide details about the market size?
The market size is estimated to be USD XXX million as of 2022.
5. What are some drivers contributing to market growth?
N/A
6. What are the notable trends driving market growth?
N/A
7. Are there any restraints impacting market growth?
N/A
8. Can you provide examples of recent developments in the market?
N/A
9. What pricing options are available for accessing the report?
Pricing options include single-user, multi-user, and enterprise licenses priced at USD 3950.00, USD 5925.00, and USD 7900.00 respectively.
10. Is the market size provided in terms of value or volume?
The market size is provided in terms of value, measured in million.
11. Are there any specific market keywords associated with the report?
Yes, the market keyword associated with the report is "Transportation and Traffic Insurance," which aids in identifying and referencing the specific market segment covered.
12. How do I determine which pricing option suits my needs best?
The pricing options vary based on user requirements and access needs. Individual users may opt for single-user licenses, while businesses requiring broader access may choose multi-user or enterprise licenses for cost-effective access to the report.
13. Are there any additional resources or data provided in the Transportation and Traffic Insurance report?
While the report offers comprehensive insights, it's advisable to review the specific contents or supplementary materials provided to ascertain if additional resources or data are available.
14. How can I stay updated on further developments or reports in the Transportation and Traffic Insurance?
To stay informed about further developments, trends, and reports in the Transportation and Traffic Insurance, consider subscribing to industry newsletters, following relevant companies and organizations, or regularly checking reputable industry news sources and publications.
Methodology
Step 1 - Identification of Relevant Samples Size from Population Database


Step 2 - Approaches for Defining Global Market Size (Value, Volume* & Price*)

Note*: In applicable scenarios
Step 3 - Data Sources
Primary Research
- Web Analytics
- Survey Reports
- Research Institute
- Latest Research Reports
- Opinion Leaders
Secondary Research
- Annual Reports
- White Paper
- Latest Press Release
- Industry Association
- Paid Database
- Investor Presentations

Step 4 - Data Triangulation
Involves using different sources of information in order to increase the validity of a study
These sources are likely to be stakeholders in a program - participants, other researchers, program staff, other community members, and so on.
Then we put all data in single framework & apply various statistical tools to find out the dynamic on the market.
During the analysis stage, feedback from the stakeholder groups would be compared to determine areas of agreement as well as areas of divergence
