

Key Insights
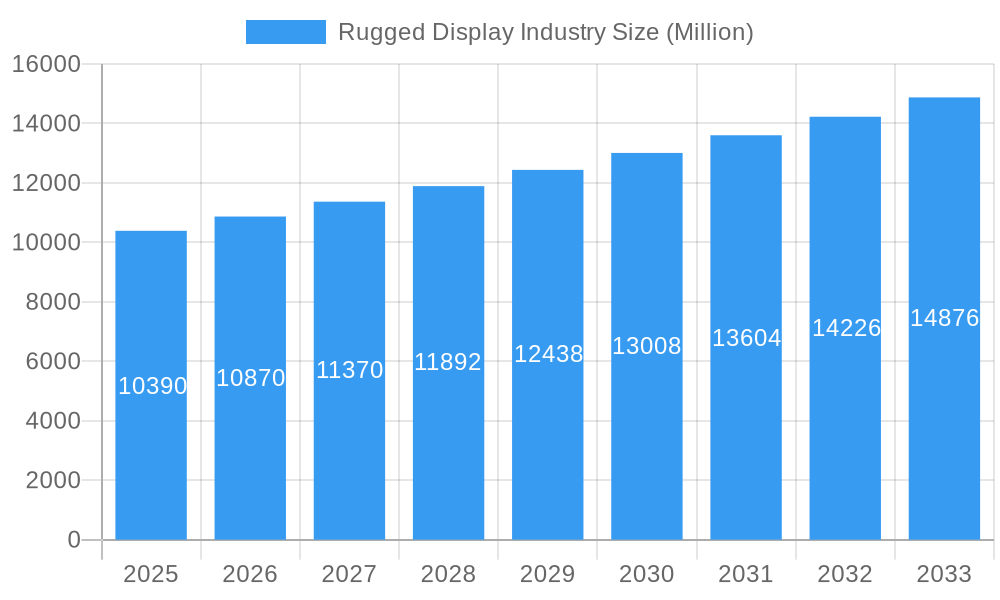
The rugged display market, valued at $10.39 billion in 2025, is projected to experience robust growth, driven by increasing demand across diverse sectors. A compound annual growth rate (CAGR) of 4.43% from 2025 to 2033 indicates a significant expansion, fueled by several key factors. The rising adoption of ruggedized devices in demanding environments, such as oil and gas exploration, military operations, and industrial automation, is a primary driver. Advancements in display technology, including higher resolutions, improved brightness, and enhanced durability, are further stimulating market growth. The increasing integration of rugged displays into smartphones, tablets, laptops, and specialized equipment like avionics displays and vehicle-mounted computers is also contributing to this expansion. Segmentation reveals that fully-rugged displays command a significant market share due to their superior protection against harsh conditions. Windows and Android operating systems dominate the OS segment, reflecting the widespread use of these platforms in ruggedized devices. Geographically, North America and Europe currently hold larger market shares, though the Asia-Pacific region is anticipated to witness substantial growth due to increasing industrialization and infrastructure development.
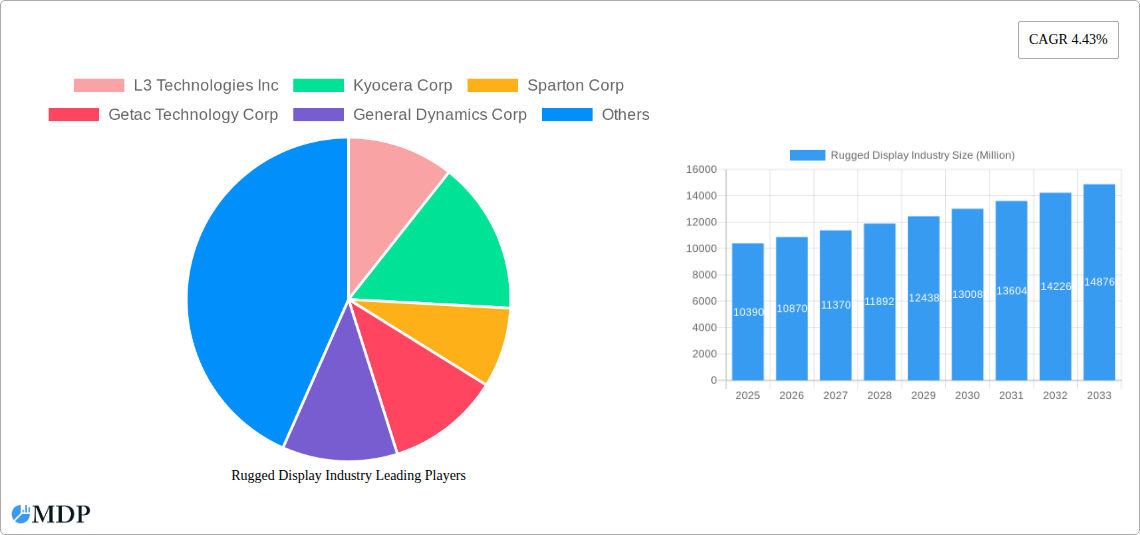
Rugged Display Industry Market Size (In Billion)
Competition within the rugged display market is intense, with established players like L3 Technologies, Kyocera, Getac, and others vying for market share through technological innovation and strategic partnerships. However, the market is also witnessing the emergence of new entrants offering specialized solutions tailored to niche applications. While the market is experiencing significant growth, challenges remain, including the high cost of ruggedized displays and the need for ongoing research and development to enhance durability and performance in increasingly demanding operational environments. Future growth will be influenced by factors such as technological breakthroughs, regulatory changes, and evolving end-user needs across various industry segments. The market's sustained growth trajectory makes it an attractive investment opportunity for both established players and new entrants willing to navigate the complexities of this specialized sector.
Rugged Display Industry Company Market Share
Rugged Display Industry Market Report: 2019-2033 Forecast
This comprehensive report provides a detailed analysis of the global rugged display industry, offering invaluable insights for stakeholders, investors, and industry professionals. Covering the period from 2019 to 2033, with a focus on 2025, this report unveils the market dynamics, trends, leading players, and future growth potential. The report is meticulously structured to provide actionable insights, incorporating high-impact keywords for optimal search engine visibility. Expect detailed breakdowns of market segments, competitive landscapes, and emerging opportunities, all supported by robust data and analysis. The market size is projected to reach xx Million by 2033.
Rugged Display Industry Market Dynamics & Concentration
The rugged display market, valued at xx Million in 2024, exhibits a moderately concentrated landscape with key players vying for market share. Innovation in display technologies, such as advancements in miniaturization, improved brightness, and enhanced durability, are significant drivers. Stringent regulatory frameworks, particularly within the defense and aerospace sectors, impact product design and manufacturing. The existence of substitute technologies, such as projected displays, presents ongoing competitive pressure. End-user trends favor increased adoption of ruggedized displays across various sectors, fueled by growing demands for reliable and durable devices in challenging environments. M&A activity has been relatively moderate in recent years, with approximately xx deals recorded between 2019 and 2024, resulting in a market share consolidation among the leading players.
- Market Concentration: Moderately Concentrated
- Innovation Drivers: Miniaturization, improved brightness, enhanced durability
- Regulatory Frameworks: Stringent standards in defense and aerospace
- Product Substitutes: Projected displays
- M&A Activity (2019-2024): xx deals
Rugged Display Industry Industry Trends & Analysis
The rugged display market demonstrates a robust Compound Annual Growth Rate (CAGR) of xx% during the forecast period (2025-2033). This growth is primarily driven by increasing demand from sectors like defense, industrial automation, and healthcare, where the need for durable and reliable displays in harsh environments is paramount. Technological disruptions, including the adoption of advanced materials and improved display technologies (e.g., microLED), are significantly influencing market dynamics. Consumer preferences shift towards displays with enhanced features like higher resolution, wider viewing angles, and improved touch sensitivity. Intense competitive dynamics, characterized by both price competition and technological innovation, are shaping the market landscape. Market penetration of rugged displays in niche applications continues to rise, particularly in emerging markets.
Leading Markets & Segments in Rugged Display Industry
North America currently dominates the rugged display market, driven by robust government spending on defense and aerospace technologies, as well as a strong industrial sector. Within product types, the demand for fully ruggedized laptops and notebooks is significant, fueled by their use in demanding industrial settings and by military personnel. The fully rugged segment holds the largest market share, reflecting the preference for robust devices capable of withstanding extreme conditions. The Windows operating system remains dominant, though Android adoption is steadily growing, especially in handheld devices.
- Key Drivers for North American Dominance: Strong government spending (defense, aerospace), robust industrial sector
- Dominant Product Type: Fully-rugged Laptops and Notebooks
- Dominant Level of Ruggedness: Fully-rugged
- Dominant Operating System: Windows
Other Key Segments:
- Government, Defense, and Aerospace: This end-user segment drives significant demand due to the need for dependable displays in military applications and critical infrastructure.
- Industrial: The industrial sector utilizes rugged displays extensively in manufacturing, logistics, and field service operations.
- Automotive and Transportation: Demand is driven by applications such as in-vehicle infotainment and fleet management systems.
Rugged Display Industry Product Developments
Recent product innovations focus on increasing brightness, improving readability in sunlight, and enhancing touch sensitivity even with gloves. The integration of advanced features such as augmented reality (AR) and GPS is also gaining traction. These advancements cater to the diverse needs of various end-user industries, providing competitive advantages through improved functionality and usability. The market is witnessing a shift towards lighter, more energy-efficient displays, reflecting environmental concerns and the need for extended battery life in mobile applications.
Key Drivers of Rugged Display Industry Growth
The rugged display market's growth is propelled by several factors. Technological advancements, such as improved display technologies and increased processing power, are key drivers. The increasing adoption of rugged displays across diverse sectors, such as oil and gas, and defense and aerospace, further fuels market expansion. Favorable government policies and investments in infrastructure development in various regions also contribute to the market's growth trajectory.
Challenges in the Rugged Display Industry Market
The industry faces challenges including supply chain disruptions, particularly regarding sourcing specialized components and raw materials. High manufacturing costs and the need for specialized testing and certification processes pose significant barriers to entry. Intense competition from established players and the emergence of new entrants with innovative solutions create significant competitive pressures.
Emerging Opportunities in Rugged Display Industry
The integration of 5G technology and the rising adoption of AI-powered functionalities offer lucrative growth avenues. Strategic partnerships and collaborations between display manufacturers and system integrators can create innovative solutions tailored to specific end-user needs. Expansion into emerging markets, particularly in Asia-Pacific, presents significant opportunities for market growth. Miniaturization of displays while maintaining durability continues to be a key area of focus, enhancing overall market demand.
Leading Players in the Rugged Display Industry Sector
Key Milestones in Rugged Display Industry Industry
- 2020: Introduction of xx new rugged display models with improved brightness and durability by leading manufacturers.
- 2022: Significant investment in R&D for miniaturization and power efficiency in rugged displays.
- 2023: Merger between two mid-sized rugged display manufacturers leading to increased market consolidation.
Strategic Outlook for Rugged Display Industry Market
The rugged display market is poised for continued growth, driven by technological innovations and the increasing demand across diverse industries. Strategic investments in R&D, focusing on advanced display technologies and sustainable manufacturing practices, will be crucial for market leadership. Companies focusing on niche applications and developing specialized solutions will also be well-positioned for success. Expansion into emerging markets and strategic partnerships will further accelerate market growth in the coming years.
Rugged Display Industry Segmentation
-
1. Product Type
- 1.1. Smartphone and Handheld Computer
- 1.2. Tablet PC
- 1.3. Laptop and Notebook
- 1.4. Avionics Display
- 1.5. Vehicle-mounted Computer
- 1.6. Panel PC and Mission-critical Display
-
2. Level of Ruggedness
- 2.1. Semi-rugged
- 2.2. Fully-rugged
- 2.3. Ultra-rugged
-
3. Operating System
- 3.1. Android
- 3.2. Windows
- 3.3. Other Operating Systems
-
4. End User
- 4.1. Oil and Gas
- 4.2. Government, Defense, and Aerospace
- 4.3. Industrial
- 4.4. Automotive and Transportation
- 4.5. Healthcare
- 4.6. Other End Users
Rugged Display Industry Segmentation By Geography
- 1. North America
- 2. Europe
- 3. Asia Pacific
- 4. Latin America
- 5. Middle East and Africa
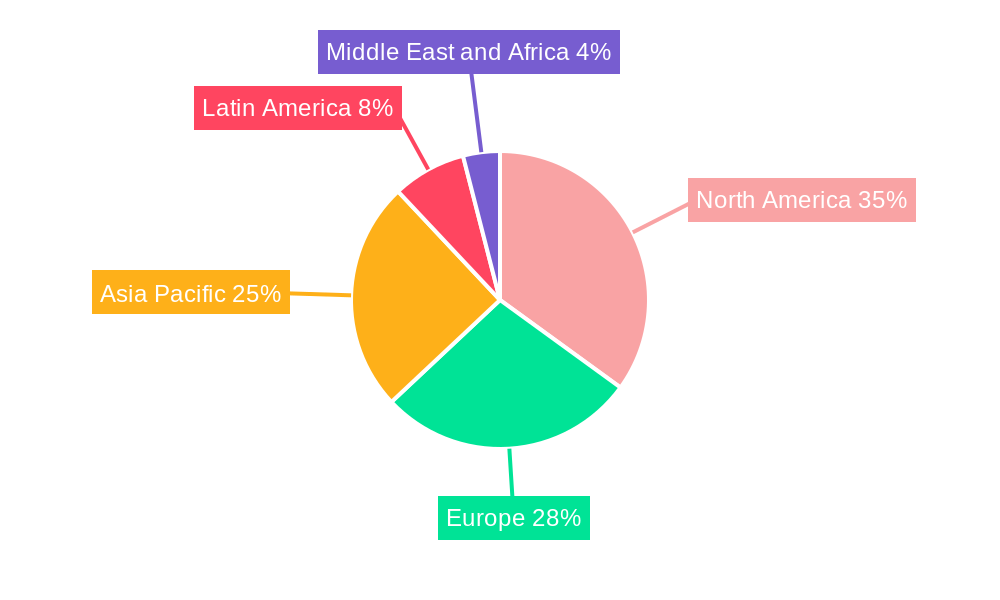
Rugged Display Industry Regional Market Share
Geographic Coverage of Rugged Display Industry
Rugged Display Industry REPORT HIGHLIGHTS
| Aspects | Details |
|---|---|
| Study Period | 2020-2034 |
| Base Year | 2025 |
| Estimated Year | 2026 |
| Forecast Period | 2026-2034 |
| Historical Period | 2020-2025 |
| Growth Rate | CAGR of 4.43% from 2020-2034 |
| Segmentation |
|
Table of Contents
- 1. Introduction
- 1.1. Research Scope
- 1.2. Market Segmentation
- 1.3. Research Objective
- 1.4. Definitions and Assumptions
- 2. Executive Summary
- 2.1. Market Snapshot
- 3. Market Dynamics
- 3.1. Market Drivers
- 3.2. Market Restrains
- 3.3. Market Trends
- 3.4. Market Opportunities
- 4. Market Factor Analysis
- 4.1. Porters Five Forces
- 4.1.1. Bargaining Power of Suppliers
- 4.1.2. Bargaining Power of Buyers
- 4.1.3. Threat of New Entrants
- 4.1.4. Threat of Substitutes
- 4.1.5. Competitive Rivalry
- 4.2. PESTEL analysis
- 4.3. BCG Analysis
- 4.3.1. Stars (High Growth, High Market Share)
- 4.3.2. Cash Cows (Low Growth, High Market Share)
- 4.3.3. Question Mark (High Growth, Low Market Share)
- 4.3.4. Dogs (Low Growth, Low Market Share)
- 4.4. Ansoff Matrix Analysis
- 4.5. Supply Chain Analysis
- 4.6. Regulatory Landscape
- 4.7. Current Market Potential and Opportunity Assessment (TAM–SAM–SOM Framework)
- 4.8. MDP Analyst Note
- 4.1. Porters Five Forces
- 5. Market Analysis, Insights and Forecast 2021-2033
- 5.1. Market Analysis, Insights and Forecast - by Product Type
- 5.1.1. Smartphone and Handheld Computer
- 5.1.2. Tablet PC
- 5.1.3. Laptop and Notebook
- 5.1.4. Avionics Display
- 5.1.5. Vehicle-mounted Computer
- 5.1.6. Panel PC and Mission-critical Display
- 5.2. Market Analysis, Insights and Forecast - by Level of Ruggedness
- 5.2.1. Semi-rugged
- 5.2.2. Fully-rugged
- 5.2.3. Ultra-rugged
- 5.3. Market Analysis, Insights and Forecast - by Operating System
- 5.3.1. Android
- 5.3.2. Windows
- 5.3.3. Other Operating Systems
- 5.4. Market Analysis, Insights and Forecast - by End User
- 5.4.1. Oil and Gas
- 5.4.2. Government, Defense, and Aerospace
- 5.4.3. Industrial
- 5.4.4. Automotive and Transportation
- 5.4.5. Healthcare
- 5.4.6. Other End Users
- 5.5. Market Analysis, Insights and Forecast - by Region
- 5.5.1. North America
- 5.5.2. Europe
- 5.5.3. Asia Pacific
- 5.5.4. Latin America
- 5.5.5. Middle East and Africa
- 5.1. Market Analysis, Insights and Forecast - by Product Type
- 6. Global Rugged Display Industry Analysis, Insights and Forecast, 2021-2033
- 6.1. Market Analysis, Insights and Forecast - by Product Type
- 6.1.1. Smartphone and Handheld Computer
- 6.1.2. Tablet PC
- 6.1.3. Laptop and Notebook
- 6.1.4. Avionics Display
- 6.1.5. Vehicle-mounted Computer
- 6.1.6. Panel PC and Mission-critical Display
- 6.2. Market Analysis, Insights and Forecast - by Level of Ruggedness
- 6.2.1. Semi-rugged
- 6.2.2. Fully-rugged
- 6.2.3. Ultra-rugged
- 6.3. Market Analysis, Insights and Forecast - by Operating System
- 6.3.1. Android
- 6.3.2. Windows
- 6.3.3. Other Operating Systems
- 6.4. Market Analysis, Insights and Forecast - by End User
- 6.4.1. Oil and Gas
- 6.4.2. Government, Defense, and Aerospace
- 6.4.3. Industrial
- 6.4.4. Automotive and Transportation
- 6.4.5. Healthcare
- 6.4.6. Other End Users
- 6.1. Market Analysis, Insights and Forecast - by Product Type
- 7. North America Rugged Display Industry Analysis, Insights and Forecast, 2020-2032
- 7.1. Market Analysis, Insights and Forecast - by Product Type
- 7.1.1. Smartphone and Handheld Computer
- 7.1.2. Tablet PC
- 7.1.3. Laptop and Notebook
- 7.1.4. Avionics Display
- 7.1.5. Vehicle-mounted Computer
- 7.1.6. Panel PC and Mission-critical Display
- 7.2. Market Analysis, Insights and Forecast - by Level of Ruggedness
- 7.2.1. Semi-rugged
- 7.2.2. Fully-rugged
- 7.2.3. Ultra-rugged
- 7.3. Market Analysis, Insights and Forecast - by Operating System
- 7.3.1. Android
- 7.3.2. Windows
- 7.3.3. Other Operating Systems
- 7.4. Market Analysis, Insights and Forecast - by End User
- 7.4.1. Oil and Gas
- 7.4.2. Government, Defense, and Aerospace
- 7.4.3. Industrial
- 7.4.4. Automotive and Transportation
- 7.4.5. Healthcare
- 7.4.6. Other End Users
- 7.1. Market Analysis, Insights and Forecast - by Product Type
- 8. Europe Rugged Display Industry Analysis, Insights and Forecast, 2020-2032
- 8.1. Market Analysis, Insights and Forecast - by Product Type
- 8.1.1. Smartphone and Handheld Computer
- 8.1.2. Tablet PC
- 8.1.3. Laptop and Notebook
- 8.1.4. Avionics Display
- 8.1.5. Vehicle-mounted Computer
- 8.1.6. Panel PC and Mission-critical Display
- 8.2. Market Analysis, Insights and Forecast - by Level of Ruggedness
- 8.2.1. Semi-rugged
- 8.2.2. Fully-rugged
- 8.2.3. Ultra-rugged
- 8.3. Market Analysis, Insights and Forecast - by Operating System
- 8.3.1. Android
- 8.3.2. Windows
- 8.3.3. Other Operating Systems
- 8.4. Market Analysis, Insights and Forecast - by End User
- 8.4.1. Oil and Gas
- 8.4.2. Government, Defense, and Aerospace
- 8.4.3. Industrial
- 8.4.4. Automotive and Transportation
- 8.4.5. Healthcare
- 8.4.6. Other End Users
- 8.1. Market Analysis, Insights and Forecast - by Product Type
- 9. Asia Pacific Rugged Display Industry Analysis, Insights and Forecast, 2020-2032
- 9.1. Market Analysis, Insights and Forecast - by Product Type
- 9.1.1. Smartphone and Handheld Computer
- 9.1.2. Tablet PC
- 9.1.3. Laptop and Notebook
- 9.1.4. Avionics Display
- 9.1.5. Vehicle-mounted Computer
- 9.1.6. Panel PC and Mission-critical Display
- 9.2. Market Analysis, Insights and Forecast - by Level of Ruggedness
- 9.2.1. Semi-rugged
- 9.2.2. Fully-rugged
- 9.2.3. Ultra-rugged
- 9.3. Market Analysis, Insights and Forecast - by Operating System
- 9.3.1. Android
- 9.3.2. Windows
- 9.3.3. Other Operating Systems
- 9.4. Market Analysis, Insights and Forecast - by End User
- 9.4.1. Oil and Gas
- 9.4.2. Government, Defense, and Aerospace
- 9.4.3. Industrial
- 9.4.4. Automotive and Transportation
- 9.4.5. Healthcare
- 9.4.6. Other End Users
- 9.1. Market Analysis, Insights and Forecast - by Product Type
- 10. Latin America Rugged Display Industry Analysis, Insights and Forecast, 2020-2032
- 10.1. Market Analysis, Insights and Forecast - by Product Type
- 10.1.1. Smartphone and Handheld Computer
- 10.1.2. Tablet PC
- 10.1.3. Laptop and Notebook
- 10.1.4. Avionics Display
- 10.1.5. Vehicle-mounted Computer
- 10.1.6. Panel PC and Mission-critical Display
- 10.2. Market Analysis, Insights and Forecast - by Level of Ruggedness
- 10.2.1. Semi-rugged
- 10.2.2. Fully-rugged
- 10.2.3. Ultra-rugged
- 10.3. Market Analysis, Insights and Forecast - by Operating System
- 10.3.1. Android
- 10.3.2. Windows
- 10.3.3. Other Operating Systems
- 10.4. Market Analysis, Insights and Forecast - by End User
- 10.4.1. Oil and Gas
- 10.4.2. Government, Defense, and Aerospace
- 10.4.3. Industrial
- 10.4.4. Automotive and Transportation
- 10.4.5. Healthcare
- 10.4.6. Other End Users
- 10.1. Market Analysis, Insights and Forecast - by Product Type
- 11. Middle East and Africa Rugged Display Industry Analysis, Insights and Forecast, 2020-2032
- 11.1. Market Analysis, Insights and Forecast - by Product Type
- 11.1.1. Smartphone and Handheld Computer
- 11.1.2. Tablet PC
- 11.1.3. Laptop and Notebook
- 11.1.4. Avionics Display
- 11.1.5. Vehicle-mounted Computer
- 11.1.6. Panel PC and Mission-critical Display
- 11.2. Market Analysis, Insights and Forecast - by Level of Ruggedness
- 11.2.1. Semi-rugged
- 11.2.2. Fully-rugged
- 11.2.3. Ultra-rugged
- 11.3. Market Analysis, Insights and Forecast - by Operating System
- 11.3.1. Android
- 11.3.2. Windows
- 11.3.3. Other Operating Systems
- 11.4. Market Analysis, Insights and Forecast - by End User
- 11.4.1. Oil and Gas
- 11.4.2. Government, Defense, and Aerospace
- 11.4.3. Industrial
- 11.4.4. Automotive and Transportation
- 11.4.5. Healthcare
- 11.4.6. Other End Users
- 11.1. Market Analysis, Insights and Forecast - by Product Type
- 12. Competitive Analysis
- 12.1. Company Profiles
- 12.1.1 L3 Technologies Inc
- 12.1.1.1. Company Overview
- 12.1.1.2. Products
- 12.1.1.3. Company Financials
- 12.1.1.4. SWOT Analysis
- 12.1.2 Kyocera Corp
- 12.1.2.1. Company Overview
- 12.1.2.2. Products
- 12.1.2.3. Company Financials
- 12.1.2.4. SWOT Analysis
- 12.1.3 Sparton Corp
- 12.1.3.1. Company Overview
- 12.1.3.2. Products
- 12.1.3.3. Company Financials
- 12.1.3.4. SWOT Analysis
- 12.1.4 Getac Technology Corp
- 12.1.4.1. Company Overview
- 12.1.4.2. Products
- 12.1.4.3. Company Financials
- 12.1.4.4. SWOT Analysis
- 12.1.5 General Dynamics Corp
- 12.1.5.1. Company Overview
- 12.1.5.2. Products
- 12.1.5.3. Company Financials
- 12.1.5.4. SWOT Analysis
- 12.1.6 Dell Inc
- 12.1.6.1. Company Overview
- 12.1.6.2. Products
- 12.1.6.3. Company Financials
- 12.1.6.4. SWOT Analysis
- 12.1.7 Xplore Technologies Corp
- 12.1.7.1. Company Overview
- 12.1.7.2. Products
- 12.1.7.3. Company Financials
- 12.1.7.4. SWOT Analysis
- 12.1.8 Beijer Electronics AB
- 12.1.8.1. Company Overview
- 12.1.8.2. Products
- 12.1.8.3. Company Financials
- 12.1.8.4. SWOT Analysis
- 12.1.9 Zebra Technologies Corp
- 12.1.9.1. Company Overview
- 12.1.9.2. Products
- 12.1.9.3. Company Financials
- 12.1.9.4. SWOT Analysis
- 12.1.10 Esterline Technologies Corp
- 12.1.10.1. Company Overview
- 12.1.10.2. Products
- 12.1.10.3. Company Financials
- 12.1.10.4. SWOT Analysis
- 12.1.11 Curtiss-Wright Corp
- 12.1.11.1. Company Overview
- 12.1.11.2. Products
- 12.1.11.3. Company Financials
- 12.1.11.4. SWOT Analysis
- 12.1.12 Panasonic Corporation
- 12.1.12.1. Company Overview
- 12.1.12.2. Products
- 12.1.12.3. Company Financials
- 12.1.12.4. SWOT Analysis
- 12.1.1 L3 Technologies Inc
- 12.2. Market Entropy
- 12.2.1 Company's Key Areas Served
- 12.2.2 Recent Developments
- 12.3. Company Market Share Analysis 2025
- 12.3.1 Top 5 Companies Market Share Analysis
- 12.3.2 Top 3 Companies Market Share Analysis
- 12.4. List of Potential Customers
- 13. Research Methodology
List of Figures
- Figure 1: Global Rugged Display Industry Revenue Breakdown (Million, %) by Region 2025 & 2033
- Figure 2: North America Rugged Display Industry Revenue (Million), by Product Type 2025 & 2033
- Figure 3: North America Rugged Display Industry Revenue Share (%), by Product Type 2025 & 2033
- Figure 4: North America Rugged Display Industry Revenue (Million), by Level of Ruggedness 2025 & 2033
- Figure 5: North America Rugged Display Industry Revenue Share (%), by Level of Ruggedness 2025 & 2033
- Figure 6: North America Rugged Display Industry Revenue (Million), by Operating System 2025 & 2033
- Figure 7: North America Rugged Display Industry Revenue Share (%), by Operating System 2025 & 2033
- Figure 8: North America Rugged Display Industry Revenue (Million), by End User 2025 & 2033
- Figure 9: North America Rugged Display Industry Revenue Share (%), by End User 2025 & 2033
- Figure 10: North America Rugged Display Industry Revenue (Million), by Country 2025 & 2033
- Figure 11: North America Rugged Display Industry Revenue Share (%), by Country 2025 & 2033
- Figure 12: Europe Rugged Display Industry Revenue (Million), by Product Type 2025 & 2033
- Figure 13: Europe Rugged Display Industry Revenue Share (%), by Product Type 2025 & 2033
- Figure 14: Europe Rugged Display Industry Revenue (Million), by Level of Ruggedness 2025 & 2033
- Figure 15: Europe Rugged Display Industry Revenue Share (%), by Level of Ruggedness 2025 & 2033
- Figure 16: Europe Rugged Display Industry Revenue (Million), by Operating System 2025 & 2033
- Figure 17: Europe Rugged Display Industry Revenue Share (%), by Operating System 2025 & 2033
- Figure 18: Europe Rugged Display Industry Revenue (Million), by End User 2025 & 2033
- Figure 19: Europe Rugged Display Industry Revenue Share (%), by End User 2025 & 2033
- Figure 20: Europe Rugged Display Industry Revenue (Million), by Country 2025 & 2033
- Figure 21: Europe Rugged Display Industry Revenue Share (%), by Country 2025 & 2033
- Figure 22: Asia Pacific Rugged Display Industry Revenue (Million), by Product Type 2025 & 2033
- Figure 23: Asia Pacific Rugged Display Industry Revenue Share (%), by Product Type 2025 & 2033
- Figure 24: Asia Pacific Rugged Display Industry Revenue (Million), by Level of Ruggedness 2025 & 2033
- Figure 25: Asia Pacific Rugged Display Industry Revenue Share (%), by Level of Ruggedness 2025 & 2033
- Figure 26: Asia Pacific Rugged Display Industry Revenue (Million), by Operating System 2025 & 2033
- Figure 27: Asia Pacific Rugged Display Industry Revenue Share (%), by Operating System 2025 & 2033
- Figure 28: Asia Pacific Rugged Display Industry Revenue (Million), by End User 2025 & 2033
- Figure 29: Asia Pacific Rugged Display Industry Revenue Share (%), by End User 2025 & 2033
- Figure 30: Asia Pacific Rugged Display Industry Revenue (Million), by Country 2025 & 2033
- Figure 31: Asia Pacific Rugged Display Industry Revenue Share (%), by Country 2025 & 2033
- Figure 32: Latin America Rugged Display Industry Revenue (Million), by Product Type 2025 & 2033
- Figure 33: Latin America Rugged Display Industry Revenue Share (%), by Product Type 2025 & 2033
- Figure 34: Latin America Rugged Display Industry Revenue (Million), by Level of Ruggedness 2025 & 2033
- Figure 35: Latin America Rugged Display Industry Revenue Share (%), by Level of Ruggedness 2025 & 2033
- Figure 36: Latin America Rugged Display Industry Revenue (Million), by Operating System 2025 & 2033
- Figure 37: Latin America Rugged Display Industry Revenue Share (%), by Operating System 2025 & 2033
- Figure 38: Latin America Rugged Display Industry Revenue (Million), by End User 2025 & 2033
- Figure 39: Latin America Rugged Display Industry Revenue Share (%), by End User 2025 & 2033
- Figure 40: Latin America Rugged Display Industry Revenue (Million), by Country 2025 & 2033
- Figure 41: Latin America Rugged Display Industry Revenue Share (%), by Country 2025 & 2033
- Figure 42: Middle East and Africa Rugged Display Industry Revenue (Million), by Product Type 2025 & 2033
- Figure 43: Middle East and Africa Rugged Display Industry Revenue Share (%), by Product Type 2025 & 2033
- Figure 44: Middle East and Africa Rugged Display Industry Revenue (Million), by Level of Ruggedness 2025 & 2033
- Figure 45: Middle East and Africa Rugged Display Industry Revenue Share (%), by Level of Ruggedness 2025 & 2033
- Figure 46: Middle East and Africa Rugged Display Industry Revenue (Million), by Operating System 2025 & 2033
- Figure 47: Middle East and Africa Rugged Display Industry Revenue Share (%), by Operating System 2025 & 2033
- Figure 48: Middle East and Africa Rugged Display Industry Revenue (Million), by End User 2025 & 2033
- Figure 49: Middle East and Africa Rugged Display Industry Revenue Share (%), by End User 2025 & 2033
- Figure 50: Middle East and Africa Rugged Display Industry Revenue (Million), by Country 2025 & 2033
- Figure 51: Middle East and Africa Rugged Display Industry Revenue Share (%), by Country 2025 & 2033
List of Tables
- Table 1: Global Rugged Display Industry Revenue Million Forecast, by Product Type 2020 & 2033
- Table 2: Global Rugged Display Industry Revenue Million Forecast, by Level of Ruggedness 2020 & 2033
- Table 3: Global Rugged Display Industry Revenue Million Forecast, by Operating System 2020 & 2033
- Table 4: Global Rugged Display Industry Revenue Million Forecast, by End User 2020 & 2033
- Table 5: Global Rugged Display Industry Revenue Million Forecast, by Region 2020 & 2033
- Table 6: Global Rugged Display Industry Revenue Million Forecast, by Product Type 2020 & 2033
- Table 7: Global Rugged Display Industry Revenue Million Forecast, by Level of Ruggedness 2020 & 2033
- Table 8: Global Rugged Display Industry Revenue Million Forecast, by Operating System 2020 & 2033
- Table 9: Global Rugged Display Industry Revenue Million Forecast, by End User 2020 & 2033
- Table 10: Global Rugged Display Industry Revenue Million Forecast, by Country 2020 & 2033
- Table 11: Global Rugged Display Industry Revenue Million Forecast, by Product Type 2020 & 2033
- Table 12: Global Rugged Display Industry Revenue Million Forecast, by Level of Ruggedness 2020 & 2033
- Table 13: Global Rugged Display Industry Revenue Million Forecast, by Operating System 2020 & 2033
- Table 14: Global Rugged Display Industry Revenue Million Forecast, by End User 2020 & 2033
- Table 15: Global Rugged Display Industry Revenue Million Forecast, by Country 2020 & 2033
- Table 16: Global Rugged Display Industry Revenue Million Forecast, by Product Type 2020 & 2033
- Table 17: Global Rugged Display Industry Revenue Million Forecast, by Level of Ruggedness 2020 & 2033
- Table 18: Global Rugged Display Industry Revenue Million Forecast, by Operating System 2020 & 2033
- Table 19: Global Rugged Display Industry Revenue Million Forecast, by End User 2020 & 2033
- Table 20: Global Rugged Display Industry Revenue Million Forecast, by Country 2020 & 2033
- Table 21: Global Rugged Display Industry Revenue Million Forecast, by Product Type 2020 & 2033
- Table 22: Global Rugged Display Industry Revenue Million Forecast, by Level of Ruggedness 2020 & 2033
- Table 23: Global Rugged Display Industry Revenue Million Forecast, by Operating System 2020 & 2033
- Table 24: Global Rugged Display Industry Revenue Million Forecast, by End User 2020 & 2033
- Table 25: Global Rugged Display Industry Revenue Million Forecast, by Country 2020 & 2033
- Table 26: Global Rugged Display Industry Revenue Million Forecast, by Product Type 2020 & 2033
- Table 27: Global Rugged Display Industry Revenue Million Forecast, by Level of Ruggedness 2020 & 2033
- Table 28: Global Rugged Display Industry Revenue Million Forecast, by Operating System 2020 & 2033
- Table 29: Global Rugged Display Industry Revenue Million Forecast, by End User 2020 & 2033
- Table 30: Global Rugged Display Industry Revenue Million Forecast, by Country 2020 & 2033
Frequently Asked Questions
1. What is the projected Compound Annual Growth Rate (CAGR) of the Rugged Display Industry?
The projected CAGR is approximately 4.43%.
2. Which companies are prominent players in the Rugged Display Industry?
Key companies in the market include L3 Technologies Inc, Kyocera Corp, Sparton Corp, Getac Technology Corp, General Dynamics Corp, Dell Inc, Xplore Technologies Corp, Beijer Electronics AB, Zebra Technologies Corp, Esterline Technologies Corp, Curtiss-Wright Corp, Panasonic Corporation.
3. What are the main segments of the Rugged Display Industry?
The market segments include Product Type, Level of Ruggedness, Operating System, End User.
4. Can you provide details about the market size?
The market size is estimated to be USD 10.39 Million as of 2022.
5. What are some drivers contributing to market growth?
; Reduced Total Cost of Ownership (TCO); Rising Demand for HMI and IoT in Various Industries.
6. What are the notable trends driving market growth?
Rugged Tablets are Expected to Hold Major Share.
7. Are there any restraints impacting market growth?
; Adoption of Consumer-grade Devices for Industrial Applications.
8. Can you provide examples of recent developments in the market?
N/A
9. What pricing options are available for accessing the report?
Pricing options include single-user, multi-user, and enterprise licenses priced at USD 4750, USD 5250, and USD 8750 respectively.
10. Is the market size provided in terms of value or volume?
The market size is provided in terms of value, measured in Million.
11. Are there any specific market keywords associated with the report?
Yes, the market keyword associated with the report is "Rugged Display Industry," which aids in identifying and referencing the specific market segment covered.
12. How do I determine which pricing option suits my needs best?
The pricing options vary based on user requirements and access needs. Individual users may opt for single-user licenses, while businesses requiring broader access may choose multi-user or enterprise licenses for cost-effective access to the report.
13. Are there any additional resources or data provided in the Rugged Display Industry report?
While the report offers comprehensive insights, it's advisable to review the specific contents or supplementary materials provided to ascertain if additional resources or data are available.
14. How can I stay updated on further developments or reports in the Rugged Display Industry?
To stay informed about further developments, trends, and reports in the Rugged Display Industry, consider subscribing to industry newsletters, following relevant companies and organizations, or regularly checking reputable industry news sources and publications.
Methodology
Step 1 - Identification of Relevant Samples Size from Population Database


Step 2 - Approaches for Defining Global Market Size (Value, Volume* & Price*)

Note*: In applicable scenarios
Step 3 - Data Sources
Primary Research
- Web Analytics
- Survey Reports
- Research Institute
- Latest Research Reports
- Opinion Leaders
Secondary Research
- Annual Reports
- White Paper
- Latest Press Release
- Industry Association
- Paid Database
- Investor Presentations

Step 4 - Data Triangulation
Involves using different sources of information in order to increase the validity of a study
These sources are likely to be stakeholders in a program - participants, other researchers, program staff, other community members, and so on.
Then we put all data in single framework & apply various statistical tools to find out the dynamic on the market.
During the analysis stage, feedback from the stakeholder groups would be compared to determine areas of agreement as well as areas of divergence