

Key Insights
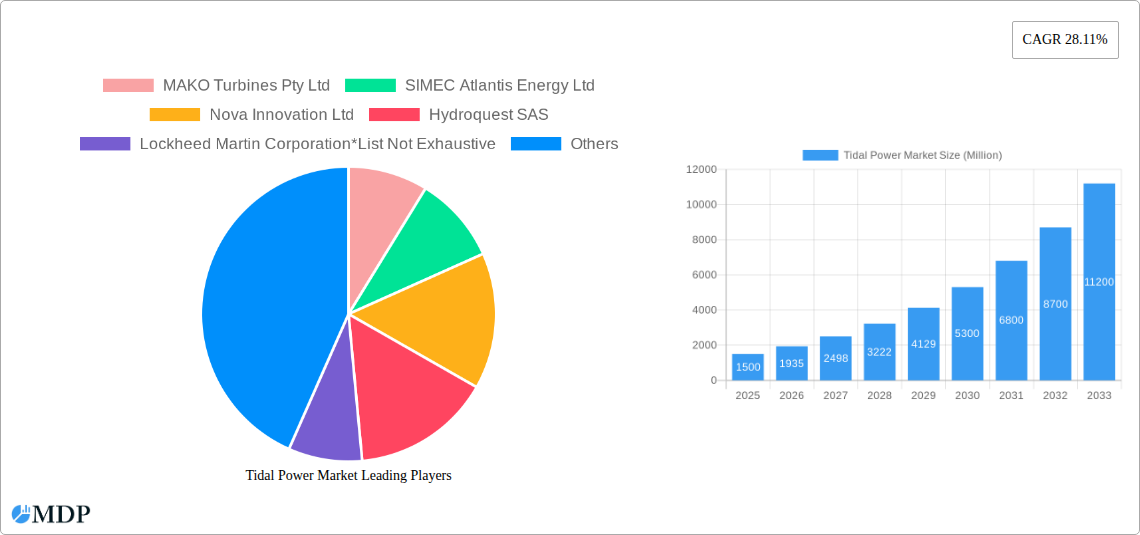
The global tidal power market is experiencing robust growth, driven by increasing concerns about climate change and the need for sustainable energy sources. The market's Compound Annual Growth Rate (CAGR) of 28.11% from 2019 to 2024 indicates significant investor interest and technological advancements in harnessing this renewable energy resource. Several factors contribute to this expansion. Governments worldwide are implementing supportive policies and providing financial incentives to encourage the development and deployment of tidal power projects. Technological improvements in tidal energy converters, particularly horizontal and vertical axis turbines, are leading to increased efficiency and reduced costs. Furthermore, the development of innovative technologies like tidal barrages and floating tidal power platforms is opening up new avenues for harnessing tidal energy in diverse geographical locations. The market is segmented based on power generation methods and converter types, with tidal stream generation currently dominating due to its relatively lower upfront investment costs compared to barrage systems. Key players in the market, including MAKO Turbines Pty Ltd, SIMEC Atlantis Energy Ltd, and Orbital Marine Power Ltd, are actively involved in research and development, driving innovation and competition. While challenges remain, such as high initial capital expenditure and the need for robust infrastructure, the long-term potential of tidal power is significant, promising a reliable and predictable source of clean energy for the future.
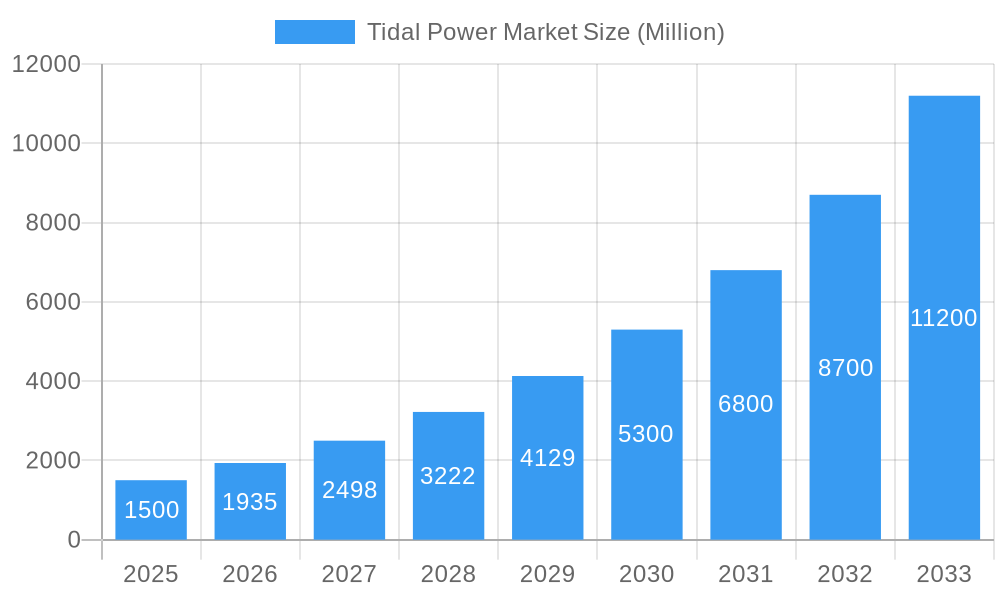
Tidal Power Market Market Size (In Billion)
The regional distribution of the tidal power market reflects the geographical suitability of coastal areas for tidal energy projects. Europe and North America currently hold larger market shares, due to the presence of established research institutions and supportive government policies. However, the Asia-Pacific region is projected to witness substantial growth in the coming years, driven by increasing energy demand and government initiatives to diversify energy sources. The forecast period (2025-2033) suggests continued growth, with the market size expected to significantly increase. This growth will be influenced by ongoing technological advancements, supportive policies, and the increasing urgency to mitigate climate change. The successful commercialization of new technologies and overcoming the challenges of high initial investment costs will be critical determinants of the market's future trajectory.
Tidal Power Market Company Market Share
Tidal Power Market Report: 2019-2033 Forecast
This comprehensive report provides an in-depth analysis of the global tidal power market, covering the period from 2019 to 2033. It offers invaluable insights into market dynamics, industry trends, leading players, and emerging opportunities, equipping stakeholders with the knowledge needed to navigate this rapidly evolving sector. With a focus on key segments like Tidal Barrage, Floating Tidal Power Platforms, and Tidal Stream Generation, and a detailed examination of technologies such as Horizontal Axis and Vertical Axis Turbines, this report is an essential resource for investors, industry professionals, and researchers. The report utilizes data from the base year 2025 and provides detailed forecasts up to 2033. Expected market size values (in Millions) are included where available.
Tidal Power Market Dynamics & Concentration
The global tidal power market is characterized by a moderately concentrated landscape, with several key players vying for market share. While the overall market size is currently valued at xx Million in 2025 and is projected to reach xx Million by 2033, achieving a CAGR of xx%, several factors are influencing this growth. Innovation is a key driver, with ongoing advancements in turbine technology and energy conversion methods boosting efficiency and reducing costs. Stringent environmental regulations are also pushing the adoption of cleaner energy sources, while the fluctuating prices of fossil fuels are creating more attractive economics for tidal energy. Furthermore, the presence of substitute technologies, such as offshore wind, presents a competitive challenge.
- Market Concentration: The Herfindahl-Hirschman Index (HHI) is estimated to be xx, suggesting a moderately concentrated market.
- M&A Activity: The number of mergers and acquisitions (M&A) in the tidal power sector averaged xx deals per year during the historical period (2019-2024). This activity is anticipated to increase during the forecast period, driven by consolidation and expansion strategies.
- Innovation Drivers: Continuous improvement in turbine design, grid integration technologies, and energy storage solutions.
- Regulatory Framework: Varying government policies and incentives influence market growth across different regions.
- End-User Trends: Growing demand for renewable energy from both utilities and industrial consumers.
Tidal Power Market Industry Trends & Analysis
The tidal power market is witnessing significant transformation driven by technological advancements, evolving consumer preferences, and intensifying competitive dynamics. The market exhibits considerable potential for growth, propelled by several key factors. Technological breakthroughs, such as the development of more efficient and durable tidal energy converters, are significantly reducing the cost of energy production. Simultaneously, governments worldwide are actively promoting renewable energy sources through favorable policies and subsidies, creating a supportive environment for tidal power projects.
The increasing awareness of climate change and its consequences is fostering a global shift toward sustainable energy solutions, thereby further boosting the demand for tidal power. However, challenges remain, including the high initial capital investment required for tidal power projects and the complexities associated with site selection and grid integration. Furthermore, the intermittency of tidal energy poses a challenge to consistent power supply. The market penetration rate of tidal energy in global electricity generation is currently low (approximately xx%), but it is expected to increase steadily during the forecast period.
Leading Markets & Segments in Tidal Power Market
While the global market is still developing, several regions and segments are emerging as leaders in the tidal power industry. Europe, particularly the UK and France, holds a significant position due to its advanced technology and supportive regulatory environment.
Leading Segments:
- Tidal Stream Generation: This segment currently dominates the market due to its relatively lower capital cost and technological maturity compared to other segments. Key drivers include advancements in turbine technology and increased investment in research and development.
- Horizontal Axis Turbine: This technology accounts for the largest share of the tidal energy converter market due to its proven efficiency and scalability.
- Floating Tidal Power Platform: This is a rapidly developing segment, with ongoing innovation aimed at reducing costs and improving efficiency in deep-water applications.
Dominant Regions:
- Europe: Strong government support, technological advancements, and favorable geographic conditions make Europe a leading market.
- Asia-Pacific: Significant growth potential is expected, driven by increasing energy demand and supportive government initiatives in countries like Singapore and Indonesia.
Tidal Power Market Product Developments
Recent product developments have focused on enhancing the efficiency, durability, and cost-effectiveness of tidal energy converters. Innovations include advancements in turbine blade design, improved control systems, and the development of more robust and corrosion-resistant materials. These advancements are leading to increased energy capture, reduced maintenance requirements, and enhanced grid integration capabilities. The market is also witnessing the emergence of new types of tidal energy converters with improved performance characteristics and lower manufacturing costs.
Key Drivers of Tidal Power Market Growth
Several factors are driving the growth of the tidal power market. These include:
- Technological Advancements: Improved turbine designs and energy conversion technologies leading to increased efficiency and cost reductions.
- Government Policies & Incentives: Many governments are implementing policies to support renewable energy, including financial incentives and streamlined permitting processes.
- Environmental Concerns: The urgent need to reduce greenhouse gas emissions is driving the adoption of cleaner energy sources.
- Economic Factors: The fluctuating prices of fossil fuels are making tidal energy a more economically viable option.
Challenges in the Tidal Power Market
Despite its potential, the tidal power market faces several challenges:
- High Capital Costs: The initial investment required for tidal power projects remains high, hindering wider adoption.
- Environmental Impacts: Concerns about the potential impact on marine ecosystems and habitats require careful assessment and mitigation strategies.
- Grid Integration: Connecting tidal power plants to the electricity grid can be complex and expensive.
- Technological Maturity: While advancements are ongoing, the technology is still relatively immature compared to other renewable energy sources.
Emerging Opportunities in Tidal Power Market
The tidal power market presents several promising opportunities for growth. Ongoing research and development into more efficient energy converters, coupled with advancements in energy storage technologies, are creating a favorable environment for expansion. Strategic partnerships between technology developers, energy companies, and governments are fostering innovation and investment. Furthermore, the exploration of new sites with high tidal energy potential is opening up new markets.
Leading Players in the Tidal Power Market Sector
- MAKO Turbines Pty Ltd
- SIMEC Atlantis Energy Ltd
- Nova Innovation Ltd
- Hydroquest SAS
- Lockheed Martin Corporation
- Orbital Marine Power Ltd
- Sustainable Marine Energy Ltd
- Andritz AG
Key Milestones in Tidal Power Market Industry
- March 2023: A tidal-energy demonstration project, outside the grid in Singapore, began generating power for the first time in Southeast Asia. NYK participated, driven by Bluenergy Solutions. This signifies a step towards commercialization of tidal energy in the region.
- March 2023: Walton Marina assisted BigMoon Power with its tidal energy project in Minas Basin, facilitating the launch of anchors for floating machinery. This showcases collaboration between the energy sector and marine infrastructure providers.
- September 2022: Sabella (France) partnered with PT PLN (Persero) and PT Meindo Elang Indah (Indonesia) to conduct a feasibility study for the world's first tidal energy farm in Indonesia. This collaboration highlights the global interest in developing large-scale tidal energy projects.
Strategic Outlook for Tidal Power Market
The future of the tidal power market is promising, with significant growth potential driven by technological advancements, supportive government policies, and the increasing urgency to combat climate change. Strategic partnerships, research and development initiatives, and the exploration of new markets will be essential for maximizing the potential of this renewable energy source. The market's continued development hinges on addressing challenges related to cost reduction, grid integration, and environmental impact assessment. With proactive measures in these areas, the tidal power market is poised for substantial expansion in the coming years.
Tidal Power Market Segmentation
-
1. Power Generation Method
- 1.1. Tidal Barrage
- 1.2. Floating Tidal Power Platform
- 1.3. Tidal Stream Generation
- 1.4. Dynamic Tidal Power
-
2. Tidal Energy Converters
- 2.1. Horizontal Axis Turbine
- 2.2. Vertical Axis Turbine
- 2.3. Other Tidal Energy Converters
Tidal Power Market Segmentation By Geography
-
1. North America
- 1.1. United States
- 1.2. Canada
- 1.3. Rest of North America
-
2. Europe
- 2.1. United Kingdom
- 2.2. Denmark
- 2.3. France
- 2.4. Rest of the Europe
-
3. Asia Pacific
- 3.1. China
- 3.2. India
- 3.3. Japan
- 3.4. Rest of the Asia Pacific
-
4. South America
- 4.1. Brazil
- 4.2. Argentina
- 4.3. Rest of South America
-
5. Middle East and Africa
- 5.1. United Arab Emirates
- 5.2. South Africa
- 5.3. Saudi Arabia
- 5.4. Rest of Middle East and Africa
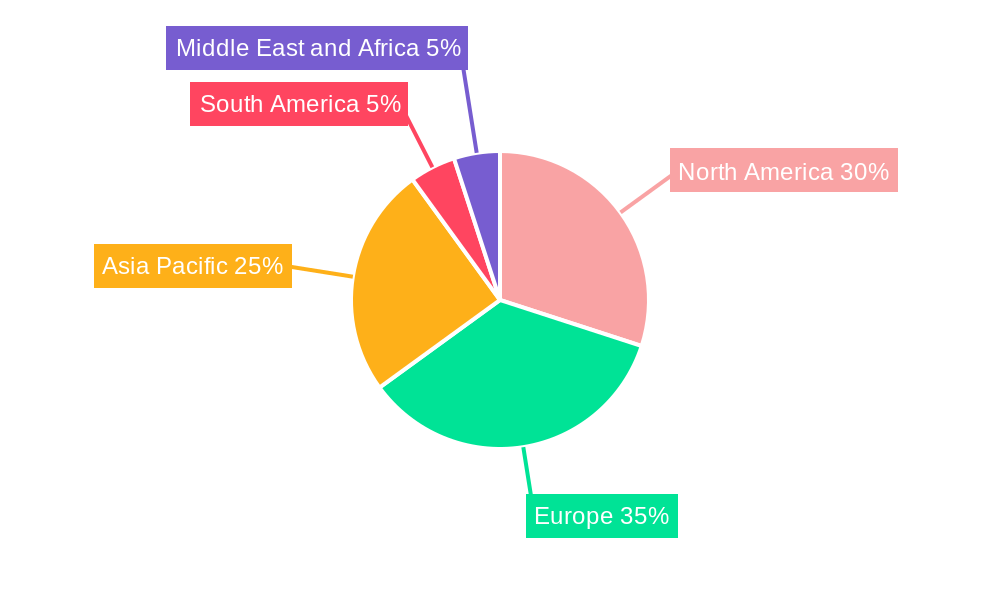
Tidal Power Market Regional Market Share
Geographic Coverage of Tidal Power Market
Tidal Power Market REPORT HIGHLIGHTS
| Aspects | Details |
|---|---|
| Study Period | 2020-2034 |
| Base Year | 2025 |
| Estimated Year | 2026 |
| Forecast Period | 2026-2034 |
| Historical Period | 2020-2025 |
| Growth Rate | CAGR of 28.6% from 2020-2034 |
| Segmentation |
|
Table of Contents
- 1. Introduction
- 1.1. Research Scope
- 1.2. Market Segmentation
- 1.3. Research Objective
- 1.4. Definitions and Assumptions
- 2. Executive Summary
- 2.1. Market Snapshot
- 3. Market Dynamics
- 3.1. Market Drivers
- 3.2. Market Restrains
- 3.3. Market Trends
- 3.4. Market Opportunities
- 4. Market Factor Analysis
- 4.1. Porters Five Forces
- 4.1.1. Bargaining Power of Suppliers
- 4.1.2. Bargaining Power of Buyers
- 4.1.3. Threat of New Entrants
- 4.1.4. Threat of Substitutes
- 4.1.5. Competitive Rivalry
- 4.2. PESTEL analysis
- 4.3. BCG Analysis
- 4.3.1. Stars (High Growth, High Market Share)
- 4.3.2. Cash Cows (Low Growth, High Market Share)
- 4.3.3. Question Mark (High Growth, Low Market Share)
- 4.3.4. Dogs (Low Growth, Low Market Share)
- 4.4. Ansoff Matrix Analysis
- 4.5. Supply Chain Analysis
- 4.6. Regulatory Landscape
- 4.7. Current Market Potential and Opportunity Assessment (TAM–SAM–SOM Framework)
- 4.8. MDP Analyst Note
- 4.1. Porters Five Forces
- 5. Market Analysis, Insights and Forecast 2021-2033
- 5.1. Market Analysis, Insights and Forecast - by Power Generation Method
- 5.1.1. Tidal Barrage
- 5.1.2. Floating Tidal Power Platform
- 5.1.3. Tidal Stream Generation
- 5.1.4. Dynamic Tidal Power
- 5.2. Market Analysis, Insights and Forecast - by Tidal Energy Converters
- 5.2.1. Horizontal Axis Turbine
- 5.2.2. Vertical Axis Turbine
- 5.2.3. Other Tidal Energy Converters
- 5.3. Market Analysis, Insights and Forecast - by Region
- 5.3.1. North America
- 5.3.2. Europe
- 5.3.3. Asia Pacific
- 5.3.4. South America
- 5.3.5. Middle East and Africa
- 5.1. Market Analysis, Insights and Forecast - by Power Generation Method
- 6. Global Tidal Power Market Analysis, Insights and Forecast, 2021-2033
- 6.1. Market Analysis, Insights and Forecast - by Power Generation Method
- 6.1.1. Tidal Barrage
- 6.1.2. Floating Tidal Power Platform
- 6.1.3. Tidal Stream Generation
- 6.1.4. Dynamic Tidal Power
- 6.2. Market Analysis, Insights and Forecast - by Tidal Energy Converters
- 6.2.1. Horizontal Axis Turbine
- 6.2.2. Vertical Axis Turbine
- 6.2.3. Other Tidal Energy Converters
- 6.1. Market Analysis, Insights and Forecast - by Power Generation Method
- 7. North America Tidal Power Market Analysis, Insights and Forecast, 2020-2032
- 7.1. Market Analysis, Insights and Forecast - by Power Generation Method
- 7.1.1. Tidal Barrage
- 7.1.2. Floating Tidal Power Platform
- 7.1.3. Tidal Stream Generation
- 7.1.4. Dynamic Tidal Power
- 7.2. Market Analysis, Insights and Forecast - by Tidal Energy Converters
- 7.2.1. Horizontal Axis Turbine
- 7.2.2. Vertical Axis Turbine
- 7.2.3. Other Tidal Energy Converters
- 7.1. Market Analysis, Insights and Forecast - by Power Generation Method
- 8. Europe Tidal Power Market Analysis, Insights and Forecast, 2020-2032
- 8.1. Market Analysis, Insights and Forecast - by Power Generation Method
- 8.1.1. Tidal Barrage
- 8.1.2. Floating Tidal Power Platform
- 8.1.3. Tidal Stream Generation
- 8.1.4. Dynamic Tidal Power
- 8.2. Market Analysis, Insights and Forecast - by Tidal Energy Converters
- 8.2.1. Horizontal Axis Turbine
- 8.2.2. Vertical Axis Turbine
- 8.2.3. Other Tidal Energy Converters
- 8.1. Market Analysis, Insights and Forecast - by Power Generation Method
- 9. Asia Pacific Tidal Power Market Analysis, Insights and Forecast, 2020-2032
- 9.1. Market Analysis, Insights and Forecast - by Power Generation Method
- 9.1.1. Tidal Barrage
- 9.1.2. Floating Tidal Power Platform
- 9.1.3. Tidal Stream Generation
- 9.1.4. Dynamic Tidal Power
- 9.2. Market Analysis, Insights and Forecast - by Tidal Energy Converters
- 9.2.1. Horizontal Axis Turbine
- 9.2.2. Vertical Axis Turbine
- 9.2.3. Other Tidal Energy Converters
- 9.1. Market Analysis, Insights and Forecast - by Power Generation Method
- 10. South America Tidal Power Market Analysis, Insights and Forecast, 2020-2032
- 10.1. Market Analysis, Insights and Forecast - by Power Generation Method
- 10.1.1. Tidal Barrage
- 10.1.2. Floating Tidal Power Platform
- 10.1.3. Tidal Stream Generation
- 10.1.4. Dynamic Tidal Power
- 10.2. Market Analysis, Insights and Forecast - by Tidal Energy Converters
- 10.2.1. Horizontal Axis Turbine
- 10.2.2. Vertical Axis Turbine
- 10.2.3. Other Tidal Energy Converters
- 10.1. Market Analysis, Insights and Forecast - by Power Generation Method
- 11. Middle East and Africa Tidal Power Market Analysis, Insights and Forecast, 2020-2032
- 11.1. Market Analysis, Insights and Forecast - by Power Generation Method
- 11.1.1. Tidal Barrage
- 11.1.2. Floating Tidal Power Platform
- 11.1.3. Tidal Stream Generation
- 11.1.4. Dynamic Tidal Power
- 11.2. Market Analysis, Insights and Forecast - by Tidal Energy Converters
- 11.2.1. Horizontal Axis Turbine
- 11.2.2. Vertical Axis Turbine
- 11.2.3. Other Tidal Energy Converters
- 11.1. Market Analysis, Insights and Forecast - by Power Generation Method
- 12. Competitive Analysis
- 12.1. Company Profiles
- 12.1.1 MAKO Turbines Pty Ltd
- 12.1.1.1. Company Overview
- 12.1.1.2. Products
- 12.1.1.3. Company Financials
- 12.1.1.4. SWOT Analysis
- 12.1.2 SIMEC Atlantis Energy Ltd
- 12.1.2.1. Company Overview
- 12.1.2.2. Products
- 12.1.2.3. Company Financials
- 12.1.2.4. SWOT Analysis
- 12.1.3 Nova Innovation Ltd
- 12.1.3.1. Company Overview
- 12.1.3.2. Products
- 12.1.3.3. Company Financials
- 12.1.3.4. SWOT Analysis
- 12.1.4 Hydroquest SAS
- 12.1.4.1. Company Overview
- 12.1.4.2. Products
- 12.1.4.3. Company Financials
- 12.1.4.4. SWOT Analysis
- 12.1.5 Lockheed Martin Corporation*List Not Exhaustive
- 12.1.5.1. Company Overview
- 12.1.5.2. Products
- 12.1.5.3. Company Financials
- 12.1.5.4. SWOT Analysis
- 12.1.6 Orbital Marine Power Ltd
- 12.1.6.1. Company Overview
- 12.1.6.2. Products
- 12.1.6.3. Company Financials
- 12.1.6.4. SWOT Analysis
- 12.1.7 Sustainable Marine Energy Ltd
- 12.1.7.1. Company Overview
- 12.1.7.2. Products
- 12.1.7.3. Company Financials
- 12.1.7.4. SWOT Analysis
- 12.1.8 Andritz AG
- 12.1.8.1. Company Overview
- 12.1.8.2. Products
- 12.1.8.3. Company Financials
- 12.1.8.4. SWOT Analysis
- 12.1.1 MAKO Turbines Pty Ltd
- 12.2. Market Entropy
- 12.2.1 Company's Key Areas Served
- 12.2.2 Recent Developments
- 12.3. Company Market Share Analysis 2025
- 12.3.1 Top 5 Companies Market Share Analysis
- 12.3.2 Top 3 Companies Market Share Analysis
- 12.4. List of Potential Customers
- 13. Research Methodology
List of Figures
- Figure 1: Global Tidal Power Market Revenue Breakdown (billion, %) by Region 2025 & 2033
- Figure 2: Global Tidal Power Market Volume Breakdown (gigawatt, %) by Region 2025 & 2033
- Figure 3: North America Tidal Power Market Revenue (billion), by Power Generation Method 2025 & 2033
- Figure 4: North America Tidal Power Market Volume (gigawatt), by Power Generation Method 2025 & 2033
- Figure 5: North America Tidal Power Market Revenue Share (%), by Power Generation Method 2025 & 2033
- Figure 6: North America Tidal Power Market Volume Share (%), by Power Generation Method 2025 & 2033
- Figure 7: North America Tidal Power Market Revenue (billion), by Tidal Energy Converters 2025 & 2033
- Figure 8: North America Tidal Power Market Volume (gigawatt), by Tidal Energy Converters 2025 & 2033
- Figure 9: North America Tidal Power Market Revenue Share (%), by Tidal Energy Converters 2025 & 2033
- Figure 10: North America Tidal Power Market Volume Share (%), by Tidal Energy Converters 2025 & 2033
- Figure 11: North America Tidal Power Market Revenue (billion), by Country 2025 & 2033
- Figure 12: North America Tidal Power Market Volume (gigawatt), by Country 2025 & 2033
- Figure 13: North America Tidal Power Market Revenue Share (%), by Country 2025 & 2033
- Figure 14: North America Tidal Power Market Volume Share (%), by Country 2025 & 2033
- Figure 15: Europe Tidal Power Market Revenue (billion), by Power Generation Method 2025 & 2033
- Figure 16: Europe Tidal Power Market Volume (gigawatt), by Power Generation Method 2025 & 2033
- Figure 17: Europe Tidal Power Market Revenue Share (%), by Power Generation Method 2025 & 2033
- Figure 18: Europe Tidal Power Market Volume Share (%), by Power Generation Method 2025 & 2033
- Figure 19: Europe Tidal Power Market Revenue (billion), by Tidal Energy Converters 2025 & 2033
- Figure 20: Europe Tidal Power Market Volume (gigawatt), by Tidal Energy Converters 2025 & 2033
- Figure 21: Europe Tidal Power Market Revenue Share (%), by Tidal Energy Converters 2025 & 2033
- Figure 22: Europe Tidal Power Market Volume Share (%), by Tidal Energy Converters 2025 & 2033
- Figure 23: Europe Tidal Power Market Revenue (billion), by Country 2025 & 2033
- Figure 24: Europe Tidal Power Market Volume (gigawatt), by Country 2025 & 2033
- Figure 25: Europe Tidal Power Market Revenue Share (%), by Country 2025 & 2033
- Figure 26: Europe Tidal Power Market Volume Share (%), by Country 2025 & 2033
- Figure 27: Asia Pacific Tidal Power Market Revenue (billion), by Power Generation Method 2025 & 2033
- Figure 28: Asia Pacific Tidal Power Market Volume (gigawatt), by Power Generation Method 2025 & 2033
- Figure 29: Asia Pacific Tidal Power Market Revenue Share (%), by Power Generation Method 2025 & 2033
- Figure 30: Asia Pacific Tidal Power Market Volume Share (%), by Power Generation Method 2025 & 2033
- Figure 31: Asia Pacific Tidal Power Market Revenue (billion), by Tidal Energy Converters 2025 & 2033
- Figure 32: Asia Pacific Tidal Power Market Volume (gigawatt), by Tidal Energy Converters 2025 & 2033
- Figure 33: Asia Pacific Tidal Power Market Revenue Share (%), by Tidal Energy Converters 2025 & 2033
- Figure 34: Asia Pacific Tidal Power Market Volume Share (%), by Tidal Energy Converters 2025 & 2033
- Figure 35: Asia Pacific Tidal Power Market Revenue (billion), by Country 2025 & 2033
- Figure 36: Asia Pacific Tidal Power Market Volume (gigawatt), by Country 2025 & 2033
- Figure 37: Asia Pacific Tidal Power Market Revenue Share (%), by Country 2025 & 2033
- Figure 38: Asia Pacific Tidal Power Market Volume Share (%), by Country 2025 & 2033
- Figure 39: South America Tidal Power Market Revenue (billion), by Power Generation Method 2025 & 2033
- Figure 40: South America Tidal Power Market Volume (gigawatt), by Power Generation Method 2025 & 2033
- Figure 41: South America Tidal Power Market Revenue Share (%), by Power Generation Method 2025 & 2033
- Figure 42: South America Tidal Power Market Volume Share (%), by Power Generation Method 2025 & 2033
- Figure 43: South America Tidal Power Market Revenue (billion), by Tidal Energy Converters 2025 & 2033
- Figure 44: South America Tidal Power Market Volume (gigawatt), by Tidal Energy Converters 2025 & 2033
- Figure 45: South America Tidal Power Market Revenue Share (%), by Tidal Energy Converters 2025 & 2033
- Figure 46: South America Tidal Power Market Volume Share (%), by Tidal Energy Converters 2025 & 2033
- Figure 47: South America Tidal Power Market Revenue (billion), by Country 2025 & 2033
- Figure 48: South America Tidal Power Market Volume (gigawatt), by Country 2025 & 2033
- Figure 49: South America Tidal Power Market Revenue Share (%), by Country 2025 & 2033
- Figure 50: South America Tidal Power Market Volume Share (%), by Country 2025 & 2033
- Figure 51: Middle East and Africa Tidal Power Market Revenue (billion), by Power Generation Method 2025 & 2033
- Figure 52: Middle East and Africa Tidal Power Market Volume (gigawatt), by Power Generation Method 2025 & 2033
- Figure 53: Middle East and Africa Tidal Power Market Revenue Share (%), by Power Generation Method 2025 & 2033
- Figure 54: Middle East and Africa Tidal Power Market Volume Share (%), by Power Generation Method 2025 & 2033
- Figure 55: Middle East and Africa Tidal Power Market Revenue (billion), by Tidal Energy Converters 2025 & 2033
- Figure 56: Middle East and Africa Tidal Power Market Volume (gigawatt), by Tidal Energy Converters 2025 & 2033
- Figure 57: Middle East and Africa Tidal Power Market Revenue Share (%), by Tidal Energy Converters 2025 & 2033
- Figure 58: Middle East and Africa Tidal Power Market Volume Share (%), by Tidal Energy Converters 2025 & 2033
- Figure 59: Middle East and Africa Tidal Power Market Revenue (billion), by Country 2025 & 2033
- Figure 60: Middle East and Africa Tidal Power Market Volume (gigawatt), by Country 2025 & 2033
- Figure 61: Middle East and Africa Tidal Power Market Revenue Share (%), by Country 2025 & 2033
- Figure 62: Middle East and Africa Tidal Power Market Volume Share (%), by Country 2025 & 2033
List of Tables
- Table 1: Global Tidal Power Market Revenue billion Forecast, by Power Generation Method 2020 & 2033
- Table 2: Global Tidal Power Market Volume gigawatt Forecast, by Power Generation Method 2020 & 2033
- Table 3: Global Tidal Power Market Revenue billion Forecast, by Tidal Energy Converters 2020 & 2033
- Table 4: Global Tidal Power Market Volume gigawatt Forecast, by Tidal Energy Converters 2020 & 2033
- Table 5: Global Tidal Power Market Revenue billion Forecast, by Region 2020 & 2033
- Table 6: Global Tidal Power Market Volume gigawatt Forecast, by Region 2020 & 2033
- Table 7: Global Tidal Power Market Revenue billion Forecast, by Power Generation Method 2020 & 2033
- Table 8: Global Tidal Power Market Volume gigawatt Forecast, by Power Generation Method 2020 & 2033
- Table 9: Global Tidal Power Market Revenue billion Forecast, by Tidal Energy Converters 2020 & 2033
- Table 10: Global Tidal Power Market Volume gigawatt Forecast, by Tidal Energy Converters 2020 & 2033
- Table 11: Global Tidal Power Market Revenue billion Forecast, by Country 2020 & 2033
- Table 12: Global Tidal Power Market Volume gigawatt Forecast, by Country 2020 & 2033
- Table 13: United States Tidal Power Market Revenue (billion) Forecast, by Application 2020 & 2033
- Table 14: United States Tidal Power Market Volume (gigawatt) Forecast, by Application 2020 & 2033
- Table 15: Canada Tidal Power Market Revenue (billion) Forecast, by Application 2020 & 2033
- Table 16: Canada Tidal Power Market Volume (gigawatt) Forecast, by Application 2020 & 2033
- Table 17: Rest of North America Tidal Power Market Revenue (billion) Forecast, by Application 2020 & 2033
- Table 18: Rest of North America Tidal Power Market Volume (gigawatt) Forecast, by Application 2020 & 2033
- Table 19: Global Tidal Power Market Revenue billion Forecast, by Power Generation Method 2020 & 2033
- Table 20: Global Tidal Power Market Volume gigawatt Forecast, by Power Generation Method 2020 & 2033
- Table 21: Global Tidal Power Market Revenue billion Forecast, by Tidal Energy Converters 2020 & 2033
- Table 22: Global Tidal Power Market Volume gigawatt Forecast, by Tidal Energy Converters 2020 & 2033
- Table 23: Global Tidal Power Market Revenue billion Forecast, by Country 2020 & 2033
- Table 24: Global Tidal Power Market Volume gigawatt Forecast, by Country 2020 & 2033
- Table 25: United Kingdom Tidal Power Market Revenue (billion) Forecast, by Application 2020 & 2033
- Table 26: United Kingdom Tidal Power Market Volume (gigawatt) Forecast, by Application 2020 & 2033
- Table 27: Denmark Tidal Power Market Revenue (billion) Forecast, by Application 2020 & 2033
- Table 28: Denmark Tidal Power Market Volume (gigawatt) Forecast, by Application 2020 & 2033
- Table 29: France Tidal Power Market Revenue (billion) Forecast, by Application 2020 & 2033
- Table 30: France Tidal Power Market Volume (gigawatt) Forecast, by Application 2020 & 2033
- Table 31: Rest of the Europe Tidal Power Market Revenue (billion) Forecast, by Application 2020 & 2033
- Table 32: Rest of the Europe Tidal Power Market Volume (gigawatt) Forecast, by Application 2020 & 2033
- Table 33: Global Tidal Power Market Revenue billion Forecast, by Power Generation Method 2020 & 2033
- Table 34: Global Tidal Power Market Volume gigawatt Forecast, by Power Generation Method 2020 & 2033
- Table 35: Global Tidal Power Market Revenue billion Forecast, by Tidal Energy Converters 2020 & 2033
- Table 36: Global Tidal Power Market Volume gigawatt Forecast, by Tidal Energy Converters 2020 & 2033
- Table 37: Global Tidal Power Market Revenue billion Forecast, by Country 2020 & 2033
- Table 38: Global Tidal Power Market Volume gigawatt Forecast, by Country 2020 & 2033
- Table 39: China Tidal Power Market Revenue (billion) Forecast, by Application 2020 & 2033
- Table 40: China Tidal Power Market Volume (gigawatt) Forecast, by Application 2020 & 2033
- Table 41: India Tidal Power Market Revenue (billion) Forecast, by Application 2020 & 2033
- Table 42: India Tidal Power Market Volume (gigawatt) Forecast, by Application 2020 & 2033
- Table 43: Japan Tidal Power Market Revenue (billion) Forecast, by Application 2020 & 2033
- Table 44: Japan Tidal Power Market Volume (gigawatt) Forecast, by Application 2020 & 2033
- Table 45: Rest of the Asia Pacific Tidal Power Market Revenue (billion) Forecast, by Application 2020 & 2033
- Table 46: Rest of the Asia Pacific Tidal Power Market Volume (gigawatt) Forecast, by Application 2020 & 2033
- Table 47: Global Tidal Power Market Revenue billion Forecast, by Power Generation Method 2020 & 2033
- Table 48: Global Tidal Power Market Volume gigawatt Forecast, by Power Generation Method 2020 & 2033
- Table 49: Global Tidal Power Market Revenue billion Forecast, by Tidal Energy Converters 2020 & 2033
- Table 50: Global Tidal Power Market Volume gigawatt Forecast, by Tidal Energy Converters 2020 & 2033
- Table 51: Global Tidal Power Market Revenue billion Forecast, by Country 2020 & 2033
- Table 52: Global Tidal Power Market Volume gigawatt Forecast, by Country 2020 & 2033
- Table 53: Brazil Tidal Power Market Revenue (billion) Forecast, by Application 2020 & 2033
- Table 54: Brazil Tidal Power Market Volume (gigawatt) Forecast, by Application 2020 & 2033
- Table 55: Argentina Tidal Power Market Revenue (billion) Forecast, by Application 2020 & 2033
- Table 56: Argentina Tidal Power Market Volume (gigawatt) Forecast, by Application 2020 & 2033
- Table 57: Rest of South America Tidal Power Market Revenue (billion) Forecast, by Application 2020 & 2033
- Table 58: Rest of South America Tidal Power Market Volume (gigawatt) Forecast, by Application 2020 & 2033
- Table 59: Global Tidal Power Market Revenue billion Forecast, by Power Generation Method 2020 & 2033
- Table 60: Global Tidal Power Market Volume gigawatt Forecast, by Power Generation Method 2020 & 2033
- Table 61: Global Tidal Power Market Revenue billion Forecast, by Tidal Energy Converters 2020 & 2033
- Table 62: Global Tidal Power Market Volume gigawatt Forecast, by Tidal Energy Converters 2020 & 2033
- Table 63: Global Tidal Power Market Revenue billion Forecast, by Country 2020 & 2033
- Table 64: Global Tidal Power Market Volume gigawatt Forecast, by Country 2020 & 2033
- Table 65: United Arab Emirates Tidal Power Market Revenue (billion) Forecast, by Application 2020 & 2033
- Table 66: United Arab Emirates Tidal Power Market Volume (gigawatt) Forecast, by Application 2020 & 2033
- Table 67: South Africa Tidal Power Market Revenue (billion) Forecast, by Application 2020 & 2033
- Table 68: South Africa Tidal Power Market Volume (gigawatt) Forecast, by Application 2020 & 2033
- Table 69: Saudi Arabia Tidal Power Market Revenue (billion) Forecast, by Application 2020 & 2033
- Table 70: Saudi Arabia Tidal Power Market Volume (gigawatt) Forecast, by Application 2020 & 2033
- Table 71: Rest of Middle East and Africa Tidal Power Market Revenue (billion) Forecast, by Application 2020 & 2033
- Table 72: Rest of Middle East and Africa Tidal Power Market Volume (gigawatt) Forecast, by Application 2020 & 2033
Frequently Asked Questions
1. What is the projected Compound Annual Growth Rate (CAGR) of the Tidal Power Market?
The projected CAGR is approximately 28.6%.
2. Which companies are prominent players in the Tidal Power Market?
Key companies in the market include MAKO Turbines Pty Ltd, SIMEC Atlantis Energy Ltd, Nova Innovation Ltd, Hydroquest SAS, Lockheed Martin Corporation*List Not Exhaustive, Orbital Marine Power Ltd, Sustainable Marine Energy Ltd, Andritz AG.
3. What are the main segments of the Tidal Power Market?
The market segments include Power Generation Method, Tidal Energy Converters.
4. Can you provide details about the market size?
The market size is estimated to be USD 1.35 billion as of 2022.
5. What are some drivers contributing to market growth?
4.; Global Energy Transition Toward Renewables4.; The Rollout of New Technologies in Many Developed Countries.
6. What are the notable trends driving market growth?
Floating Tidal Power Platform Expected to Witness Significant Growth.
7. Are there any restraints impacting market growth?
4.; The Technology's Exorbitant Costs and Environmental Impacts.
8. Can you provide examples of recent developments in the market?
March 2023, for the first time in Southeast Asia, a tidal-energy demonstration outside the grid in Singapore began generating power. NYK participated in this demonstration project, which is being run by Bluenergy Solutions, a marine renewable energy solutions developer, off Raffles Lighthouse on Satumu Island, some 14 kilometers off Singapore's main island. The project's goal is to commercialize tidal energy generation and supply.
9. What pricing options are available for accessing the report?
Pricing options include single-user, multi-user, and enterprise licenses priced at USD 4750, USD 5250, and USD 8750 respectively.
10. Is the market size provided in terms of value or volume?
The market size is provided in terms of value, measured in billion and volume, measured in gigawatt.
11. Are there any specific market keywords associated with the report?
Yes, the market keyword associated with the report is "Tidal Power Market," which aids in identifying and referencing the specific market segment covered.
12. How do I determine which pricing option suits my needs best?
The pricing options vary based on user requirements and access needs. Individual users may opt for single-user licenses, while businesses requiring broader access may choose multi-user or enterprise licenses for cost-effective access to the report.
13. Are there any additional resources or data provided in the Tidal Power Market report?
While the report offers comprehensive insights, it's advisable to review the specific contents or supplementary materials provided to ascertain if additional resources or data are available.
14. How can I stay updated on further developments or reports in the Tidal Power Market?
To stay informed about further developments, trends, and reports in the Tidal Power Market, consider subscribing to industry newsletters, following relevant companies and organizations, or regularly checking reputable industry news sources and publications.
Methodology
Step 1 - Identification of Relevant Samples Size from Population Database


Step 2 - Approaches for Defining Global Market Size (Value, Volume* & Price*)

Note*: In applicable scenarios
Step 3 - Data Sources
Primary Research
- Web Analytics
- Survey Reports
- Research Institute
- Latest Research Reports
- Opinion Leaders
Secondary Research
- Annual Reports
- White Paper
- Latest Press Release
- Industry Association
- Paid Database
- Investor Presentations

Step 4 - Data Triangulation
Involves using different sources of information in order to increase the validity of a study
These sources are likely to be stakeholders in a program - participants, other researchers, program staff, other community members, and so on.
Then we put all data in single framework & apply various statistical tools to find out the dynamic on the market.
During the analysis stage, feedback from the stakeholder groups would be compared to determine areas of agreement as well as areas of divergence