

Key Insights
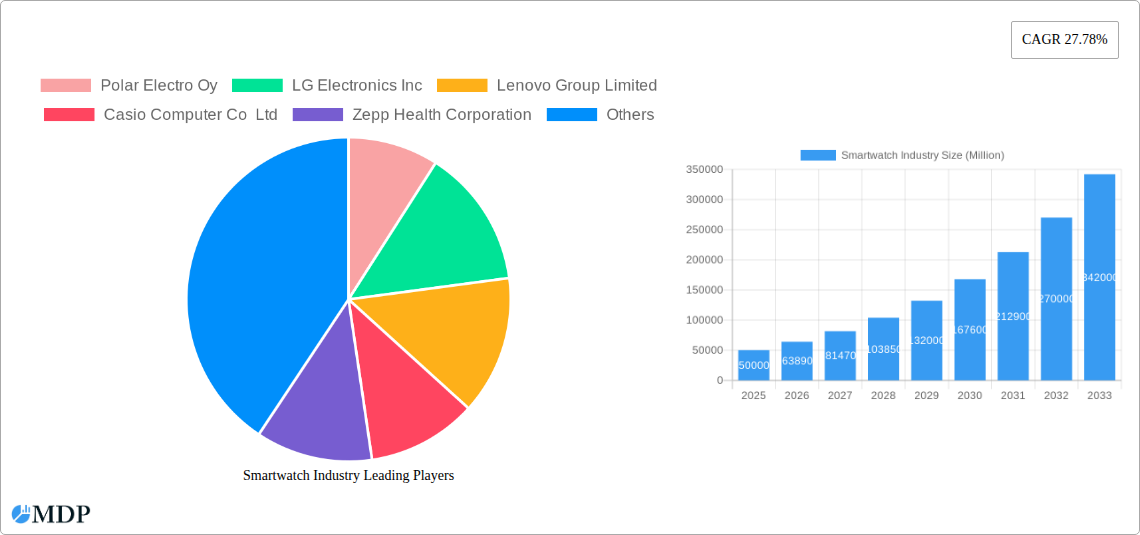
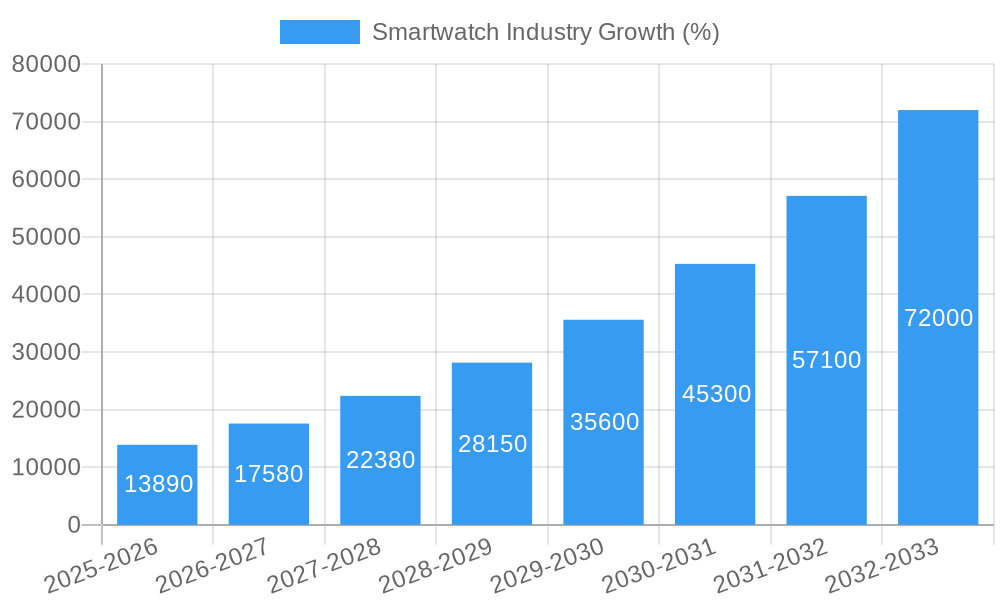
The global smartwatch market is experiencing robust growth, driven by increasing consumer demand for wearable technology and the integration of advanced health and fitness tracking features. A compound annual growth rate (CAGR) of 27.78% from 2019 to 2033 signals a significant expansion, particularly within the health and wellness sector. This growth is fueled by several key trends: the increasing adoption of sophisticated health monitoring capabilities (heart rate, sleep tracking, ECG), the rise of smartwatch integration with health apps and ecosystems, and the growing availability of stylish and feature-rich models at various price points. The market is segmented by operating system (WatchOS, Wear OS, others), display type (AMOLED, PMOLED, TFT LCD), and application (personal assistance, medical, sports, and others). Leading players like Apple, Samsung, Garmin, and Fitbit continue to dominate market share, investing heavily in research and development to improve functionalities and integrate advanced sensors. However, challenges exist, including concerns over battery life, data privacy, and the potential for health misinformation.
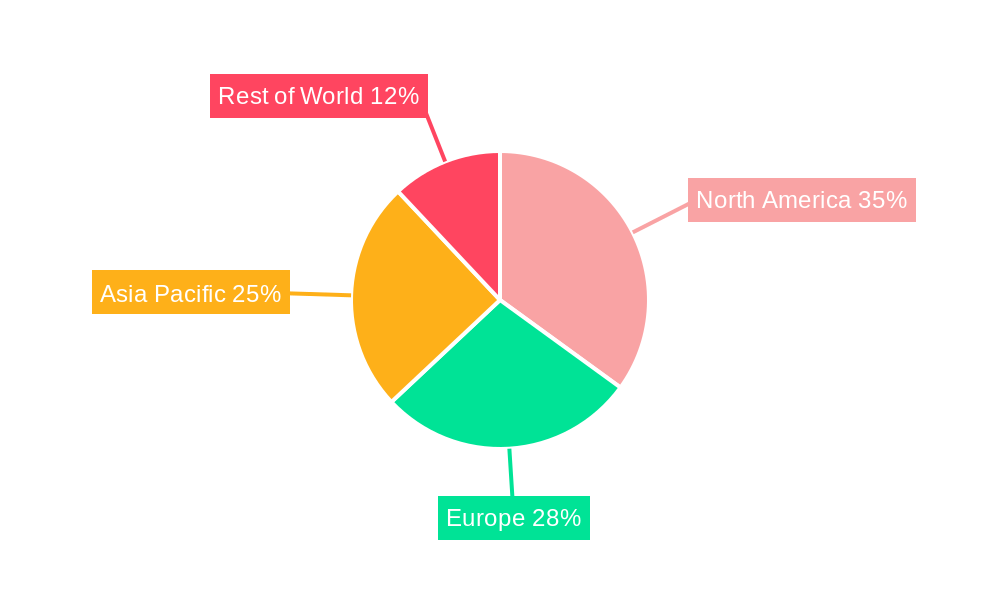
The market segmentation reveals valuable insights into consumer preferences. AMOLED displays are likely to maintain a dominant market share due to their superior visual quality and power efficiency, while the personal assistance and fitness applications are driving the highest adoption rates. Geographically, North America and Europe are currently leading the market, but Asia Pacific is projected to witness significant growth due to rising disposable incomes and increasing smartphone penetration in emerging markets. The competitive landscape, characterized by technological advancements and strategic partnerships, will intensify in the coming years, requiring companies to constantly innovate and adapt to meet evolving consumer needs and preferences. The projected market size for 2025, extrapolated from the provided CAGR and considering market dynamics, suggests a substantial value, potentially exceeding several billion dollars. The continued integration of advanced technologies, including 5G connectivity and improved AI-powered health analytics, will further propel the market forward.
Smartwatch Industry Market Report: 2019-2033 Forecast
This comprehensive report provides an in-depth analysis of the global smartwatch market, encompassing market dynamics, industry trends, leading players, and future growth prospects. With a study period spanning 2019-2033, a base year of 2025, and a forecast period of 2025-2033, this report is an indispensable resource for industry stakeholders, investors, and strategists seeking to navigate the dynamic smartwatch landscape. The report projects a market valued at xx Million by 2033, with a CAGR of xx% during the forecast period.
Smartwatch Industry Market Dynamics & Concentration
The global smartwatch market exhibits a moderately concentrated structure, with key players like Apple, Samsung, and Garmin holding significant market share. However, the emergence of numerous niche players and innovative startups is driving increased competition. Market concentration is influenced by factors such as brand recognition, technological advancements, distribution channels, and pricing strategies. The historical period (2019-2024) witnessed significant M&A activity, with approximately xx deals recorded, primarily focused on consolidating market share and expanding product portfolios. Innovation drivers include advancements in sensor technology, improved battery life, and the integration of advanced health monitoring features. Regulatory frameworks, while generally supportive of technological advancement, vary across regions, impacting market access and product compliance. Product substitutes include basic fitness trackers and traditional wristwatches, although smartwatches' functionality and versatility are driving market dominance. End-user trends indicate a growing preference for stylish, feature-rich devices with seamless smartphone integration.
- Market Share (2024): Apple (xx%), Samsung (xx%), Garmin (xx%), Others (xx%)
- M&A Deal Count (2019-2024): xx
- Key Innovation Drivers: Advanced sensors, improved battery technology, health & fitness integration.
- Regulatory Landscape: Varies by region; impacting market access and product compliance.
Smartwatch Industry Industry Trends & Analysis
The smartwatch market is characterized by robust growth, driven primarily by increasing smartphone penetration, rising consumer disposable incomes, and the growing popularity of fitness and health tracking. Technological disruptions, such as the introduction of 5G connectivity and advancements in display technologies (AMOLED, PMOLED), are shaping consumer preferences and driving market segmentation. Consumer preferences are shifting towards devices with enhanced functionality, longer battery life, and sophisticated design aesthetics. The competitive landscape is highly dynamic, with established players facing competition from emerging brands and innovative startups. The market penetration of smartwatches is expected to reach xx% globally by 2033, driven by factors like increasing affordability and expanding product functionalities. Furthermore, the increasing integration of smartwatches with healthcare systems and applications further fuels market growth. The CAGR for the smartwatch market during the forecast period (2025-2033) is estimated at xx%.
Leading Markets & Segments in Smartwatch Industry
The North American region currently dominates the global smartwatch market, followed by Asia-Pacific and Europe. Within these regions, specific countries like the US, China, and Japan hold significant market share.
By Operating System:
- Watch OS: Holds significant market share due to Apple's strong brand recognition and ecosystem integration. Key drivers include strong brand loyalty and a polished user experience.
- Wear OS: Gaining traction with its open-source nature and compatibility with various devices, although market share remains comparatively lower. Key drivers include Android ecosystem integration and potential for customization.
- Other Operating Systems: Represents a niche segment including proprietary operating systems from various brands, holding a smaller, yet significant, market share. Key drivers include unique product offerings and targeting specific niche user groups.
By Display Type:
- AMOLED: Dominates due to superior image quality and energy efficiency, driving premium segment growth. Key drivers include superior color reproduction and power efficiency.
- PMOLED: More prevalent in budget-friendly models, offering a balance between cost and performance. Key drivers include cost-effectiveness and suitable for basic applications.
- TFT LCD: Mostly found in low-cost models; market share is shrinking due to AMOLED's superior qualities. Key drivers include cost, mainly focusing on basic smart functionalities.
By Application:
- Personal Assistance: This remains the largest segment, encompassing features like notifications, calendar alerts, and app integration. Key drivers include convenience and integration with daily life.
- Medical: Growing rapidly, due to advancements in health monitoring capabilities. Key drivers include the potential for remote patient monitoring and preventative healthcare.
- Sports: A significant segment with feature-rich options catering to fitness enthusiasts. Key drivers include accuracy in tracking fitness-related metrics and detailed data analysis.
- Other Applications: This category represents a collection of smaller, niche applications that are growing steadily.
Smartwatch Industry Product Developments
Recent product innovations focus on enhanced health monitoring features (ECG, SpO2), improved battery life, more sophisticated display technologies (AMOLED, always-on displays), and seamless integration with other smart devices within the respective ecosystems. Companies are also focusing on creating more stylish and versatile designs to appeal to broader consumer segments. This focus on integrated health features and improved aesthetic appeal ensures market fit and competitive advantage.
Key Drivers of Smartwatch Industry Growth
Technological advancements in sensor technology, display technology, and processing power are key drivers. Economic factors, such as rising disposable incomes and increased consumer spending on electronics, are also significantly contributing to growth. Favorable regulatory environments promoting technological adoption further accelerate market expansion. For example, the growing adoption of health and fitness applications is driving the demand for health-centric features in smartwatches.
Challenges in the Smartwatch Industry Market
High manufacturing costs and intense competition from numerous players pose significant challenges. Supply chain disruptions and component shortages can negatively impact production and delivery timelines. Regulatory hurdles concerning data privacy and security requirements across different regions add complexity for global players. The high cost of developing sophisticated features can also limit market penetration in price-sensitive segments. For instance, the average cost of producing high-end smartwatches can impact their affordability.
Emerging Opportunities in Smartwatch Industry
Integration with emerging technologies like 5G and AI offers significant growth potential. Strategic partnerships between smartwatch manufacturers and healthcare providers can unlock new revenue streams in the burgeoning health-tech market. Expanding into new and underserved markets, both geographically and in terms of application areas, presents considerable opportunities for market expansion.
Leading Players in the Smartwatch Industry Sector
- Polar Electro Oy
- LG Electronics Inc
- Lenovo Group Limited
- Casio Computer Co Ltd
- Zepp Health Corporation
- Samsung Electronics Co Ltd
- Garmin Ltd
- Fitbit Inc
- Huawei Technologies Co Ltd
- Fossil Group Inc
- Apple Inc
- Sony Corporation
Key Milestones in Smartwatch Industry Industry
- June 2022: Apple previewed watchOS 9, enhancing user experience and adding advanced workout metrics. This update significantly improved user engagement and market positioning.
- January 2022: Fossil and Razer launched a limited-edition smartwatch, showcasing successful co-branding and generating significant media buzz. This collaboration demonstrated innovation in design and marketing.
Strategic Outlook for Smartwatch Industry Market
The smartwatch market is poised for continued expansion, fueled by ongoing technological innovation and increasing consumer adoption. Strategic partnerships, expansion into new market segments (e.g., enterprise solutions), and development of niche applications will be crucial for long-term success. Companies that effectively integrate cutting-edge features, prioritize user experience, and adapt to evolving consumer preferences will gain a competitive edge in this rapidly growing market.
Smartwatch Industry Segmentation
-
1. Operating System
- 1.1. Watch OS
- 1.2. Wear OS
- 1.3. Other Operating Systems
-
2. Display Type
- 2.1. AMOLED
- 2.2. PMOLED
- 2.3. TFT LCD
-
3. Application
- 3.1. Personal Assistance
- 3.2. Medical
- 3.3. Sports
- 3.4. Other Applications
Smartwatch Industry Segmentation By Geography
- 1. North America: United States Canada Mexico
- 2. Europe: Germany: France: Italy: United Kingdom Netherlands Rest of Europe
- 3. Asia Pacific: China, Japan, India, South Korea, Taiwan, Australia, Rest of Asia-Pacific
- 4. South America : Brazil, Argentina, Rest of South America
- 5. MEA: Middle East, Africa
Smartwatch Industry REPORT HIGHLIGHTS
| Aspects | Details |
|---|---|
| Study Period | 2019-2033 |
| Base Year | 2024 |
| Estimated Year | 2025 |
| Forecast Period | 2025-2033 |
| Historical Period | 2019-2024 |
| Growth Rate | CAGR of 27.78% from 2019-2033 |
| Segmentation |
|
Table of Contents
- 1. Introduction
- 1.1. Research Scope
- 1.2. Market Segmentation
- 1.3. Research Methodology
- 1.4. Definitions and Assumptions
- 2. Executive Summary
- 2.1. Introduction
- 3. Market Dynamics
- 3.1. Introduction
- 3.2. Market Drivers
- 3.2.1. Increasing Technological Advancements in the Wearables Market; Increasing Health Awareness among the Consumers
- 3.3. Market Restrains
- 3.3.1 Growing Complexity of Wearable Devices
- 3.3.2 Limited Use of Features
- 3.3.3 and Security Risks
- 3.4. Market Trends
- 3.4.1. Sports Segment to Account for Significant Market Share
- 4. Market Factor Analysis
- 4.1. Porters Five Forces
- 4.2. Supply/Value Chain
- 4.3. PESTEL analysis
- 4.4. Market Entropy
- 4.5. Patent/Trademark Analysis
- 5. Global Smartwatch Industry Analysis, Insights and Forecast, 2019-2031
- 5.1. Market Analysis, Insights and Forecast - by Operating System
- 5.1.1. Watch OS
- 5.1.2. Wear OS
- 5.1.3. Other Operating Systems
- 5.2. Market Analysis, Insights and Forecast - by Display Type
- 5.2.1. AMOLED
- 5.2.2. PMOLED
- 5.2.3. TFT LCD
- 5.3. Market Analysis, Insights and Forecast - by Application
- 5.3.1. Personal Assistance
- 5.3.2. Medical
- 5.3.3. Sports
- 5.3.4. Other Applications
- 5.4. Market Analysis, Insights and Forecast - by Region
- 5.4.1. North America: United States Canada Mexico
- 5.4.2. Europe: Germany: France: Italy: United Kingdom Netherlands Rest of Europe
- 5.4.3. Asia Pacific: China, Japan, India, South Korea, Taiwan, Australia, Rest of Asia-Pacific
- 5.4.4. South America : Brazil, Argentina, Rest of South America
- 5.4.5. MEA: Middle East, Africa
- 5.1. Market Analysis, Insights and Forecast - by Operating System
- 6. North America: United States Canada Mexico Smartwatch Industry Analysis, Insights and Forecast, 2019-2031
- 6.1. Market Analysis, Insights and Forecast - by Operating System
- 6.1.1. Watch OS
- 6.1.2. Wear OS
- 6.1.3. Other Operating Systems
- 6.2. Market Analysis, Insights and Forecast - by Display Type
- 6.2.1. AMOLED
- 6.2.2. PMOLED
- 6.2.3. TFT LCD
- 6.3. Market Analysis, Insights and Forecast - by Application
- 6.3.1. Personal Assistance
- 6.3.2. Medical
- 6.3.3. Sports
- 6.3.4. Other Applications
- 6.1. Market Analysis, Insights and Forecast - by Operating System
- 7. Europe: Germany: France: Italy: United Kingdom Netherlands Rest of Europe Smartwatch Industry Analysis, Insights and Forecast, 2019-2031
- 7.1. Market Analysis, Insights and Forecast - by Operating System
- 7.1.1. Watch OS
- 7.1.2. Wear OS
- 7.1.3. Other Operating Systems
- 7.2. Market Analysis, Insights and Forecast - by Display Type
- 7.2.1. AMOLED
- 7.2.2. PMOLED
- 7.2.3. TFT LCD
- 7.3. Market Analysis, Insights and Forecast - by Application
- 7.3.1. Personal Assistance
- 7.3.2. Medical
- 7.3.3. Sports
- 7.3.4. Other Applications
- 7.1. Market Analysis, Insights and Forecast - by Operating System
- 8. Asia Pacific: China, Japan, India, South Korea, Taiwan, Australia, Rest of Asia-Pacific Smartwatch Industry Analysis, Insights and Forecast, 2019-2031
- 8.1. Market Analysis, Insights and Forecast - by Operating System
- 8.1.1. Watch OS
- 8.1.2. Wear OS
- 8.1.3. Other Operating Systems
- 8.2. Market Analysis, Insights and Forecast - by Display Type
- 8.2.1. AMOLED
- 8.2.2. PMOLED
- 8.2.3. TFT LCD
- 8.3. Market Analysis, Insights and Forecast - by Application
- 8.3.1. Personal Assistance
- 8.3.2. Medical
- 8.3.3. Sports
- 8.3.4. Other Applications
- 8.1. Market Analysis, Insights and Forecast - by Operating System
- 9. South America : Brazil, Argentina, Rest of South America Smartwatch Industry Analysis, Insights and Forecast, 2019-2031
- 9.1. Market Analysis, Insights and Forecast - by Operating System
- 9.1.1. Watch OS
- 9.1.2. Wear OS
- 9.1.3. Other Operating Systems
- 9.2. Market Analysis, Insights and Forecast - by Display Type
- 9.2.1. AMOLED
- 9.2.2. PMOLED
- 9.2.3. TFT LCD
- 9.3. Market Analysis, Insights and Forecast - by Application
- 9.3.1. Personal Assistance
- 9.3.2. Medical
- 9.3.3. Sports
- 9.3.4. Other Applications
- 9.1. Market Analysis, Insights and Forecast - by Operating System
- 10. MEA: Middle East, Africa Smartwatch Industry Analysis, Insights and Forecast, 2019-2031
- 10.1. Market Analysis, Insights and Forecast - by Operating System
- 10.1.1. Watch OS
- 10.1.2. Wear OS
- 10.1.3. Other Operating Systems
- 10.2. Market Analysis, Insights and Forecast - by Display Type
- 10.2.1. AMOLED
- 10.2.2. PMOLED
- 10.2.3. TFT LCD
- 10.3. Market Analysis, Insights and Forecast - by Application
- 10.3.1. Personal Assistance
- 10.3.2. Medical
- 10.3.3. Sports
- 10.3.4. Other Applications
- 10.1. Market Analysis, Insights and Forecast - by Operating System
- 11. North America Smartwatch Industry Analysis, Insights and Forecast, 2019-2031
- 11.1. Market Analysis, Insights and Forecast - By Country/Sub-region
- 11.1.1.
- 12. Europe Smartwatch Industry Analysis, Insights and Forecast, 2019-2031
- 12.1. Market Analysis, Insights and Forecast - By Country/Sub-region
- 12.1.1.
- 13. Asia Pacific Smartwatch Industry Analysis, Insights and Forecast, 2019-2031
- 13.1. Market Analysis, Insights and Forecast - By Country/Sub-region
- 13.1.1.
- 14. Rest of the World Smartwatch Industry Analysis, Insights and Forecast, 2019-2031
- 14.1. Market Analysis, Insights and Forecast - By Country/Sub-region
- 14.1.1.
- 15. Competitive Analysis
- 15.1. Global Market Share Analysis 2024
- 15.2. Company Profiles
- 15.2.1 Polar Electro Oy
- 15.2.1.1. Overview
- 15.2.1.2. Products
- 15.2.1.3. SWOT Analysis
- 15.2.1.4. Recent Developments
- 15.2.1.5. Financials (Based on Availability)
- 15.2.2 LG Electronics Inc
- 15.2.2.1. Overview
- 15.2.2.2. Products
- 15.2.2.3. SWOT Analysis
- 15.2.2.4. Recent Developments
- 15.2.2.5. Financials (Based on Availability)
- 15.2.3 Lenovo Group Limited
- 15.2.3.1. Overview
- 15.2.3.2. Products
- 15.2.3.3. SWOT Analysis
- 15.2.3.4. Recent Developments
- 15.2.3.5. Financials (Based on Availability)
- 15.2.4 Casio Computer Co Ltd
- 15.2.4.1. Overview
- 15.2.4.2. Products
- 15.2.4.3. SWOT Analysis
- 15.2.4.4. Recent Developments
- 15.2.4.5. Financials (Based on Availability)
- 15.2.5 Zepp Health Corporation
- 15.2.5.1. Overview
- 15.2.5.2. Products
- 15.2.5.3. SWOT Analysis
- 15.2.5.4. Recent Developments
- 15.2.5.5. Financials (Based on Availability)
- 15.2.6 Samsung Electronics Co Ltd
- 15.2.6.1. Overview
- 15.2.6.2. Products
- 15.2.6.3. SWOT Analysis
- 15.2.6.4. Recent Developments
- 15.2.6.5. Financials (Based on Availability)
- 15.2.7 Garmin Ltd
- 15.2.7.1. Overview
- 15.2.7.2. Products
- 15.2.7.3. SWOT Analysis
- 15.2.7.4. Recent Developments
- 15.2.7.5. Financials (Based on Availability)
- 15.2.8 Fitbit Inc
- 15.2.8.1. Overview
- 15.2.8.2. Products
- 15.2.8.3. SWOT Analysis
- 15.2.8.4. Recent Developments
- 15.2.8.5. Financials (Based on Availability)
- 15.2.9 Huawei Technologies Co Ltd
- 15.2.9.1. Overview
- 15.2.9.2. Products
- 15.2.9.3. SWOT Analysis
- 15.2.9.4. Recent Developments
- 15.2.9.5. Financials (Based on Availability)
- 15.2.10 Fossil Group Inc
- 15.2.10.1. Overview
- 15.2.10.2. Products
- 15.2.10.3. SWOT Analysis
- 15.2.10.4. Recent Developments
- 15.2.10.5. Financials (Based on Availability)
- 15.2.11 Apple Inc
- 15.2.11.1. Overview
- 15.2.11.2. Products
- 15.2.11.3. SWOT Analysis
- 15.2.11.4. Recent Developments
- 15.2.11.5. Financials (Based on Availability)
- 15.2.12 Sony Corporation
- 15.2.12.1. Overview
- 15.2.12.2. Products
- 15.2.12.3. SWOT Analysis
- 15.2.12.4. Recent Developments
- 15.2.12.5. Financials (Based on Availability)
- 15.2.1 Polar Electro Oy
List of Figures
- Figure 1: Global Smartwatch Industry Revenue Breakdown (Million, %) by Region 2024 & 2032
- Figure 2: Global Smartwatch Industry Volume Breakdown (Million, %) by Region 2024 & 2032
- Figure 3: North America Smartwatch Industry Revenue (Million), by Country 2024 & 2032
- Figure 4: North America Smartwatch Industry Volume (Million), by Country 2024 & 2032
- Figure 5: North America Smartwatch Industry Revenue Share (%), by Country 2024 & 2032
- Figure 6: North America Smartwatch Industry Volume Share (%), by Country 2024 & 2032
- Figure 7: Europe Smartwatch Industry Revenue (Million), by Country 2024 & 2032
- Figure 8: Europe Smartwatch Industry Volume (Million), by Country 2024 & 2032
- Figure 9: Europe Smartwatch Industry Revenue Share (%), by Country 2024 & 2032
- Figure 10: Europe Smartwatch Industry Volume Share (%), by Country 2024 & 2032
- Figure 11: Asia Pacific Smartwatch Industry Revenue (Million), by Country 2024 & 2032
- Figure 12: Asia Pacific Smartwatch Industry Volume (Million), by Country 2024 & 2032
- Figure 13: Asia Pacific Smartwatch Industry Revenue Share (%), by Country 2024 & 2032
- Figure 14: Asia Pacific Smartwatch Industry Volume Share (%), by Country 2024 & 2032
- Figure 15: Rest of the World Smartwatch Industry Revenue (Million), by Country 2024 & 2032
- Figure 16: Rest of the World Smartwatch Industry Volume (Million), by Country 2024 & 2032
- Figure 17: Rest of the World Smartwatch Industry Revenue Share (%), by Country 2024 & 2032
- Figure 18: Rest of the World Smartwatch Industry Volume Share (%), by Country 2024 & 2032
- Figure 19: North America: United States Canada Mexico Smartwatch Industry Revenue (Million), by Operating System 2024 & 2032
- Figure 20: North America: United States Canada Mexico Smartwatch Industry Volume (Million), by Operating System 2024 & 2032
- Figure 21: North America: United States Canada Mexico Smartwatch Industry Revenue Share (%), by Operating System 2024 & 2032
- Figure 22: North America: United States Canada Mexico Smartwatch Industry Volume Share (%), by Operating System 2024 & 2032
- Figure 23: North America: United States Canada Mexico Smartwatch Industry Revenue (Million), by Display Type 2024 & 2032
- Figure 24: North America: United States Canada Mexico Smartwatch Industry Volume (Million), by Display Type 2024 & 2032
- Figure 25: North America: United States Canada Mexico Smartwatch Industry Revenue Share (%), by Display Type 2024 & 2032
- Figure 26: North America: United States Canada Mexico Smartwatch Industry Volume Share (%), by Display Type 2024 & 2032
- Figure 27: North America: United States Canada Mexico Smartwatch Industry Revenue (Million), by Application 2024 & 2032
- Figure 28: North America: United States Canada Mexico Smartwatch Industry Volume (Million), by Application 2024 & 2032
- Figure 29: North America: United States Canada Mexico Smartwatch Industry Revenue Share (%), by Application 2024 & 2032
- Figure 30: North America: United States Canada Mexico Smartwatch Industry Volume Share (%), by Application 2024 & 2032
- Figure 31: North America: United States Canada Mexico Smartwatch Industry Revenue (Million), by Country 2024 & 2032
- Figure 32: North America: United States Canada Mexico Smartwatch Industry Volume (Million), by Country 2024 & 2032
- Figure 33: North America: United States Canada Mexico Smartwatch Industry Revenue Share (%), by Country 2024 & 2032
- Figure 34: North America: United States Canada Mexico Smartwatch Industry Volume Share (%), by Country 2024 & 2032
- Figure 35: Europe: Germany: France: Italy: United Kingdom Netherlands Rest of Europe Smartwatch Industry Revenue (Million), by Operating System 2024 & 2032
- Figure 36: Europe: Germany: France: Italy: United Kingdom Netherlands Rest of Europe Smartwatch Industry Volume (Million), by Operating System 2024 & 2032
- Figure 37: Europe: Germany: France: Italy: United Kingdom Netherlands Rest of Europe Smartwatch Industry Revenue Share (%), by Operating System 2024 & 2032
- Figure 38: Europe: Germany: France: Italy: United Kingdom Netherlands Rest of Europe Smartwatch Industry Volume Share (%), by Operating System 2024 & 2032
- Figure 39: Europe: Germany: France: Italy: United Kingdom Netherlands Rest of Europe Smartwatch Industry Revenue (Million), by Display Type 2024 & 2032
- Figure 40: Europe: Germany: France: Italy: United Kingdom Netherlands Rest of Europe Smartwatch Industry Volume (Million), by Display Type 2024 & 2032
- Figure 41: Europe: Germany: France: Italy: United Kingdom Netherlands Rest of Europe Smartwatch Industry Revenue Share (%), by Display Type 2024 & 2032
- Figure 42: Europe: Germany: France: Italy: United Kingdom Netherlands Rest of Europe Smartwatch Industry Volume Share (%), by Display Type 2024 & 2032
- Figure 43: Europe: Germany: France: Italy: United Kingdom Netherlands Rest of Europe Smartwatch Industry Revenue (Million), by Application 2024 & 2032
- Figure 44: Europe: Germany: France: Italy: United Kingdom Netherlands Rest of Europe Smartwatch Industry Volume (Million), by Application 2024 & 2032
- Figure 45: Europe: Germany: France: Italy: United Kingdom Netherlands Rest of Europe Smartwatch Industry Revenue Share (%), by Application 2024 & 2032
- Figure 46: Europe: Germany: France: Italy: United Kingdom Netherlands Rest of Europe Smartwatch Industry Volume Share (%), by Application 2024 & 2032
- Figure 47: Europe: Germany: France: Italy: United Kingdom Netherlands Rest of Europe Smartwatch Industry Revenue (Million), by Country 2024 & 2032
- Figure 48: Europe: Germany: France: Italy: United Kingdom Netherlands Rest of Europe Smartwatch Industry Volume (Million), by Country 2024 & 2032
- Figure 49: Europe: Germany: France: Italy: United Kingdom Netherlands Rest of Europe Smartwatch Industry Revenue Share (%), by Country 2024 & 2032
- Figure 50: Europe: Germany: France: Italy: United Kingdom Netherlands Rest of Europe Smartwatch Industry Volume Share (%), by Country 2024 & 2032
- Figure 51: Asia Pacific: China, Japan, India, South Korea, Taiwan, Australia, Rest of Asia-Pacific Smartwatch Industry Revenue (Million), by Operating System 2024 & 2032
- Figure 52: Asia Pacific: China, Japan, India, South Korea, Taiwan, Australia, Rest of Asia-Pacific Smartwatch Industry Volume (Million), by Operating System 2024 & 2032
- Figure 53: Asia Pacific: China, Japan, India, South Korea, Taiwan, Australia, Rest of Asia-Pacific Smartwatch Industry Revenue Share (%), by Operating System 2024 & 2032
- Figure 54: Asia Pacific: China, Japan, India, South Korea, Taiwan, Australia, Rest of Asia-Pacific Smartwatch Industry Volume Share (%), by Operating System 2024 & 2032
- Figure 55: Asia Pacific: China, Japan, India, South Korea, Taiwan, Australia, Rest of Asia-Pacific Smartwatch Industry Revenue (Million), by Display Type 2024 & 2032
- Figure 56: Asia Pacific: China, Japan, India, South Korea, Taiwan, Australia, Rest of Asia-Pacific Smartwatch Industry Volume (Million), by Display Type 2024 & 2032
- Figure 57: Asia Pacific: China, Japan, India, South Korea, Taiwan, Australia, Rest of Asia-Pacific Smartwatch Industry Revenue Share (%), by Display Type 2024 & 2032
- Figure 58: Asia Pacific: China, Japan, India, South Korea, Taiwan, Australia, Rest of Asia-Pacific Smartwatch Industry Volume Share (%), by Display Type 2024 & 2032
- Figure 59: Asia Pacific: China, Japan, India, South Korea, Taiwan, Australia, Rest of Asia-Pacific Smartwatch Industry Revenue (Million), by Application 2024 & 2032
- Figure 60: Asia Pacific: China, Japan, India, South Korea, Taiwan, Australia, Rest of Asia-Pacific Smartwatch Industry Volume (Million), by Application 2024 & 2032
- Figure 61: Asia Pacific: China, Japan, India, South Korea, Taiwan, Australia, Rest of Asia-Pacific Smartwatch Industry Revenue Share (%), by Application 2024 & 2032
- Figure 62: Asia Pacific: China, Japan, India, South Korea, Taiwan, Australia, Rest of Asia-Pacific Smartwatch Industry Volume Share (%), by Application 2024 & 2032
- Figure 63: Asia Pacific: China, Japan, India, South Korea, Taiwan, Australia, Rest of Asia-Pacific Smartwatch Industry Revenue (Million), by Country 2024 & 2032
- Figure 64: Asia Pacific: China, Japan, India, South Korea, Taiwan, Australia, Rest of Asia-Pacific Smartwatch Industry Volume (Million), by Country 2024 & 2032
- Figure 65: Asia Pacific: China, Japan, India, South Korea, Taiwan, Australia, Rest of Asia-Pacific Smartwatch Industry Revenue Share (%), by Country 2024 & 2032
- Figure 66: Asia Pacific: China, Japan, India, South Korea, Taiwan, Australia, Rest of Asia-Pacific Smartwatch Industry Volume Share (%), by Country 2024 & 2032
- Figure 67: South America : Brazil, Argentina, Rest of South America Smartwatch Industry Revenue (Million), by Operating System 2024 & 2032
- Figure 68: South America : Brazil, Argentina, Rest of South America Smartwatch Industry Volume (Million), by Operating System 2024 & 2032
- Figure 69: South America : Brazil, Argentina, Rest of South America Smartwatch Industry Revenue Share (%), by Operating System 2024 & 2032
- Figure 70: South America : Brazil, Argentina, Rest of South America Smartwatch Industry Volume Share (%), by Operating System 2024 & 2032
- Figure 71: South America : Brazil, Argentina, Rest of South America Smartwatch Industry Revenue (Million), by Display Type 2024 & 2032
- Figure 72: South America : Brazil, Argentina, Rest of South America Smartwatch Industry Volume (Million), by Display Type 2024 & 2032
- Figure 73: South America : Brazil, Argentina, Rest of South America Smartwatch Industry Revenue Share (%), by Display Type 2024 & 2032
- Figure 74: South America : Brazil, Argentina, Rest of South America Smartwatch Industry Volume Share (%), by Display Type 2024 & 2032
- Figure 75: South America : Brazil, Argentina, Rest of South America Smartwatch Industry Revenue (Million), by Application 2024 & 2032
- Figure 76: South America : Brazil, Argentina, Rest of South America Smartwatch Industry Volume (Million), by Application 2024 & 2032
- Figure 77: South America : Brazil, Argentina, Rest of South America Smartwatch Industry Revenue Share (%), by Application 2024 & 2032
- Figure 78: South America : Brazil, Argentina, Rest of South America Smartwatch Industry Volume Share (%), by Application 2024 & 2032
- Figure 79: South America : Brazil, Argentina, Rest of South America Smartwatch Industry Revenue (Million), by Country 2024 & 2032
- Figure 80: South America : Brazil, Argentina, Rest of South America Smartwatch Industry Volume (Million), by Country 2024 & 2032
- Figure 81: South America : Brazil, Argentina, Rest of South America Smartwatch Industry Revenue Share (%), by Country 2024 & 2032
- Figure 82: South America : Brazil, Argentina, Rest of South America Smartwatch Industry Volume Share (%), by Country 2024 & 2032
- Figure 83: MEA: Middle East, Africa Smartwatch Industry Revenue (Million), by Operating System 2024 & 2032
- Figure 84: MEA: Middle East, Africa Smartwatch Industry Volume (Million), by Operating System 2024 & 2032
- Figure 85: MEA: Middle East, Africa Smartwatch Industry Revenue Share (%), by Operating System 2024 & 2032
- Figure 86: MEA: Middle East, Africa Smartwatch Industry Volume Share (%), by Operating System 2024 & 2032
- Figure 87: MEA: Middle East, Africa Smartwatch Industry Revenue (Million), by Display Type 2024 & 2032
- Figure 88: MEA: Middle East, Africa Smartwatch Industry Volume (Million), by Display Type 2024 & 2032
- Figure 89: MEA: Middle East, Africa Smartwatch Industry Revenue Share (%), by Display Type 2024 & 2032
- Figure 90: MEA: Middle East, Africa Smartwatch Industry Volume Share (%), by Display Type 2024 & 2032
- Figure 91: MEA: Middle East, Africa Smartwatch Industry Revenue (Million), by Application 2024 & 2032
- Figure 92: MEA: Middle East, Africa Smartwatch Industry Volume (Million), by Application 2024 & 2032
- Figure 93: MEA: Middle East, Africa Smartwatch Industry Revenue Share (%), by Application 2024 & 2032
- Figure 94: MEA: Middle East, Africa Smartwatch Industry Volume Share (%), by Application 2024 & 2032
- Figure 95: MEA: Middle East, Africa Smartwatch Industry Revenue (Million), by Country 2024 & 2032
- Figure 96: MEA: Middle East, Africa Smartwatch Industry Volume (Million), by Country 2024 & 2032
- Figure 97: MEA: Middle East, Africa Smartwatch Industry Revenue Share (%), by Country 2024 & 2032
- Figure 98: MEA: Middle East, Africa Smartwatch Industry Volume Share (%), by Country 2024 & 2032
List of Tables
- Table 1: Global Smartwatch Industry Revenue Million Forecast, by Region 2019 & 2032
- Table 2: Global Smartwatch Industry Volume Million Forecast, by Region 2019 & 2032
- Table 3: Global Smartwatch Industry Revenue Million Forecast, by Operating System 2019 & 2032
- Table 4: Global Smartwatch Industry Volume Million Forecast, by Operating System 2019 & 2032
- Table 5: Global Smartwatch Industry Revenue Million Forecast, by Display Type 2019 & 2032
- Table 6: Global Smartwatch Industry Volume Million Forecast, by Display Type 2019 & 2032
- Table 7: Global Smartwatch Industry Revenue Million Forecast, by Application 2019 & 2032
- Table 8: Global Smartwatch Industry Volume Million Forecast, by Application 2019 & 2032
- Table 9: Global Smartwatch Industry Revenue Million Forecast, by Region 2019 & 2032
- Table 10: Global Smartwatch Industry Volume Million Forecast, by Region 2019 & 2032
- Table 11: Global Smartwatch Industry Revenue Million Forecast, by Country 2019 & 2032
- Table 12: Global Smartwatch Industry Volume Million Forecast, by Country 2019 & 2032
- Table 13: Smartwatch Industry Revenue (Million) Forecast, by Application 2019 & 2032
- Table 14: Smartwatch Industry Volume (Million) Forecast, by Application 2019 & 2032
- Table 15: Global Smartwatch Industry Revenue Million Forecast, by Country 2019 & 2032
- Table 16: Global Smartwatch Industry Volume Million Forecast, by Country 2019 & 2032
- Table 17: Smartwatch Industry Revenue (Million) Forecast, by Application 2019 & 2032
- Table 18: Smartwatch Industry Volume (Million) Forecast, by Application 2019 & 2032
- Table 19: Global Smartwatch Industry Revenue Million Forecast, by Country 2019 & 2032
- Table 20: Global Smartwatch Industry Volume Million Forecast, by Country 2019 & 2032
- Table 21: Smartwatch Industry Revenue (Million) Forecast, by Application 2019 & 2032
- Table 22: Smartwatch Industry Volume (Million) Forecast, by Application 2019 & 2032
- Table 23: Global Smartwatch Industry Revenue Million Forecast, by Country 2019 & 2032
- Table 24: Global Smartwatch Industry Volume Million Forecast, by Country 2019 & 2032
- Table 25: Smartwatch Industry Revenue (Million) Forecast, by Application 2019 & 2032
- Table 26: Smartwatch Industry Volume (Million) Forecast, by Application 2019 & 2032
- Table 27: Global Smartwatch Industry Revenue Million Forecast, by Operating System 2019 & 2032
- Table 28: Global Smartwatch Industry Volume Million Forecast, by Operating System 2019 & 2032
- Table 29: Global Smartwatch Industry Revenue Million Forecast, by Display Type 2019 & 2032
- Table 30: Global Smartwatch Industry Volume Million Forecast, by Display Type 2019 & 2032
- Table 31: Global Smartwatch Industry Revenue Million Forecast, by Application 2019 & 2032
- Table 32: Global Smartwatch Industry Volume Million Forecast, by Application 2019 & 2032
- Table 33: Global Smartwatch Industry Revenue Million Forecast, by Country 2019 & 2032
- Table 34: Global Smartwatch Industry Volume Million Forecast, by Country 2019 & 2032
- Table 35: Global Smartwatch Industry Revenue Million Forecast, by Operating System 2019 & 2032
- Table 36: Global Smartwatch Industry Volume Million Forecast, by Operating System 2019 & 2032
- Table 37: Global Smartwatch Industry Revenue Million Forecast, by Display Type 2019 & 2032
- Table 38: Global Smartwatch Industry Volume Million Forecast, by Display Type 2019 & 2032
- Table 39: Global Smartwatch Industry Revenue Million Forecast, by Application 2019 & 2032
- Table 40: Global Smartwatch Industry Volume Million Forecast, by Application 2019 & 2032
- Table 41: Global Smartwatch Industry Revenue Million Forecast, by Country 2019 & 2032
- Table 42: Global Smartwatch Industry Volume Million Forecast, by Country 2019 & 2032
- Table 43: Global Smartwatch Industry Revenue Million Forecast, by Operating System 2019 & 2032
- Table 44: Global Smartwatch Industry Volume Million Forecast, by Operating System 2019 & 2032
- Table 45: Global Smartwatch Industry Revenue Million Forecast, by Display Type 2019 & 2032
- Table 46: Global Smartwatch Industry Volume Million Forecast, by Display Type 2019 & 2032
- Table 47: Global Smartwatch Industry Revenue Million Forecast, by Application 2019 & 2032
- Table 48: Global Smartwatch Industry Volume Million Forecast, by Application 2019 & 2032
- Table 49: Global Smartwatch Industry Revenue Million Forecast, by Country 2019 & 2032
- Table 50: Global Smartwatch Industry Volume Million Forecast, by Country 2019 & 2032
- Table 51: Global Smartwatch Industry Revenue Million Forecast, by Operating System 2019 & 2032
- Table 52: Global Smartwatch Industry Volume Million Forecast, by Operating System 2019 & 2032
- Table 53: Global Smartwatch Industry Revenue Million Forecast, by Display Type 2019 & 2032
- Table 54: Global Smartwatch Industry Volume Million Forecast, by Display Type 2019 & 2032
- Table 55: Global Smartwatch Industry Revenue Million Forecast, by Application 2019 & 2032
- Table 56: Global Smartwatch Industry Volume Million Forecast, by Application 2019 & 2032
- Table 57: Global Smartwatch Industry Revenue Million Forecast, by Country 2019 & 2032
- Table 58: Global Smartwatch Industry Volume Million Forecast, by Country 2019 & 2032
- Table 59: Global Smartwatch Industry Revenue Million Forecast, by Operating System 2019 & 2032
- Table 60: Global Smartwatch Industry Volume Million Forecast, by Operating System 2019 & 2032
- Table 61: Global Smartwatch Industry Revenue Million Forecast, by Display Type 2019 & 2032
- Table 62: Global Smartwatch Industry Volume Million Forecast, by Display Type 2019 & 2032
- Table 63: Global Smartwatch Industry Revenue Million Forecast, by Application 2019 & 2032
- Table 64: Global Smartwatch Industry Volume Million Forecast, by Application 2019 & 2032
- Table 65: Global Smartwatch Industry Revenue Million Forecast, by Country 2019 & 2032
- Table 66: Global Smartwatch Industry Volume Million Forecast, by Country 2019 & 2032
Frequently Asked Questions
1. What is the projected Compound Annual Growth Rate (CAGR) of the Smartwatch Industry?
The projected CAGR is approximately 27.78%.
2. Which companies are prominent players in the Smartwatch Industry?
Key companies in the market include Polar Electro Oy, LG Electronics Inc, Lenovo Group Limited, Casio Computer Co Ltd, Zepp Health Corporation, Samsung Electronics Co Ltd, Garmin Ltd, Fitbit Inc, Huawei Technologies Co Ltd, Fossil Group Inc, Apple Inc, Sony Corporation.
3. What are the main segments of the Smartwatch Industry?
The market segments include Operating System, Display Type, Application.
4. Can you provide details about the market size?
The market size is estimated to be USD XX Million as of 2022.
5. What are some drivers contributing to market growth?
Increasing Technological Advancements in the Wearables Market; Increasing Health Awareness among the Consumers.
6. What are the notable trends driving market growth?
Sports Segment to Account for Significant Market Share.
7. Are there any restraints impacting market growth?
Growing Complexity of Wearable Devices. Limited Use of Features. and Security Risks.
8. Can you provide examples of recent developments in the market?
June 2022 - Apple previewed watch OS 9, which brings the latest features and improved experiences to the wearable operating system. Apple Watch users can now have more watch faces to choose from, with richer complications that offer more information and opportunity for personalization. In the updated Workout app, advanced metrics, views, and training experiences inspired by high-performing athletes help users take their workouts to the next level.
9. What pricing options are available for accessing the report?
Pricing options include single-user, multi-user, and enterprise licenses priced at USD 3800, USD 4500, and USD 5800 respectively.
10. Is the market size provided in terms of value or volume?
The market size is provided in terms of value, measured in Million and volume, measured in Million.
11. Are there any specific market keywords associated with the report?
Yes, the market keyword associated with the report is "Smartwatch Industry," which aids in identifying and referencing the specific market segment covered.
12. How do I determine which pricing option suits my needs best?
The pricing options vary based on user requirements and access needs. Individual users may opt for single-user licenses, while businesses requiring broader access may choose multi-user or enterprise licenses for cost-effective access to the report.
13. Are there any additional resources or data provided in the Smartwatch Industry report?
While the report offers comprehensive insights, it's advisable to review the specific contents or supplementary materials provided to ascertain if additional resources or data are available.
14. How can I stay updated on further developments or reports in the Smartwatch Industry?
To stay informed about further developments, trends, and reports in the Smartwatch Industry, consider subscribing to industry newsletters, following relevant companies and organizations, or regularly checking reputable industry news sources and publications.
Methodology
Step 1 - Identification of Relevant Samples Size from Population Database


Step 2 - Approaches for Defining Global Market Size (Value, Volume* & Price*)

Note*: In applicable scenarios
Step 3 - Data Sources
Primary Research
- Web Analytics
- Survey Reports
- Research Institute
- Latest Research Reports
- Opinion Leaders
Secondary Research
- Annual Reports
- White Paper
- Latest Press Release
- Industry Association
- Paid Database
- Investor Presentations

Step 4 - Data Triangulation
Involves using different sources of information in order to increase the validity of a study
These sources are likely to be stakeholders in a program - participants, other researchers, program staff, other community members, and so on.
Then we put all data in single framework & apply various statistical tools to find out the dynamic on the market.
During the analysis stage, feedback from the stakeholder groups would be compared to determine areas of agreement as well as areas of divergence
