

Key Insights
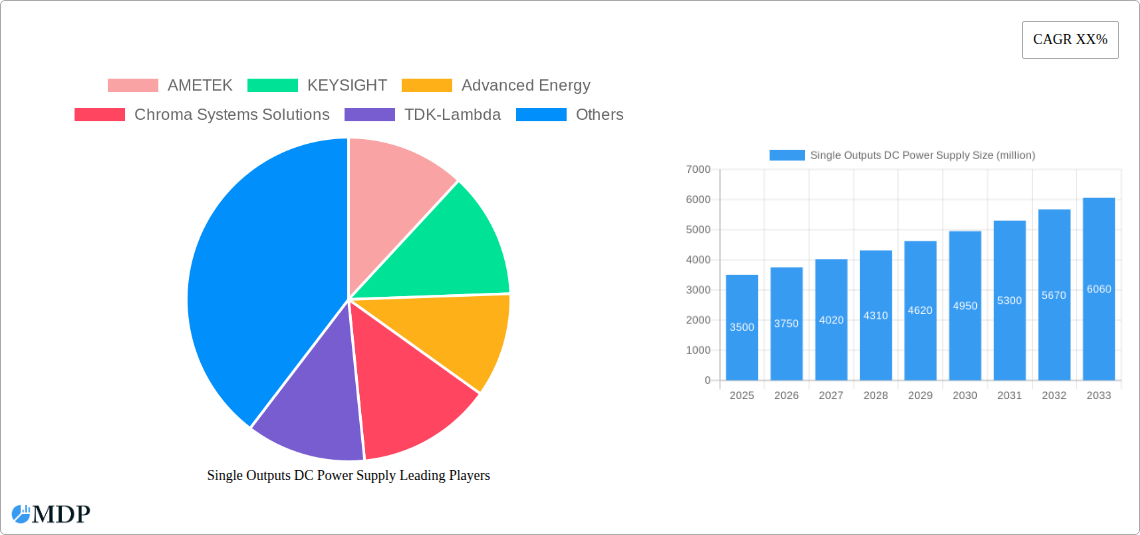
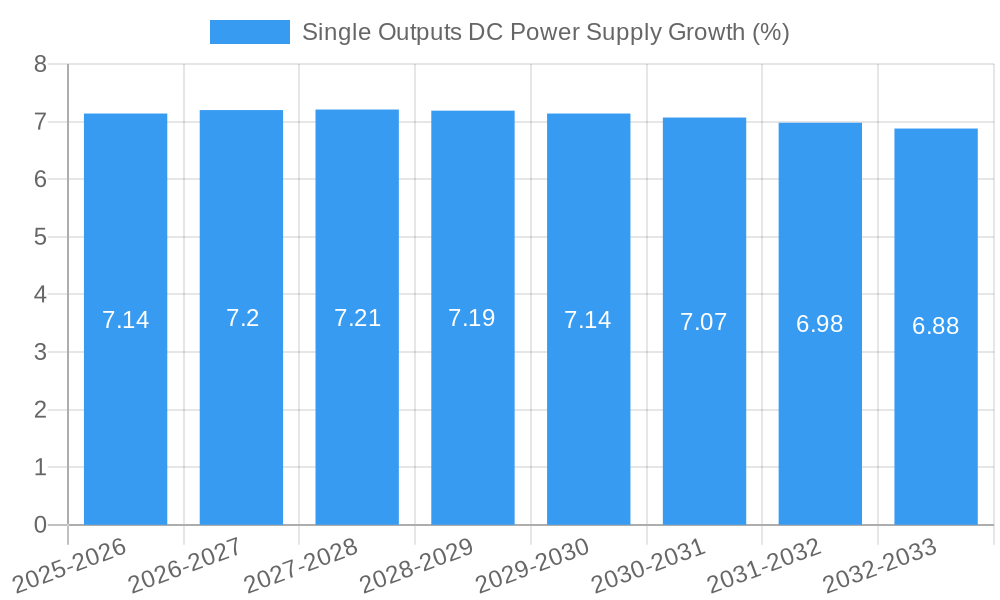
The global Single Output DC Power Supply market is projected for substantial expansion, driven by robust demand across diverse sectors. With a current market size estimated at approximately USD 3,500 million and a projected Compound Annual Growth Rate (CAGR) of around 7.5%, the market is poised for significant value appreciation through 2033. This growth is primarily fueled by the escalating adoption of single output DC power supplies in the automotive industry, particularly with the surge in electric vehicle (EV) production and advanced driver-assistance systems (ADAS) integration. The semiconductor fabrication sector also presents a strong growth avenue, necessitating precise and stable power for complex manufacturing processes. Furthermore, the increasing prevalence of industrial automation, sophisticated medical equipment, and advanced research in universities and laboratories are key contributors to this upward trajectory. The market’s value is expected to reach over USD 7,000 million by 2033, underscoring its vital role in powering innovation and modern technological infrastructure.
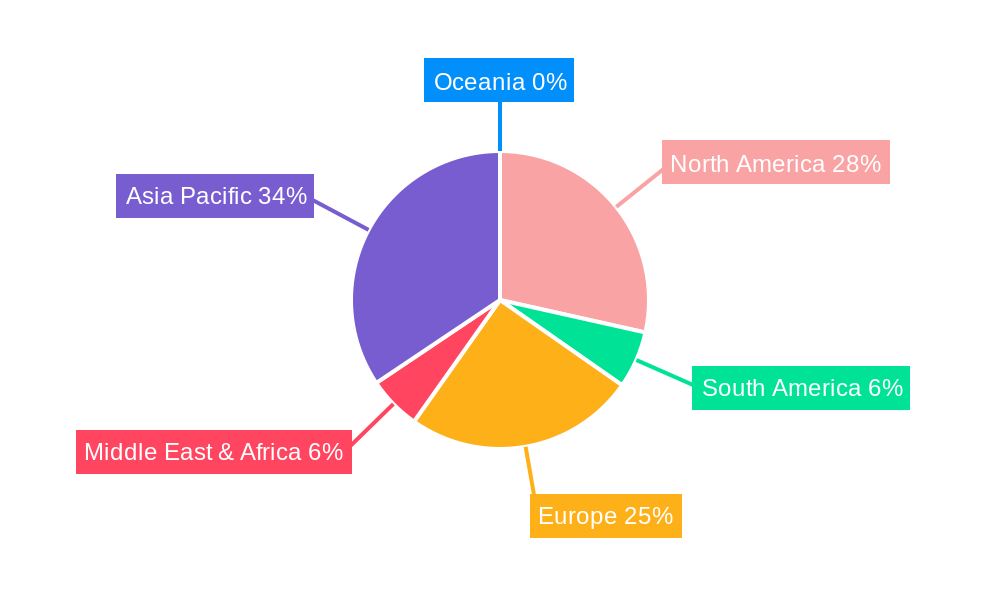
The market landscape is characterized by a growing demand for both fixed and adjustable output voltage DC power supplies, catering to a wide array of specific application needs. While fixed output supplies offer simplicity and cost-effectiveness for many general applications, the increasing complexity and evolving requirements in fields like R&D and advanced manufacturing are driving a greater demand for the flexibility and precision offered by adjustable output voltage solutions. Key players like AMETEK, KEYSIGHT, Advanced Energy, and TDK-Lambda are at the forefront, continually innovating to meet these evolving demands with more efficient, compact, and intelligent power supply solutions. Geographic expansion is also a notable trend, with Asia Pacific, led by China and India, emerging as a significant growth hub due to its burgeoning manufacturing capabilities and substantial investments in technology and infrastructure. Challenges such as supply chain disruptions and the high cost of advanced component integration are present but are being addressed through strategic partnerships and advancements in manufacturing techniques.
Single Outputs DC Power Supply Market Insights: A Comprehensive Analysis (2019-2033)
This in-depth report provides a critical analysis of the Single Outputs DC Power Supply market, encompassing a detailed study from 2019 to 2033, with a base year of 2025 and a forecast period from 2025 to 2033. It delves into market dynamics, key industry trends, leading segments, product innovations, growth drivers, challenges, emerging opportunities, and the strategic outlook for this crucial sector. We offer actionable insights for industry stakeholders seeking to navigate this complex and rapidly evolving landscape.
Single Outputs DC Power Supply Market Dynamics & Concentration
The Single Outputs DC Power Supply market exhibits a moderate level of concentration, with several dominant players holding significant market share. Key innovation drivers include the increasing demand for higher power density, greater efficiency, and enhanced safety features across various applications. Regulatory frameworks, such as CE and UL certifications, are pivotal, ensuring product compliance and market access. Product substitutes, while present in some niche areas, are largely unable to replicate the precision and reliability offered by specialized DC power supplies. End-user trends are heavily influenced by the rapid advancement of industries like automotive electrification, semiconductor fabrication, and industrial automation, each demanding increasingly sophisticated power solutions. Merger and acquisition (M&A) activities are moderately prevalent, with strategic acquisitions aimed at expanding product portfolios, gaining technological expertise, or consolidating market presence. For instance, the market has witnessed approximately xx M&A deals annually over the historical period, with major players like AMETEK and KEYSIGHT actively pursuing growth through such strategies. Market share distribution sees the top 5 companies accounting for roughly 45% of the global market revenue.
Single Outputs DC Power Supply Industry Trends & Analysis
The global Single Outputs DC Power Supply market is poised for robust growth, driven by several interconnected factors. The Compound Annual Growth Rate (CAGR) is projected to be approximately 6.5% during the forecast period (2025-2033). This expansion is primarily fueled by the insatiable demand from the automotive sector for electric vehicle (EV) charging infrastructure and onboard power management systems. Furthermore, the burgeoning semiconductor fabrication industry, with its continuous need for highly stable and precise power for testing and manufacturing complex microchips, represents another significant growth catalyst. Industrial automation, encompassing robotics, smart manufacturing, and advanced machinery, also contributes substantially to market penetration, as these systems increasingly rely on reliable DC power. In the medical domain, the development of advanced diagnostic equipment and life-support systems necessitates dependable and precise DC power supplies. Universities and research laboratories, pushing the boundaries of scientific discovery, also represent a consistent demand for high-quality, configurable power solutions. Consumer preferences are shifting towards more energy-efficient, compact, and feature-rich power supplies, including those with advanced communication interfaces for remote monitoring and control. Technological disruptions are centered on the integration of digital control, AI-powered diagnostics, and advanced thermal management to achieve higher power densities and improved reliability. The competitive dynamics are characterized by fierce price competition in some segments, balanced by a strong emphasis on innovation and specialized solutions in others. Market penetration is expected to reach nearly xx% of its attainable potential by 2033.
Leading Markets & Segments in Single Outputs DC Power Supply
North America, particularly the United States, currently dominates the Single Outputs DC Power Supply market, driven by its robust semiconductor fabrication industry and significant investments in automotive R&D and infrastructure. Key drivers for this dominance include favorable economic policies supporting technological innovation and significant government funding for advanced manufacturing initiatives. The Semiconductor Fabrication segment, both in terms of revenue and volume, stands out as the leading application, followed closely by the Industrial sector. The automotive application is experiencing the fastest growth, fueled by the global transition towards electric mobility.
- Dominant Region: North America (especially USA)
- Key Drivers: Advanced semiconductor manufacturing ecosystem, strong automotive R&D, supportive government policies for advanced manufacturing.
- Leading Application Segment: Semiconductor Fabrication
- Key Drivers: Precision power requirements for wafer fabrication, testing of integrated circuits, and advanced lithography equipment.
- Fastest Growing Application Segment: Automotive
- Key Drivers: Electric vehicle battery testing and charging, onboard power distribution, advanced driver-assistance systems (ADAS).
- Prominent Type: Adjustable Output Voltage DC Power Supply
- Key Drivers: Flexibility and versatility for R&D, prototyping, and a wide range of testing scenarios across various industries.
- Dominance Analysis: Adjustable output voltage power supplies are favored due to their adaptability in research and development settings and their ability to cater to a broad spectrum of testing requirements, from low-power sensitive electronics to high-power industrial applications. Their programmable nature allows for precise control and simulation of various operating conditions, making them indispensable tools for engineers and researchers.
Single Outputs DC Power Supply Product Developments
Recent product developments in the Single Outputs DC Power Supply market are characterized by an increasing focus on higher power density, enhanced efficiency (exceeding 95%), and advanced digital control capabilities. Innovations include intelligent power management systems, remote monitoring via IoT connectivity, and sophisticated protection features. Companies are developing compact, modular designs for easier integration into complex systems. These advancements offer significant competitive advantages by reducing footprint, lowering operating costs, and improving overall system performance for applications in demanding sectors like aerospace and defense, alongside the already robust automotive and semiconductor segments.
Key Drivers of Single Outputs DC Power Supply Growth
The growth of the Single Outputs DC Power Supply market is propelled by several key factors. Technologically, the increasing miniaturization of electronics and the demand for higher power efficiency are driving innovation. Economically, the burgeoning growth in emerging economies and the ongoing industrialization across various sectors create sustained demand. Regulatory frameworks, while sometimes a hurdle, also act as drivers by mandating safety and performance standards, pushing manufacturers to develop compliant and superior products. Specific examples include the surge in demand for specialized power supplies for 5G infrastructure deployment and the continuous expansion of data centers globally, requiring highly reliable and efficient power solutions.
Challenges in the Single Outputs DC Power Supply Market
Despite the promising growth, the Single Outputs DC Power Supply market faces several challenges. Intense price competition, particularly in the commoditized segments, can put pressure on profit margins. Supply chain disruptions, as witnessed in recent global events, can impact lead times and raw material costs. Moreover, the rapid pace of technological evolution necessitates continuous investment in R&D, which can be a significant burden for smaller players. Furthermore, stringent environmental regulations regarding energy efficiency and material sourcing add complexity to product development and manufacturing processes, impacting approximately xx% of production costs.
Emerging Opportunities in Single Outputs DC Power Supply
Emerging opportunities in the Single Outputs DC Power Supply market are vast and varied. The accelerating adoption of renewable energy sources, particularly solar and wind power, requires specialized DC power supplies for grid integration and energy storage solutions. The expansion of advanced manufacturing techniques, such as additive manufacturing (3D printing), also presents a growing demand for precision power control. Strategic partnerships between power supply manufacturers and original equipment manufacturers (OEMs) are crucial for co-developing customized solutions. Market expansion into underserved regions with developing industrial bases also offers significant long-term growth potential.
Leading Players in the Single Outputs DC Power Supply Sector
- AMETEK
- KEYSIGHT
- Advanced Energy
- Chroma Systems Solutions
- TDK-Lambda
- Delta Electronics, Inc.
- XP Power
- National Instruments Corporation
- Tektronix
- EA Elektro-Automatik
- Matsusada Precision
- Magna-Power
- B&K Precision Corporation
- Good Will Instrument Co.,Ltd
- Scientech Technologies
- RIGOL TECHNOLOGIES,INC.
- Aim-Tti
- Preen
Key Milestones in Single Outputs DC Power Supply Industry
- 2019: Launch of highly efficient GaN-based power supplies by several manufacturers, reducing energy loss.
- 2020: Increased demand for remote-controlled and monitored power supplies due to widespread adoption of remote work.
- 2021: Significant supply chain disruptions impacting component availability and lead times across the industry.
- 2022: Introduction of more compact and modular power supply designs for space-constrained applications.
- 2023: Growing emphasis on cybersecurity features within intelligent power supply systems.
- 2024: Increased integration of AI for predictive maintenance and fault detection in high-end DC power supplies.
Strategic Outlook for Single Outputs DC Power Supply Market
The strategic outlook for the Single Outputs DC Power Supply market is overwhelmingly positive, driven by continued technological advancements and the persistent demand from high-growth sectors. Key growth accelerators include the relentless pursuit of higher energy efficiency, the integration of smart and connected functionalities, and the ongoing miniaturization of electronic devices. Companies that focus on innovation, build strong distribution networks, and offer customized solutions tailored to specific application needs will be best positioned for success. Furthermore, strategic collaborations and a proactive approach to adopting new semiconductor technologies will be crucial for maintaining a competitive edge in this dynamic market. The market is expected to witness sustained expansion, offering attractive opportunities for both established players and new entrants.
Single Outputs DC Power Supply Segmentation
-
1. Application
- 1.1. Automotive
- 1.2. Semiconductor Fabrication
- 1.3. Industrial
- 1.4. Medical
- 1.5. Universities and laboratories
- 1.6. Others
-
2. Types
- 2.1. Fixed Output Voltage DC Power Supply
- 2.2. Adjustable Output Voltage DC Power Supply
Single Outputs DC Power Supply Segmentation By Geography
-
1. North America
- 1.1. United States
- 1.2. Canada
- 1.3. Mexico
-
2. South America
- 2.1. Brazil
- 2.2. Argentina
- 2.3. Rest of South America
-
3. Europe
- 3.1. United Kingdom
- 3.2. Germany
- 3.3. France
- 3.4. Italy
- 3.5. Spain
- 3.6. Russia
- 3.7. Benelux
- 3.8. Nordics
- 3.9. Rest of Europe
-
4. Middle East & Africa
- 4.1. Turkey
- 4.2. Israel
- 4.3. GCC
- 4.4. North Africa
- 4.5. South Africa
- 4.6. Rest of Middle East & Africa
-
5. Asia Pacific
- 5.1. China
- 5.2. India
- 5.3. Japan
- 5.4. South Korea
- 5.5. ASEAN
- 5.6. Oceania
- 5.7. Rest of Asia Pacific
Single Outputs DC Power Supply REPORT HIGHLIGHTS
| Aspects | Details |
|---|---|
| Study Period | 2019-2033 |
| Base Year | 2024 |
| Estimated Year | 2025 |
| Forecast Period | 2025-2033 |
| Historical Period | 2019-2024 |
| Growth Rate | CAGR of XX% from 2019-2033 |
| Segmentation |
|
Table of Contents
- 1. Introduction
- 1.1. Research Scope
- 1.2. Market Segmentation
- 1.3. Research Methodology
- 1.4. Definitions and Assumptions
- 2. Executive Summary
- 2.1. Introduction
- 3. Market Dynamics
- 3.1. Introduction
- 3.2. Market Drivers
- 3.3. Market Restrains
- 3.4. Market Trends
- 4. Market Factor Analysis
- 4.1. Porters Five Forces
- 4.2. Supply/Value Chain
- 4.3. PESTEL analysis
- 4.4. Market Entropy
- 4.5. Patent/Trademark Analysis
- 5. Global Single Outputs DC Power Supply Analysis, Insights and Forecast, 2019-2031
- 5.1. Market Analysis, Insights and Forecast - by Application
- 5.1.1. Automotive
- 5.1.2. Semiconductor Fabrication
- 5.1.3. Industrial
- 5.1.4. Medical
- 5.1.5. Universities and laboratories
- 5.1.6. Others
- 5.2. Market Analysis, Insights and Forecast - by Types
- 5.2.1. Fixed Output Voltage DC Power Supply
- 5.2.2. Adjustable Output Voltage DC Power Supply
- 5.3. Market Analysis, Insights and Forecast - by Region
- 5.3.1. North America
- 5.3.2. South America
- 5.3.3. Europe
- 5.3.4. Middle East & Africa
- 5.3.5. Asia Pacific
- 5.1. Market Analysis, Insights and Forecast - by Application
- 6. North America Single Outputs DC Power Supply Analysis, Insights and Forecast, 2019-2031
- 6.1. Market Analysis, Insights and Forecast - by Application
- 6.1.1. Automotive
- 6.1.2. Semiconductor Fabrication
- 6.1.3. Industrial
- 6.1.4. Medical
- 6.1.5. Universities and laboratories
- 6.1.6. Others
- 6.2. Market Analysis, Insights and Forecast - by Types
- 6.2.1. Fixed Output Voltage DC Power Supply
- 6.2.2. Adjustable Output Voltage DC Power Supply
- 6.1. Market Analysis, Insights and Forecast - by Application
- 7. South America Single Outputs DC Power Supply Analysis, Insights and Forecast, 2019-2031
- 7.1. Market Analysis, Insights and Forecast - by Application
- 7.1.1. Automotive
- 7.1.2. Semiconductor Fabrication
- 7.1.3. Industrial
- 7.1.4. Medical
- 7.1.5. Universities and laboratories
- 7.1.6. Others
- 7.2. Market Analysis, Insights and Forecast - by Types
- 7.2.1. Fixed Output Voltage DC Power Supply
- 7.2.2. Adjustable Output Voltage DC Power Supply
- 7.1. Market Analysis, Insights and Forecast - by Application
- 8. Europe Single Outputs DC Power Supply Analysis, Insights and Forecast, 2019-2031
- 8.1. Market Analysis, Insights and Forecast - by Application
- 8.1.1. Automotive
- 8.1.2. Semiconductor Fabrication
- 8.1.3. Industrial
- 8.1.4. Medical
- 8.1.5. Universities and laboratories
- 8.1.6. Others
- 8.2. Market Analysis, Insights and Forecast - by Types
- 8.2.1. Fixed Output Voltage DC Power Supply
- 8.2.2. Adjustable Output Voltage DC Power Supply
- 8.1. Market Analysis, Insights and Forecast - by Application
- 9. Middle East & Africa Single Outputs DC Power Supply Analysis, Insights and Forecast, 2019-2031
- 9.1. Market Analysis, Insights and Forecast - by Application
- 9.1.1. Automotive
- 9.1.2. Semiconductor Fabrication
- 9.1.3. Industrial
- 9.1.4. Medical
- 9.1.5. Universities and laboratories
- 9.1.6. Others
- 9.2. Market Analysis, Insights and Forecast - by Types
- 9.2.1. Fixed Output Voltage DC Power Supply
- 9.2.2. Adjustable Output Voltage DC Power Supply
- 9.1. Market Analysis, Insights and Forecast - by Application
- 10. Asia Pacific Single Outputs DC Power Supply Analysis, Insights and Forecast, 2019-2031
- 10.1. Market Analysis, Insights and Forecast - by Application
- 10.1.1. Automotive
- 10.1.2. Semiconductor Fabrication
- 10.1.3. Industrial
- 10.1.4. Medical
- 10.1.5. Universities and laboratories
- 10.1.6. Others
- 10.2. Market Analysis, Insights and Forecast - by Types
- 10.2.1. Fixed Output Voltage DC Power Supply
- 10.2.2. Adjustable Output Voltage DC Power Supply
- 10.1. Market Analysis, Insights and Forecast - by Application
- 11. Competitive Analysis
- 11.1. Global Market Share Analysis 2024
- 11.2. Company Profiles
- 11.2.1 AMETEK
- 11.2.1.1. Overview
- 11.2.1.2. Products
- 11.2.1.3. SWOT Analysis
- 11.2.1.4. Recent Developments
- 11.2.1.5. Financials (Based on Availability)
- 11.2.2 KEYSIGHT
- 11.2.2.1. Overview
- 11.2.2.2. Products
- 11.2.2.3. SWOT Analysis
- 11.2.2.4. Recent Developments
- 11.2.2.5. Financials (Based on Availability)
- 11.2.3 Advanced Energy
- 11.2.3.1. Overview
- 11.2.3.2. Products
- 11.2.3.3. SWOT Analysis
- 11.2.3.4. Recent Developments
- 11.2.3.5. Financials (Based on Availability)
- 11.2.4 Chroma Systems Solutions
- 11.2.4.1. Overview
- 11.2.4.2. Products
- 11.2.4.3. SWOT Analysis
- 11.2.4.4. Recent Developments
- 11.2.4.5. Financials (Based on Availability)
- 11.2.5 TDK-Lambda
- 11.2.5.1. Overview
- 11.2.5.2. Products
- 11.2.5.3. SWOT Analysis
- 11.2.5.4. Recent Developments
- 11.2.5.5. Financials (Based on Availability)
- 11.2.6 Delta Electronics
- 11.2.6.1. Overview
- 11.2.6.2. Products
- 11.2.6.3. SWOT Analysis
- 11.2.6.4. Recent Developments
- 11.2.6.5. Financials (Based on Availability)
- 11.2.7 Inc.
- 11.2.7.1. Overview
- 11.2.7.2. Products
- 11.2.7.3. SWOT Analysis
- 11.2.7.4. Recent Developments
- 11.2.7.5. Financials (Based on Availability)
- 11.2.8 XP Power
- 11.2.8.1. Overview
- 11.2.8.2. Products
- 11.2.8.3. SWOT Analysis
- 11.2.8.4. Recent Developments
- 11.2.8.5. Financials (Based on Availability)
- 11.2.9 National Instruments Corporation
- 11.2.9.1. Overview
- 11.2.9.2. Products
- 11.2.9.3. SWOT Analysis
- 11.2.9.4. Recent Developments
- 11.2.9.5. Financials (Based on Availability)
- 11.2.10 Tektronix
- 11.2.10.1. Overview
- 11.2.10.2. Products
- 11.2.10.3. SWOT Analysis
- 11.2.10.4. Recent Developments
- 11.2.10.5. Financials (Based on Availability)
- 11.2.11 EA Elektro-Automatik
- 11.2.11.1. Overview
- 11.2.11.2. Products
- 11.2.11.3. SWOT Analysis
- 11.2.11.4. Recent Developments
- 11.2.11.5. Financials (Based on Availability)
- 11.2.12 Matsusada Precision
- 11.2.12.1. Overview
- 11.2.12.2. Products
- 11.2.12.3. SWOT Analysis
- 11.2.12.4. Recent Developments
- 11.2.12.5. Financials (Based on Availability)
- 11.2.13 Magna-Power
- 11.2.13.1. Overview
- 11.2.13.2. Products
- 11.2.13.3. SWOT Analysis
- 11.2.13.4. Recent Developments
- 11.2.13.5. Financials (Based on Availability)
- 11.2.14 B&K Precision Corporation
- 11.2.14.1. Overview
- 11.2.14.2. Products
- 11.2.14.3. SWOT Analysis
- 11.2.14.4. Recent Developments
- 11.2.14.5. Financials (Based on Availability)
- 11.2.15 Good Will Instrument Co.
- 11.2.15.1. Overview
- 11.2.15.2. Products
- 11.2.15.3. SWOT Analysis
- 11.2.15.4. Recent Developments
- 11.2.15.5. Financials (Based on Availability)
- 11.2.16 Ltd
- 11.2.16.1. Overview
- 11.2.16.2. Products
- 11.2.16.3. SWOT Analysis
- 11.2.16.4. Recent Developments
- 11.2.16.5. Financials (Based on Availability)
- 11.2.17 Scientech Technologies
- 11.2.17.1. Overview
- 11.2.17.2. Products
- 11.2.17.3. SWOT Analysis
- 11.2.17.4. Recent Developments
- 11.2.17.5. Financials (Based on Availability)
- 11.2.18 RIGOL TECHNOLOGIES
- 11.2.18.1. Overview
- 11.2.18.2. Products
- 11.2.18.3. SWOT Analysis
- 11.2.18.4. Recent Developments
- 11.2.18.5. Financials (Based on Availability)
- 11.2.19 INC.
- 11.2.19.1. Overview
- 11.2.19.2. Products
- 11.2.19.3. SWOT Analysis
- 11.2.19.4. Recent Developments
- 11.2.19.5. Financials (Based on Availability)
- 11.2.20 Aim-Tti
- 11.2.20.1. Overview
- 11.2.20.2. Products
- 11.2.20.3. SWOT Analysis
- 11.2.20.4. Recent Developments
- 11.2.20.5. Financials (Based on Availability)
- 11.2.21 Preen
- 11.2.21.1. Overview
- 11.2.21.2. Products
- 11.2.21.3. SWOT Analysis
- 11.2.21.4. Recent Developments
- 11.2.21.5. Financials (Based on Availability)
- 11.2.1 AMETEK
List of Figures
- Figure 1: Global Single Outputs DC Power Supply Revenue Breakdown (million, %) by Region 2024 & 2032
- Figure 2: Global Single Outputs DC Power Supply Volume Breakdown (K, %) by Region 2024 & 2032
- Figure 3: North America Single Outputs DC Power Supply Revenue (million), by Application 2024 & 2032
- Figure 4: North America Single Outputs DC Power Supply Volume (K), by Application 2024 & 2032
- Figure 5: North America Single Outputs DC Power Supply Revenue Share (%), by Application 2024 & 2032
- Figure 6: North America Single Outputs DC Power Supply Volume Share (%), by Application 2024 & 2032
- Figure 7: North America Single Outputs DC Power Supply Revenue (million), by Types 2024 & 2032
- Figure 8: North America Single Outputs DC Power Supply Volume (K), by Types 2024 & 2032
- Figure 9: North America Single Outputs DC Power Supply Revenue Share (%), by Types 2024 & 2032
- Figure 10: North America Single Outputs DC Power Supply Volume Share (%), by Types 2024 & 2032
- Figure 11: North America Single Outputs DC Power Supply Revenue (million), by Country 2024 & 2032
- Figure 12: North America Single Outputs DC Power Supply Volume (K), by Country 2024 & 2032
- Figure 13: North America Single Outputs DC Power Supply Revenue Share (%), by Country 2024 & 2032
- Figure 14: North America Single Outputs DC Power Supply Volume Share (%), by Country 2024 & 2032
- Figure 15: South America Single Outputs DC Power Supply Revenue (million), by Application 2024 & 2032
- Figure 16: South America Single Outputs DC Power Supply Volume (K), by Application 2024 & 2032
- Figure 17: South America Single Outputs DC Power Supply Revenue Share (%), by Application 2024 & 2032
- Figure 18: South America Single Outputs DC Power Supply Volume Share (%), by Application 2024 & 2032
- Figure 19: South America Single Outputs DC Power Supply Revenue (million), by Types 2024 & 2032
- Figure 20: South America Single Outputs DC Power Supply Volume (K), by Types 2024 & 2032
- Figure 21: South America Single Outputs DC Power Supply Revenue Share (%), by Types 2024 & 2032
- Figure 22: South America Single Outputs DC Power Supply Volume Share (%), by Types 2024 & 2032
- Figure 23: South America Single Outputs DC Power Supply Revenue (million), by Country 2024 & 2032
- Figure 24: South America Single Outputs DC Power Supply Volume (K), by Country 2024 & 2032
- Figure 25: South America Single Outputs DC Power Supply Revenue Share (%), by Country 2024 & 2032
- Figure 26: South America Single Outputs DC Power Supply Volume Share (%), by Country 2024 & 2032
- Figure 27: Europe Single Outputs DC Power Supply Revenue (million), by Application 2024 & 2032
- Figure 28: Europe Single Outputs DC Power Supply Volume (K), by Application 2024 & 2032
- Figure 29: Europe Single Outputs DC Power Supply Revenue Share (%), by Application 2024 & 2032
- Figure 30: Europe Single Outputs DC Power Supply Volume Share (%), by Application 2024 & 2032
- Figure 31: Europe Single Outputs DC Power Supply Revenue (million), by Types 2024 & 2032
- Figure 32: Europe Single Outputs DC Power Supply Volume (K), by Types 2024 & 2032
- Figure 33: Europe Single Outputs DC Power Supply Revenue Share (%), by Types 2024 & 2032
- Figure 34: Europe Single Outputs DC Power Supply Volume Share (%), by Types 2024 & 2032
- Figure 35: Europe Single Outputs DC Power Supply Revenue (million), by Country 2024 & 2032
- Figure 36: Europe Single Outputs DC Power Supply Volume (K), by Country 2024 & 2032
- Figure 37: Europe Single Outputs DC Power Supply Revenue Share (%), by Country 2024 & 2032
- Figure 38: Europe Single Outputs DC Power Supply Volume Share (%), by Country 2024 & 2032
- Figure 39: Middle East & Africa Single Outputs DC Power Supply Revenue (million), by Application 2024 & 2032
- Figure 40: Middle East & Africa Single Outputs DC Power Supply Volume (K), by Application 2024 & 2032
- Figure 41: Middle East & Africa Single Outputs DC Power Supply Revenue Share (%), by Application 2024 & 2032
- Figure 42: Middle East & Africa Single Outputs DC Power Supply Volume Share (%), by Application 2024 & 2032
- Figure 43: Middle East & Africa Single Outputs DC Power Supply Revenue (million), by Types 2024 & 2032
- Figure 44: Middle East & Africa Single Outputs DC Power Supply Volume (K), by Types 2024 & 2032
- Figure 45: Middle East & Africa Single Outputs DC Power Supply Revenue Share (%), by Types 2024 & 2032
- Figure 46: Middle East & Africa Single Outputs DC Power Supply Volume Share (%), by Types 2024 & 2032
- Figure 47: Middle East & Africa Single Outputs DC Power Supply Revenue (million), by Country 2024 & 2032
- Figure 48: Middle East & Africa Single Outputs DC Power Supply Volume (K), by Country 2024 & 2032
- Figure 49: Middle East & Africa Single Outputs DC Power Supply Revenue Share (%), by Country 2024 & 2032
- Figure 50: Middle East & Africa Single Outputs DC Power Supply Volume Share (%), by Country 2024 & 2032
- Figure 51: Asia Pacific Single Outputs DC Power Supply Revenue (million), by Application 2024 & 2032
- Figure 52: Asia Pacific Single Outputs DC Power Supply Volume (K), by Application 2024 & 2032
- Figure 53: Asia Pacific Single Outputs DC Power Supply Revenue Share (%), by Application 2024 & 2032
- Figure 54: Asia Pacific Single Outputs DC Power Supply Volume Share (%), by Application 2024 & 2032
- Figure 55: Asia Pacific Single Outputs DC Power Supply Revenue (million), by Types 2024 & 2032
- Figure 56: Asia Pacific Single Outputs DC Power Supply Volume (K), by Types 2024 & 2032
- Figure 57: Asia Pacific Single Outputs DC Power Supply Revenue Share (%), by Types 2024 & 2032
- Figure 58: Asia Pacific Single Outputs DC Power Supply Volume Share (%), by Types 2024 & 2032
- Figure 59: Asia Pacific Single Outputs DC Power Supply Revenue (million), by Country 2024 & 2032
- Figure 60: Asia Pacific Single Outputs DC Power Supply Volume (K), by Country 2024 & 2032
- Figure 61: Asia Pacific Single Outputs DC Power Supply Revenue Share (%), by Country 2024 & 2032
- Figure 62: Asia Pacific Single Outputs DC Power Supply Volume Share (%), by Country 2024 & 2032
List of Tables
- Table 1: Global Single Outputs DC Power Supply Revenue million Forecast, by Region 2019 & 2032
- Table 2: Global Single Outputs DC Power Supply Volume K Forecast, by Region 2019 & 2032
- Table 3: Global Single Outputs DC Power Supply Revenue million Forecast, by Application 2019 & 2032
- Table 4: Global Single Outputs DC Power Supply Volume K Forecast, by Application 2019 & 2032
- Table 5: Global Single Outputs DC Power Supply Revenue million Forecast, by Types 2019 & 2032
- Table 6: Global Single Outputs DC Power Supply Volume K Forecast, by Types 2019 & 2032
- Table 7: Global Single Outputs DC Power Supply Revenue million Forecast, by Region 2019 & 2032
- Table 8: Global Single Outputs DC Power Supply Volume K Forecast, by Region 2019 & 2032
- Table 9: Global Single Outputs DC Power Supply Revenue million Forecast, by Application 2019 & 2032
- Table 10: Global Single Outputs DC Power Supply Volume K Forecast, by Application 2019 & 2032
- Table 11: Global Single Outputs DC Power Supply Revenue million Forecast, by Types 2019 & 2032
- Table 12: Global Single Outputs DC Power Supply Volume K Forecast, by Types 2019 & 2032
- Table 13: Global Single Outputs DC Power Supply Revenue million Forecast, by Country 2019 & 2032
- Table 14: Global Single Outputs DC Power Supply Volume K Forecast, by Country 2019 & 2032
- Table 15: United States Single Outputs DC Power Supply Revenue (million) Forecast, by Application 2019 & 2032
- Table 16: United States Single Outputs DC Power Supply Volume (K) Forecast, by Application 2019 & 2032
- Table 17: Canada Single Outputs DC Power Supply Revenue (million) Forecast, by Application 2019 & 2032
- Table 18: Canada Single Outputs DC Power Supply Volume (K) Forecast, by Application 2019 & 2032
- Table 19: Mexico Single Outputs DC Power Supply Revenue (million) Forecast, by Application 2019 & 2032
- Table 20: Mexico Single Outputs DC Power Supply Volume (K) Forecast, by Application 2019 & 2032
- Table 21: Global Single Outputs DC Power Supply Revenue million Forecast, by Application 2019 & 2032
- Table 22: Global Single Outputs DC Power Supply Volume K Forecast, by Application 2019 & 2032
- Table 23: Global Single Outputs DC Power Supply Revenue million Forecast, by Types 2019 & 2032
- Table 24: Global Single Outputs DC Power Supply Volume K Forecast, by Types 2019 & 2032
- Table 25: Global Single Outputs DC Power Supply Revenue million Forecast, by Country 2019 & 2032
- Table 26: Global Single Outputs DC Power Supply Volume K Forecast, by Country 2019 & 2032
- Table 27: Brazil Single Outputs DC Power Supply Revenue (million) Forecast, by Application 2019 & 2032
- Table 28: Brazil Single Outputs DC Power Supply Volume (K) Forecast, by Application 2019 & 2032
- Table 29: Argentina Single Outputs DC Power Supply Revenue (million) Forecast, by Application 2019 & 2032
- Table 30: Argentina Single Outputs DC Power Supply Volume (K) Forecast, by Application 2019 & 2032
- Table 31: Rest of South America Single Outputs DC Power Supply Revenue (million) Forecast, by Application 2019 & 2032
- Table 32: Rest of South America Single Outputs DC Power Supply Volume (K) Forecast, by Application 2019 & 2032
- Table 33: Global Single Outputs DC Power Supply Revenue million Forecast, by Application 2019 & 2032
- Table 34: Global Single Outputs DC Power Supply Volume K Forecast, by Application 2019 & 2032
- Table 35: Global Single Outputs DC Power Supply Revenue million Forecast, by Types 2019 & 2032
- Table 36: Global Single Outputs DC Power Supply Volume K Forecast, by Types 2019 & 2032
- Table 37: Global Single Outputs DC Power Supply Revenue million Forecast, by Country 2019 & 2032
- Table 38: Global Single Outputs DC Power Supply Volume K Forecast, by Country 2019 & 2032
- Table 39: United Kingdom Single Outputs DC Power Supply Revenue (million) Forecast, by Application 2019 & 2032
- Table 40: United Kingdom Single Outputs DC Power Supply Volume (K) Forecast, by Application 2019 & 2032
- Table 41: Germany Single Outputs DC Power Supply Revenue (million) Forecast, by Application 2019 & 2032
- Table 42: Germany Single Outputs DC Power Supply Volume (K) Forecast, by Application 2019 & 2032
- Table 43: France Single Outputs DC Power Supply Revenue (million) Forecast, by Application 2019 & 2032
- Table 44: France Single Outputs DC Power Supply Volume (K) Forecast, by Application 2019 & 2032
- Table 45: Italy Single Outputs DC Power Supply Revenue (million) Forecast, by Application 2019 & 2032
- Table 46: Italy Single Outputs DC Power Supply Volume (K) Forecast, by Application 2019 & 2032
- Table 47: Spain Single Outputs DC Power Supply Revenue (million) Forecast, by Application 2019 & 2032
- Table 48: Spain Single Outputs DC Power Supply Volume (K) Forecast, by Application 2019 & 2032
- Table 49: Russia Single Outputs DC Power Supply Revenue (million) Forecast, by Application 2019 & 2032
- Table 50: Russia Single Outputs DC Power Supply Volume (K) Forecast, by Application 2019 & 2032
- Table 51: Benelux Single Outputs DC Power Supply Revenue (million) Forecast, by Application 2019 & 2032
- Table 52: Benelux Single Outputs DC Power Supply Volume (K) Forecast, by Application 2019 & 2032
- Table 53: Nordics Single Outputs DC Power Supply Revenue (million) Forecast, by Application 2019 & 2032
- Table 54: Nordics Single Outputs DC Power Supply Volume (K) Forecast, by Application 2019 & 2032
- Table 55: Rest of Europe Single Outputs DC Power Supply Revenue (million) Forecast, by Application 2019 & 2032
- Table 56: Rest of Europe Single Outputs DC Power Supply Volume (K) Forecast, by Application 2019 & 2032
- Table 57: Global Single Outputs DC Power Supply Revenue million Forecast, by Application 2019 & 2032
- Table 58: Global Single Outputs DC Power Supply Volume K Forecast, by Application 2019 & 2032
- Table 59: Global Single Outputs DC Power Supply Revenue million Forecast, by Types 2019 & 2032
- Table 60: Global Single Outputs DC Power Supply Volume K Forecast, by Types 2019 & 2032
- Table 61: Global Single Outputs DC Power Supply Revenue million Forecast, by Country 2019 & 2032
- Table 62: Global Single Outputs DC Power Supply Volume K Forecast, by Country 2019 & 2032
- Table 63: Turkey Single Outputs DC Power Supply Revenue (million) Forecast, by Application 2019 & 2032
- Table 64: Turkey Single Outputs DC Power Supply Volume (K) Forecast, by Application 2019 & 2032
- Table 65: Israel Single Outputs DC Power Supply Revenue (million) Forecast, by Application 2019 & 2032
- Table 66: Israel Single Outputs DC Power Supply Volume (K) Forecast, by Application 2019 & 2032
- Table 67: GCC Single Outputs DC Power Supply Revenue (million) Forecast, by Application 2019 & 2032
- Table 68: GCC Single Outputs DC Power Supply Volume (K) Forecast, by Application 2019 & 2032
- Table 69: North Africa Single Outputs DC Power Supply Revenue (million) Forecast, by Application 2019 & 2032
- Table 70: North Africa Single Outputs DC Power Supply Volume (K) Forecast, by Application 2019 & 2032
- Table 71: South Africa Single Outputs DC Power Supply Revenue (million) Forecast, by Application 2019 & 2032
- Table 72: South Africa Single Outputs DC Power Supply Volume (K) Forecast, by Application 2019 & 2032
- Table 73: Rest of Middle East & Africa Single Outputs DC Power Supply Revenue (million) Forecast, by Application 2019 & 2032
- Table 74: Rest of Middle East & Africa Single Outputs DC Power Supply Volume (K) Forecast, by Application 2019 & 2032
- Table 75: Global Single Outputs DC Power Supply Revenue million Forecast, by Application 2019 & 2032
- Table 76: Global Single Outputs DC Power Supply Volume K Forecast, by Application 2019 & 2032
- Table 77: Global Single Outputs DC Power Supply Revenue million Forecast, by Types 2019 & 2032
- Table 78: Global Single Outputs DC Power Supply Volume K Forecast, by Types 2019 & 2032
- Table 79: Global Single Outputs DC Power Supply Revenue million Forecast, by Country 2019 & 2032
- Table 80: Global Single Outputs DC Power Supply Volume K Forecast, by Country 2019 & 2032
- Table 81: China Single Outputs DC Power Supply Revenue (million) Forecast, by Application 2019 & 2032
- Table 82: China Single Outputs DC Power Supply Volume (K) Forecast, by Application 2019 & 2032
- Table 83: India Single Outputs DC Power Supply Revenue (million) Forecast, by Application 2019 & 2032
- Table 84: India Single Outputs DC Power Supply Volume (K) Forecast, by Application 2019 & 2032
- Table 85: Japan Single Outputs DC Power Supply Revenue (million) Forecast, by Application 2019 & 2032
- Table 86: Japan Single Outputs DC Power Supply Volume (K) Forecast, by Application 2019 & 2032
- Table 87: South Korea Single Outputs DC Power Supply Revenue (million) Forecast, by Application 2019 & 2032
- Table 88: South Korea Single Outputs DC Power Supply Volume (K) Forecast, by Application 2019 & 2032
- Table 89: ASEAN Single Outputs DC Power Supply Revenue (million) Forecast, by Application 2019 & 2032
- Table 90: ASEAN Single Outputs DC Power Supply Volume (K) Forecast, by Application 2019 & 2032
- Table 91: Oceania Single Outputs DC Power Supply Revenue (million) Forecast, by Application 2019 & 2032
- Table 92: Oceania Single Outputs DC Power Supply Volume (K) Forecast, by Application 2019 & 2032
- Table 93: Rest of Asia Pacific Single Outputs DC Power Supply Revenue (million) Forecast, by Application 2019 & 2032
- Table 94: Rest of Asia Pacific Single Outputs DC Power Supply Volume (K) Forecast, by Application 2019 & 2032
Frequently Asked Questions
1. What is the projected Compound Annual Growth Rate (CAGR) of the Single Outputs DC Power Supply?
The projected CAGR is approximately XX%.
2. Which companies are prominent players in the Single Outputs DC Power Supply?
Key companies in the market include AMETEK, KEYSIGHT, Advanced Energy, Chroma Systems Solutions, TDK-Lambda, Delta Electronics, Inc., XP Power, National Instruments Corporation, Tektronix, EA Elektro-Automatik, Matsusada Precision, Magna-Power, B&K Precision Corporation, Good Will Instrument Co., Ltd, Scientech Technologies, RIGOL TECHNOLOGIES, INC., Aim-Tti, Preen.
3. What are the main segments of the Single Outputs DC Power Supply?
The market segments include Application, Types.
4. Can you provide details about the market size?
The market size is estimated to be USD XXX million as of 2022.
5. What are some drivers contributing to market growth?
N/A
6. What are the notable trends driving market growth?
N/A
7. Are there any restraints impacting market growth?
N/A
8. Can you provide examples of recent developments in the market?
N/A
9. What pricing options are available for accessing the report?
Pricing options include single-user, multi-user, and enterprise licenses priced at USD 4350.00, USD 6525.00, and USD 8700.00 respectively.
10. Is the market size provided in terms of value or volume?
The market size is provided in terms of value, measured in million and volume, measured in K.
11. Are there any specific market keywords associated with the report?
Yes, the market keyword associated with the report is "Single Outputs DC Power Supply," which aids in identifying and referencing the specific market segment covered.
12. How do I determine which pricing option suits my needs best?
The pricing options vary based on user requirements and access needs. Individual users may opt for single-user licenses, while businesses requiring broader access may choose multi-user or enterprise licenses for cost-effective access to the report.
13. Are there any additional resources or data provided in the Single Outputs DC Power Supply report?
While the report offers comprehensive insights, it's advisable to review the specific contents or supplementary materials provided to ascertain if additional resources or data are available.
14. How can I stay updated on further developments or reports in the Single Outputs DC Power Supply?
To stay informed about further developments, trends, and reports in the Single Outputs DC Power Supply, consider subscribing to industry newsletters, following relevant companies and organizations, or regularly checking reputable industry news sources and publications.
Methodology
Step 1 - Identification of Relevant Samples Size from Population Database


Step 2 - Approaches for Defining Global Market Size (Value, Volume* & Price*)

Note*: In applicable scenarios
Step 3 - Data Sources
Primary Research
- Web Analytics
- Survey Reports
- Research Institute
- Latest Research Reports
- Opinion Leaders
Secondary Research
- Annual Reports
- White Paper
- Latest Press Release
- Industry Association
- Paid Database
- Investor Presentations

Step 4 - Data Triangulation
Involves using different sources of information in order to increase the validity of a study
These sources are likely to be stakeholders in a program - participants, other researchers, program staff, other community members, and so on.
Then we put all data in single framework & apply various statistical tools to find out the dynamic on the market.
During the analysis stage, feedback from the stakeholder groups would be compared to determine areas of agreement as well as areas of divergence
