

Key Insights
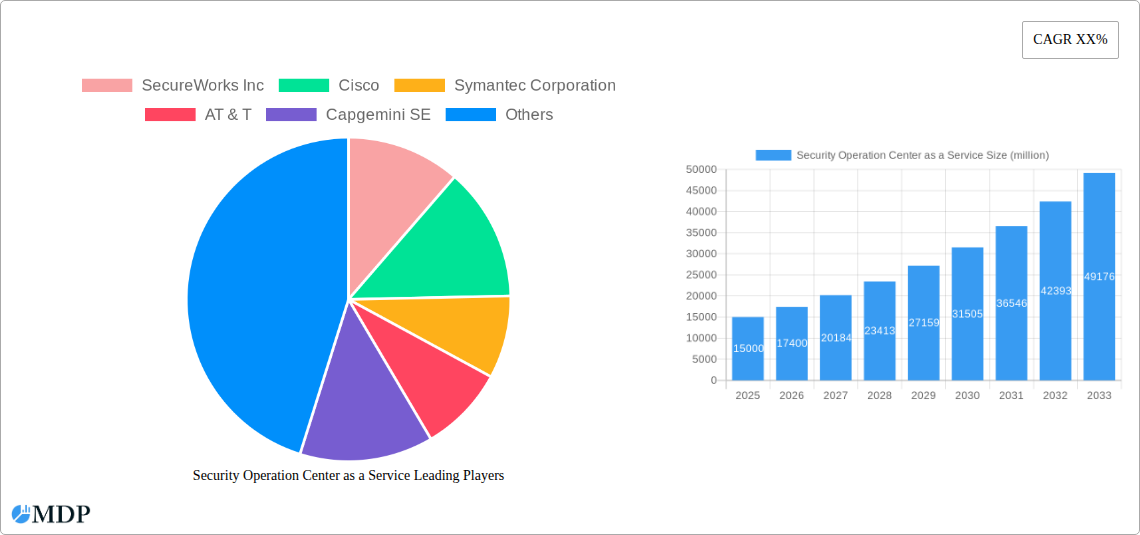
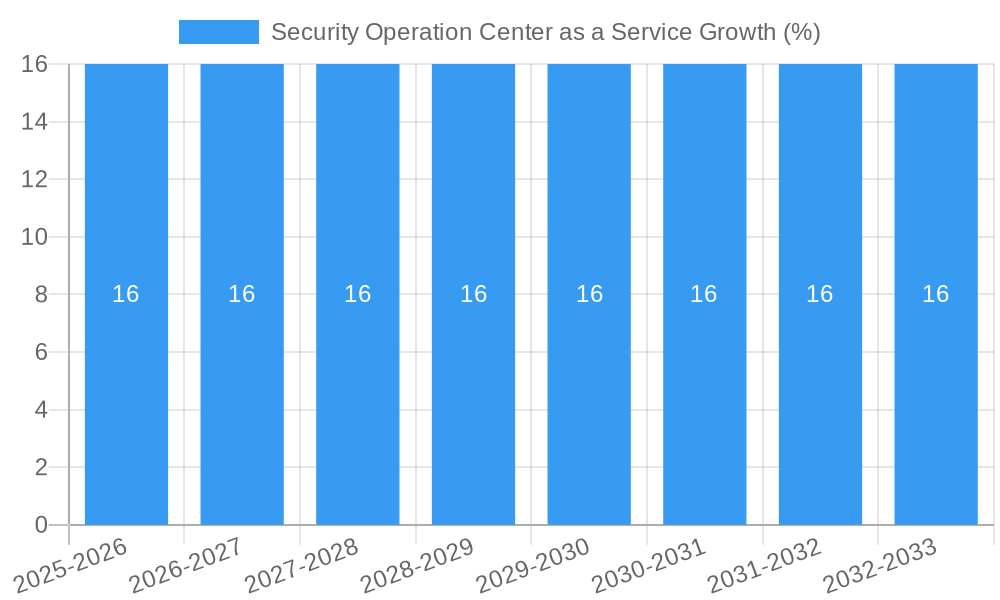
The global Security Operation Center (SOC) as a Service market is poised for substantial growth, driven by the escalating sophistication and volume of cyber threats, coupled with the persistent cybersecurity talent shortage. With a projected market size of approximately USD 15,000 million in 2025 and an estimated Compound Annual Growth Rate (CAGR) of 16%, the market is expected to reach a significant valuation by 2033. This robust expansion is fueled by organizations across diverse sectors, including Telecommunication, Banking, Financial Services, and Insurance (BFSI), and Pharmaceuticals, recognizing the critical need for advanced threat detection, response, and continuous monitoring capabilities. The inherent complexity of modern IT infrastructures and the ever-evolving attack vectors necessitate specialized expertise and advanced technological solutions, which SOC as a Service providers deliver efficiently and cost-effectively. The shift towards cloud-based services further amplifies the adoption of SaaS and PaaS models, enabling greater scalability, flexibility, and accessibility for businesses of all sizes.
Key drivers for this market surge include the increasing regulatory compliance demands, the growing adoption of remote work models, and the expanding attack surface due to the proliferation of IoT devices and cloud services. However, the market also faces certain restraints, such as concerns regarding data privacy and intellectual property during service outsourcing, and the initial investment costs for integration and migration for some organizations. Despite these challenges, the market is witnessing significant trends like the rise of AI and machine learning in threat intelligence and automated response, the growing demand for specialized cybersecurity services like threat hunting and incident response, and the increasing preference for integrated security solutions that offer a holistic approach to cybersecurity. Leading players like SecureWorks Inc., Cisco, Symantec Corporation, and AT&T are actively innovating and expanding their offerings to cater to the dynamic needs of the global market, with a strong presence observed in North America and Europe, while Asia Pacific emerges as a high-growth region.
Security Operation Center as a Service Market Dynamics & Concentration
The global Security Operation Center as a Service (SOCaaS) market exhibits a dynamic and moderately concentrated landscape, driven by an escalating threat landscape and the increasing complexity of cybersecurity challenges. Major players like SecureWorks Inc., Cisco, and Symantec Corporation hold significant market share, while emerging entities are carving out niches through specialized offerings. Innovation is predominantly fueled by advancements in AI and machine learning for threat detection, automated response capabilities, and the integration of Extended Detection and Response (XDR) solutions. Regulatory frameworks, such as GDPR and CCPA, are increasingly mandating robust data protection and incident response, further propelling SOCaaS adoption. Product substitutes, including in-house SOC solutions and Managed Security Service Providers (MSSPs) without a dedicated SOCaaS model, offer alternative but often less scalable and cost-effective options. End-user trends highlight a growing preference for cloud-native SOCaaS solutions, offering greater flexibility and reduced infrastructure overhead. Mergers and acquisitions (M&A) are a notable feature, with approximately xx million in deal counts observed, as larger cybersecurity firms aim to consolidate their portfolios and expand their service offerings to capture a larger share of the projected xx million market.
- Market Concentration: Moderately concentrated with a few dominant players.
- Innovation Drivers: AI/ML for threat detection, automated response, XDR integration.
- Regulatory Frameworks: GDPR, CCPA driving demand for compliance.
- Product Substitutes: In-house SOC, traditional MSSPs.
- End-User Trends: Shift towards cloud-native SOCaaS.
- M&A Activities: Indicative of market consolidation and strategic expansion.
Security Operation Center as a Service Industry Trends & Analysis
The Security Operation Center as a Service (SOCaaS) industry is experiencing robust growth, projected to expand at a Compound Annual Growth Rate (CAGR) of xx% from 2019 to 2033. This surge is propelled by several interconnected trends. Firstly, the sheer volume and sophistication of cyber threats are escalating, forcing organizations of all sizes to bolster their defenses beyond the capabilities of traditional, on-premises security solutions. Nation-state attacks, ransomware, and sophisticated phishing campaigns are becoming commonplace, necessitating 24/7 monitoring and rapid response. Secondly, technological disruptions are fundamentally reshaping the SOCaaS landscape. The widespread adoption of cloud computing and the proliferation of IoT devices have expanded the attack surface, creating a critical need for centralized, cloud-based security management. Furthermore, advancements in Artificial Intelligence (AI) and Machine Learning (ML) are revolutionizing threat detection and response. AI-powered analytics can process vast amounts of data to identify anomalies and predict potential threats with greater accuracy and speed than human analysts alone. This automation not only enhances efficiency but also addresses the persistent cybersecurity talent shortage. Consumer preferences are increasingly leaning towards managed and outsourced security solutions. Businesses, especially Small and Medium-sized Enterprises (SMEs) with limited IT budgets and in-house expertise, find SOCaaS to be a cost-effective and efficient way to achieve enterprise-grade security. The ability to scale services up or down based on evolving business needs is another significant draw. Competitive dynamics are characterized by intense innovation and strategic partnerships. Companies are differentiating themselves through specialized services, industry-specific compliance offerings, and the integration of advanced threat intelligence platforms. The market penetration of SOCaaS is steadily increasing, moving from a niche offering to a mainstream cybersecurity necessity. This analysis is supported by a projected market size of xx million by 2025, demonstrating a significant financial commitment to these services. The historical period from 2019 to 2024 has laid the groundwork, with increasing awareness and early adoption, setting the stage for the accelerated growth anticipated in the forecast period of 2025–2033.
Leading Markets & Segments in Security Operation Center as a Service
The global Security Operation Center as a Service (SOCaaS) market is dominated by the BFSI (Banking, Financial Services, and Insurance) segment, driven by the sector's high-value data, stringent regulatory compliance requirements, and a continuous barrage of sophisticated cyber threats. The sheer volume of sensitive financial information processed by BFSI institutions makes them prime targets for cybercriminals, necessitating a proactive and comprehensive security posture that SOCaaS effectively provides. Telecommunication and Pharmaceutical sectors also represent significant markets, each with unique security demands. The Telecommunication industry's reliance on vast, interconnected networks and the critical nature of its services make it a high-priority target. The Pharmaceutical sector, on the other hand, faces threats related to intellectual property theft and the integrity of clinical trial data.
Within the types of SOCaaS, Software as a Service (SaaS) holds a commanding position. This is primarily due to its scalability, flexibility, and lower upfront investment compared to Platform as a Service (PaaS) offerings. SaaS solutions allow businesses to access advanced security functionalities without the need for substantial infrastructure development or maintenance.
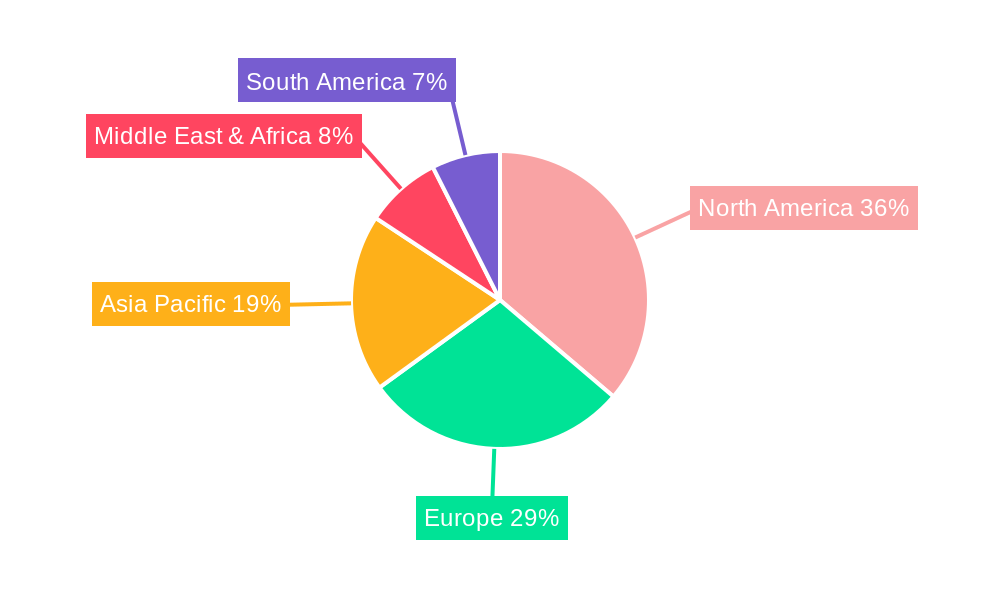
- Dominant Region: North America is a leading region due to its advanced technological infrastructure, high cybersecurity spending, and robust regulatory landscape.
- Dominant Country: The United States, within North America, leads in SOCaaS adoption and innovation.
- Dominant Application Segment:
- BFSI:
- Key Drivers: High-value data protection, stringent regulatory compliance (e.g., PCI DSS, SOX), increasing threat sophistication targeting financial assets.
- Dominance Analysis: Financial institutions are mandated to maintain near-perfect uptime and data integrity, making robust, real-time threat detection and rapid incident response crucial. The cost of a breach in BFSI can run into billions, making preventive SOCaaS investments highly attractive.
- Telecommunication:
- Key Drivers: Protection of critical infrastructure, customer data privacy, prevention of service disruption, compliance with telecommunication regulations.
- Dominance Analysis: The interconnected nature of telecommunication networks creates a large attack surface. Downtime can have widespread economic and social repercussions, necessitating advanced threat mitigation.
- Pharmaceutical:
- Key Drivers: Protection of intellectual property (drug formulations, research data), patient data security, ensuring data integrity in clinical trials, compliance with health data regulations (e.g., HIPAA).
- Dominance Analysis: The value of pharmaceutical R&D and patient data makes these organizations attractive targets for industrial espionage and data theft. Maintaining the integrity of drug development processes is paramount.
- Others: This segment encompasses a diverse range of industries including healthcare, government, retail, and manufacturing, each with growing cybersecurity needs.
- BFSI:
- Dominant Type:
- Software as a Service (SaaS):
- Key Drivers: Cost-effectiveness, rapid deployment, scalability, ease of access to advanced features, reduced IT overhead.
- Dominance Analysis: SaaS models democratize access to sophisticated SOC capabilities, allowing businesses of all sizes to leverage cutting-edge security without significant capital expenditure.
- Platform as a Service (PaaS):
- Key Drivers: Greater customization, integration with existing IT infrastructure, deeper control over security workflows.
- Dominance Analysis: PaaS offers more flexibility for enterprises with complex or highly specific security requirements, allowing them to build bespoke SOC solutions.
- Software as a Service (SaaS):
Security Operation Center as a Service Product Developments
The SOCaaS market is witnessing a wave of product developments focused on enhancing threat detection, automation, and integration. Innovations include AI-powered anomaly detection that moves beyond signature-based methods to identify novel threats in real-time. Extended Detection and Response (XDR) platforms are increasingly integrated into SOCaaS offerings, providing a unified view across endpoints, networks, cloud workloads, and email. This cross-telemetry approach enables faster incident correlation and response. Furthermore, advancements in SOAR (Security Orchestration, Automation, and Response) capabilities are automating routine tasks, freeing up human analysts for more complex investigations. The competitive advantage lies in offering a comprehensive, intelligent, and adaptive security solution that can scale with business needs.
Key Drivers of Security Operation Center as a Service Growth
Several key factors are driving the significant growth of the Security Operation Center as a Service (SOCaaS) market. The escalating frequency and sophistication of cyberattacks, including ransomware, phishing, and advanced persistent threats, necessitate round-the-clock monitoring and rapid response capabilities that SOCaaS provides. The increasing adoption of cloud computing and the proliferation of IoT devices expand the attack surface, creating a demand for centralized, scalable security solutions. Moreover, a persistent global shortage of skilled cybersecurity professionals makes outsourcing SOC functions to specialized providers an attractive and cost-effective alternative for many organizations. Regulatory compliance pressures, such as GDPR and CCPA, are also compelling businesses to invest in robust security measures and incident response frameworks, further boosting SOCaaS adoption.
- Technological Factors: AI/ML for advanced threat detection, XDR for unified visibility, SOAR for automation.
- Economic Factors: Cost-effectiveness of outsourcing compared to in-house SOC, reduced TCO for SMEs.
- Regulatory Factors: Stringent data protection laws and compliance mandates.
Challenges in the Security Operation Center as a Service Market
Despite its strong growth trajectory, the SOCaaS market faces several significant challenges that can impede adoption and operational effectiveness. A primary concern is the potential for vendor lock-in, where organizations become heavily reliant on a single SOCaaS provider, making it difficult and costly to switch if needs change or service quality degrades. Data privacy and sovereignty concerns are also paramount, particularly for organizations operating across multiple jurisdictions, as they must ensure their sensitive data is handled in compliance with all relevant regulations. The integration of SOCaaS solutions with existing, often complex, IT infrastructures can be a technically challenging and time-consuming process, requiring significant planning and expertise. Finally, the ongoing cybersecurity talent shortage, while a driver for SOCaaS adoption, also impacts the ability of providers themselves to attract and retain highly skilled security analysts necessary to deliver top-tier services.
- Vendor Lock-in: Risk of dependency on a single provider.
- Data Privacy & Sovereignty: Navigating complex global regulations.
- Integration Complexity: Challenges in merging with existing IT ecosystems.
- Talent Shortage: Impact on provider's ability to staff effectively.
Emerging Opportunities in Security Operation Center as a Service
The Security Operation Center as a Service (SOCaaS) market is ripe with emerging opportunities driven by technological advancements and evolving market demands. The integration of proactive threat hunting capabilities into SOCaaS offerings presents a significant opportunity, moving beyond reactive incident response to actively seeking out and neutralizing threats before they can cause damage. The rise of cyber insurance is also creating a new demand driver, as insurers increasingly require robust, outsourced security solutions to mitigate risk and reduce premiums. Furthermore, the expansion of SOCaaS into niche industries with specific compliance needs, such as healthcare (HIPAA) and manufacturing (OT security), offers substantial growth potential. Strategic partnerships between SOCaaS providers and cloud service providers, as well as cybersecurity technology vendors, will unlock new avenues for integrated solutions and expanded service portfolios.
Leading Players in the Security Operation Center as a Service Sector
- SecureWorks Inc.
- Cisco
- Symantec Corporation
- AT & T
- Capgemini SE
- BlackStratus Inc.
- NetMagic Solutions
- Cygilant Inc.
- Alert Logic Inc.
- Raytheon
- ESDS Software Solution Pvt. Ltd.
- Suma Soft
Key Milestones in Security Operation Center as a Service Industry
- 2019: Increased adoption of cloud-native SOCaaS solutions, driven by cost efficiencies and scalability.
- 2020: Emergence of AI/ML-powered threat detection as a core differentiator in SOCaaS offerings.
- 2021: Growth in XDR integration, providing a unified security telemetry across multiple security layers.
- 2022: Significant M&A activity as larger cybersecurity firms consolidate market share and expand service portfolios.
- 2023: Enhanced focus on automated incident response capabilities (SOAR) to address analyst shortages and improve efficiency.
- 2024: Growing demand for specialized SOCaaS catering to specific industry verticals and regulatory requirements.
Strategic Outlook for Security Operation Center as a Service Market
The strategic outlook for the Security Operation Center as a Service (SOCaaS) market is exceptionally positive, fueled by the persistent and evolving nature of cyber threats. Future growth will be accelerated by the continued integration of advanced artificial intelligence and machine learning for predictive threat intelligence and automated response. The expansion of SOCaaS offerings to encompass broader cybersecurity domains, including cloud security posture management and OT security, will unlock new revenue streams. Strategic partnerships with cloud providers and technology vendors will be crucial for delivering comprehensive, end-to-end security solutions. Furthermore, the increasing focus on compliance-driven security needs across various industries will solidify SOCaaS as an indispensable component of modern business resilience, with a projected market size reaching xx million by the end of the study period.
Security Operation Center as a Service Segmentation
-
1. Application
- 1.1. Telecommunication
- 1.2. BFSI
- 1.3. Pharmaceutical
- 1.4. Others
-
2. Types
- 2.1. Software as a Service
- 2.2. Platform as a Service
Security Operation Center as a Service Segmentation By Geography
-
1. North America
- 1.1. United States
- 1.2. Canada
- 1.3. Mexico
-
2. South America
- 2.1. Brazil
- 2.2. Argentina
- 2.3. Rest of South America
-
3. Europe
- 3.1. United Kingdom
- 3.2. Germany
- 3.3. France
- 3.4. Italy
- 3.5. Spain
- 3.6. Russia
- 3.7. Benelux
- 3.8. Nordics
- 3.9. Rest of Europe
-
4. Middle East & Africa
- 4.1. Turkey
- 4.2. Israel
- 4.3. GCC
- 4.4. North Africa
- 4.5. South Africa
- 4.6. Rest of Middle East & Africa
-
5. Asia Pacific
- 5.1. China
- 5.2. India
- 5.3. Japan
- 5.4. South Korea
- 5.5. ASEAN
- 5.6. Oceania
- 5.7. Rest of Asia Pacific
Security Operation Center as a Service REPORT HIGHLIGHTS
| Aspects | Details |
|---|---|
| Study Period | 2019-2033 |
| Base Year | 2024 |
| Estimated Year | 2025 |
| Forecast Period | 2025-2033 |
| Historical Period | 2019-2024 |
| Growth Rate | CAGR of XX% from 2019-2033 |
| Segmentation |
|
Table of Contents
- 1. Introduction
- 1.1. Research Scope
- 1.2. Market Segmentation
- 1.3. Research Methodology
- 1.4. Definitions and Assumptions
- 2. Executive Summary
- 2.1. Introduction
- 3. Market Dynamics
- 3.1. Introduction
- 3.2. Market Drivers
- 3.3. Market Restrains
- 3.4. Market Trends
- 4. Market Factor Analysis
- 4.1. Porters Five Forces
- 4.2. Supply/Value Chain
- 4.3. PESTEL analysis
- 4.4. Market Entropy
- 4.5. Patent/Trademark Analysis
- 5. Global Security Operation Center as a Service Analysis, Insights and Forecast, 2019-2031
- 5.1. Market Analysis, Insights and Forecast - by Application
- 5.1.1. Telecommunication
- 5.1.2. BFSI
- 5.1.3. Pharmaceutical
- 5.1.4. Others
- 5.2. Market Analysis, Insights and Forecast - by Types
- 5.2.1. Software as a Service
- 5.2.2. Platform as a Service
- 5.3. Market Analysis, Insights and Forecast - by Region
- 5.3.1. North America
- 5.3.2. South America
- 5.3.3. Europe
- 5.3.4. Middle East & Africa
- 5.3.5. Asia Pacific
- 5.1. Market Analysis, Insights and Forecast - by Application
- 6. North America Security Operation Center as a Service Analysis, Insights and Forecast, 2019-2031
- 6.1. Market Analysis, Insights and Forecast - by Application
- 6.1.1. Telecommunication
- 6.1.2. BFSI
- 6.1.3. Pharmaceutical
- 6.1.4. Others
- 6.2. Market Analysis, Insights and Forecast - by Types
- 6.2.1. Software as a Service
- 6.2.2. Platform as a Service
- 6.1. Market Analysis, Insights and Forecast - by Application
- 7. South America Security Operation Center as a Service Analysis, Insights and Forecast, 2019-2031
- 7.1. Market Analysis, Insights and Forecast - by Application
- 7.1.1. Telecommunication
- 7.1.2. BFSI
- 7.1.3. Pharmaceutical
- 7.1.4. Others
- 7.2. Market Analysis, Insights and Forecast - by Types
- 7.2.1. Software as a Service
- 7.2.2. Platform as a Service
- 7.1. Market Analysis, Insights and Forecast - by Application
- 8. Europe Security Operation Center as a Service Analysis, Insights and Forecast, 2019-2031
- 8.1. Market Analysis, Insights and Forecast - by Application
- 8.1.1. Telecommunication
- 8.1.2. BFSI
- 8.1.3. Pharmaceutical
- 8.1.4. Others
- 8.2. Market Analysis, Insights and Forecast - by Types
- 8.2.1. Software as a Service
- 8.2.2. Platform as a Service
- 8.1. Market Analysis, Insights and Forecast - by Application
- 9. Middle East & Africa Security Operation Center as a Service Analysis, Insights and Forecast, 2019-2031
- 9.1. Market Analysis, Insights and Forecast - by Application
- 9.1.1. Telecommunication
- 9.1.2. BFSI
- 9.1.3. Pharmaceutical
- 9.1.4. Others
- 9.2. Market Analysis, Insights and Forecast - by Types
- 9.2.1. Software as a Service
- 9.2.2. Platform as a Service
- 9.1. Market Analysis, Insights and Forecast - by Application
- 10. Asia Pacific Security Operation Center as a Service Analysis, Insights and Forecast, 2019-2031
- 10.1. Market Analysis, Insights and Forecast - by Application
- 10.1.1. Telecommunication
- 10.1.2. BFSI
- 10.1.3. Pharmaceutical
- 10.1.4. Others
- 10.2. Market Analysis, Insights and Forecast - by Types
- 10.2.1. Software as a Service
- 10.2.2. Platform as a Service
- 10.1. Market Analysis, Insights and Forecast - by Application
- 11. Competitive Analysis
- 11.1. Global Market Share Analysis 2024
- 11.2. Company Profiles
- 11.2.1 SecureWorks Inc
- 11.2.1.1. Overview
- 11.2.1.2. Products
- 11.2.1.3. SWOT Analysis
- 11.2.1.4. Recent Developments
- 11.2.1.5. Financials (Based on Availability)
- 11.2.2 Cisco
- 11.2.2.1. Overview
- 11.2.2.2. Products
- 11.2.2.3. SWOT Analysis
- 11.2.2.4. Recent Developments
- 11.2.2.5. Financials (Based on Availability)
- 11.2.3 Symantec Corporation
- 11.2.3.1. Overview
- 11.2.3.2. Products
- 11.2.3.3. SWOT Analysis
- 11.2.3.4. Recent Developments
- 11.2.3.5. Financials (Based on Availability)
- 11.2.4 AT & T
- 11.2.4.1. Overview
- 11.2.4.2. Products
- 11.2.4.3. SWOT Analysis
- 11.2.4.4. Recent Developments
- 11.2.4.5. Financials (Based on Availability)
- 11.2.5 Capgemini SE
- 11.2.5.1. Overview
- 11.2.5.2. Products
- 11.2.5.3. SWOT Analysis
- 11.2.5.4. Recent Developments
- 11.2.5.5. Financials (Based on Availability)
- 11.2.6 BlackStratus Inc
- 11.2.6.1. Overview
- 11.2.6.2. Products
- 11.2.6.3. SWOT Analysis
- 11.2.6.4. Recent Developments
- 11.2.6.5. Financials (Based on Availability)
- 11.2.7 NetMagic Solutions
- 11.2.7.1. Overview
- 11.2.7.2. Products
- 11.2.7.3. SWOT Analysis
- 11.2.7.4. Recent Developments
- 11.2.7.5. Financials (Based on Availability)
- 11.2.8 Cygilant Inc
- 11.2.8.1. Overview
- 11.2.8.2. Products
- 11.2.8.3. SWOT Analysis
- 11.2.8.4. Recent Developments
- 11.2.8.5. Financials (Based on Availability)
- 11.2.9 Alert Logic Inc
- 11.2.9.1. Overview
- 11.2.9.2. Products
- 11.2.9.3. SWOT Analysis
- 11.2.9.4. Recent Developments
- 11.2.9.5. Financials (Based on Availability)
- 11.2.10 Raytheon
- 11.2.10.1. Overview
- 11.2.10.2. Products
- 11.2.10.3. SWOT Analysis
- 11.2.10.4. Recent Developments
- 11.2.10.5. Financials (Based on Availability)
- 11.2.11 ESDS Software Solution Pvt. Ltd
- 11.2.11.1. Overview
- 11.2.11.2. Products
- 11.2.11.3. SWOT Analysis
- 11.2.11.4. Recent Developments
- 11.2.11.5. Financials (Based on Availability)
- 11.2.12 Suma Soft
- 11.2.12.1. Overview
- 11.2.12.2. Products
- 11.2.12.3. SWOT Analysis
- 11.2.12.4. Recent Developments
- 11.2.12.5. Financials (Based on Availability)
- 11.2.1 SecureWorks Inc
List of Figures
- Figure 1: Global Security Operation Center as a Service Revenue Breakdown (million, %) by Region 2024 & 2032
- Figure 2: North America Security Operation Center as a Service Revenue (million), by Application 2024 & 2032
- Figure 3: North America Security Operation Center as a Service Revenue Share (%), by Application 2024 & 2032
- Figure 4: North America Security Operation Center as a Service Revenue (million), by Types 2024 & 2032
- Figure 5: North America Security Operation Center as a Service Revenue Share (%), by Types 2024 & 2032
- Figure 6: North America Security Operation Center as a Service Revenue (million), by Country 2024 & 2032
- Figure 7: North America Security Operation Center as a Service Revenue Share (%), by Country 2024 & 2032
- Figure 8: South America Security Operation Center as a Service Revenue (million), by Application 2024 & 2032
- Figure 9: South America Security Operation Center as a Service Revenue Share (%), by Application 2024 & 2032
- Figure 10: South America Security Operation Center as a Service Revenue (million), by Types 2024 & 2032
- Figure 11: South America Security Operation Center as a Service Revenue Share (%), by Types 2024 & 2032
- Figure 12: South America Security Operation Center as a Service Revenue (million), by Country 2024 & 2032
- Figure 13: South America Security Operation Center as a Service Revenue Share (%), by Country 2024 & 2032
- Figure 14: Europe Security Operation Center as a Service Revenue (million), by Application 2024 & 2032
- Figure 15: Europe Security Operation Center as a Service Revenue Share (%), by Application 2024 & 2032
- Figure 16: Europe Security Operation Center as a Service Revenue (million), by Types 2024 & 2032
- Figure 17: Europe Security Operation Center as a Service Revenue Share (%), by Types 2024 & 2032
- Figure 18: Europe Security Operation Center as a Service Revenue (million), by Country 2024 & 2032
- Figure 19: Europe Security Operation Center as a Service Revenue Share (%), by Country 2024 & 2032
- Figure 20: Middle East & Africa Security Operation Center as a Service Revenue (million), by Application 2024 & 2032
- Figure 21: Middle East & Africa Security Operation Center as a Service Revenue Share (%), by Application 2024 & 2032
- Figure 22: Middle East & Africa Security Operation Center as a Service Revenue (million), by Types 2024 & 2032
- Figure 23: Middle East & Africa Security Operation Center as a Service Revenue Share (%), by Types 2024 & 2032
- Figure 24: Middle East & Africa Security Operation Center as a Service Revenue (million), by Country 2024 & 2032
- Figure 25: Middle East & Africa Security Operation Center as a Service Revenue Share (%), by Country 2024 & 2032
- Figure 26: Asia Pacific Security Operation Center as a Service Revenue (million), by Application 2024 & 2032
- Figure 27: Asia Pacific Security Operation Center as a Service Revenue Share (%), by Application 2024 & 2032
- Figure 28: Asia Pacific Security Operation Center as a Service Revenue (million), by Types 2024 & 2032
- Figure 29: Asia Pacific Security Operation Center as a Service Revenue Share (%), by Types 2024 & 2032
- Figure 30: Asia Pacific Security Operation Center as a Service Revenue (million), by Country 2024 & 2032
- Figure 31: Asia Pacific Security Operation Center as a Service Revenue Share (%), by Country 2024 & 2032
List of Tables
- Table 1: Global Security Operation Center as a Service Revenue million Forecast, by Region 2019 & 2032
- Table 2: Global Security Operation Center as a Service Revenue million Forecast, by Application 2019 & 2032
- Table 3: Global Security Operation Center as a Service Revenue million Forecast, by Types 2019 & 2032
- Table 4: Global Security Operation Center as a Service Revenue million Forecast, by Region 2019 & 2032
- Table 5: Global Security Operation Center as a Service Revenue million Forecast, by Application 2019 & 2032
- Table 6: Global Security Operation Center as a Service Revenue million Forecast, by Types 2019 & 2032
- Table 7: Global Security Operation Center as a Service Revenue million Forecast, by Country 2019 & 2032
- Table 8: United States Security Operation Center as a Service Revenue (million) Forecast, by Application 2019 & 2032
- Table 9: Canada Security Operation Center as a Service Revenue (million) Forecast, by Application 2019 & 2032
- Table 10: Mexico Security Operation Center as a Service Revenue (million) Forecast, by Application 2019 & 2032
- Table 11: Global Security Operation Center as a Service Revenue million Forecast, by Application 2019 & 2032
- Table 12: Global Security Operation Center as a Service Revenue million Forecast, by Types 2019 & 2032
- Table 13: Global Security Operation Center as a Service Revenue million Forecast, by Country 2019 & 2032
- Table 14: Brazil Security Operation Center as a Service Revenue (million) Forecast, by Application 2019 & 2032
- Table 15: Argentina Security Operation Center as a Service Revenue (million) Forecast, by Application 2019 & 2032
- Table 16: Rest of South America Security Operation Center as a Service Revenue (million) Forecast, by Application 2019 & 2032
- Table 17: Global Security Operation Center as a Service Revenue million Forecast, by Application 2019 & 2032
- Table 18: Global Security Operation Center as a Service Revenue million Forecast, by Types 2019 & 2032
- Table 19: Global Security Operation Center as a Service Revenue million Forecast, by Country 2019 & 2032
- Table 20: United Kingdom Security Operation Center as a Service Revenue (million) Forecast, by Application 2019 & 2032
- Table 21: Germany Security Operation Center as a Service Revenue (million) Forecast, by Application 2019 & 2032
- Table 22: France Security Operation Center as a Service Revenue (million) Forecast, by Application 2019 & 2032
- Table 23: Italy Security Operation Center as a Service Revenue (million) Forecast, by Application 2019 & 2032
- Table 24: Spain Security Operation Center as a Service Revenue (million) Forecast, by Application 2019 & 2032
- Table 25: Russia Security Operation Center as a Service Revenue (million) Forecast, by Application 2019 & 2032
- Table 26: Benelux Security Operation Center as a Service Revenue (million) Forecast, by Application 2019 & 2032
- Table 27: Nordics Security Operation Center as a Service Revenue (million) Forecast, by Application 2019 & 2032
- Table 28: Rest of Europe Security Operation Center as a Service Revenue (million) Forecast, by Application 2019 & 2032
- Table 29: Global Security Operation Center as a Service Revenue million Forecast, by Application 2019 & 2032
- Table 30: Global Security Operation Center as a Service Revenue million Forecast, by Types 2019 & 2032
- Table 31: Global Security Operation Center as a Service Revenue million Forecast, by Country 2019 & 2032
- Table 32: Turkey Security Operation Center as a Service Revenue (million) Forecast, by Application 2019 & 2032
- Table 33: Israel Security Operation Center as a Service Revenue (million) Forecast, by Application 2019 & 2032
- Table 34: GCC Security Operation Center as a Service Revenue (million) Forecast, by Application 2019 & 2032
- Table 35: North Africa Security Operation Center as a Service Revenue (million) Forecast, by Application 2019 & 2032
- Table 36: South Africa Security Operation Center as a Service Revenue (million) Forecast, by Application 2019 & 2032
- Table 37: Rest of Middle East & Africa Security Operation Center as a Service Revenue (million) Forecast, by Application 2019 & 2032
- Table 38: Global Security Operation Center as a Service Revenue million Forecast, by Application 2019 & 2032
- Table 39: Global Security Operation Center as a Service Revenue million Forecast, by Types 2019 & 2032
- Table 40: Global Security Operation Center as a Service Revenue million Forecast, by Country 2019 & 2032
- Table 41: China Security Operation Center as a Service Revenue (million) Forecast, by Application 2019 & 2032
- Table 42: India Security Operation Center as a Service Revenue (million) Forecast, by Application 2019 & 2032
- Table 43: Japan Security Operation Center as a Service Revenue (million) Forecast, by Application 2019 & 2032
- Table 44: South Korea Security Operation Center as a Service Revenue (million) Forecast, by Application 2019 & 2032
- Table 45: ASEAN Security Operation Center as a Service Revenue (million) Forecast, by Application 2019 & 2032
- Table 46: Oceania Security Operation Center as a Service Revenue (million) Forecast, by Application 2019 & 2032
- Table 47: Rest of Asia Pacific Security Operation Center as a Service Revenue (million) Forecast, by Application 2019 & 2032
Frequently Asked Questions
1. What is the projected Compound Annual Growth Rate (CAGR) of the Security Operation Center as a Service?
The projected CAGR is approximately XX%.
2. Which companies are prominent players in the Security Operation Center as a Service?
Key companies in the market include SecureWorks Inc, Cisco, Symantec Corporation, AT & T, Capgemini SE, BlackStratus Inc, NetMagic Solutions, Cygilant Inc, Alert Logic Inc, Raytheon, ESDS Software Solution Pvt. Ltd, Suma Soft.
3. What are the main segments of the Security Operation Center as a Service?
The market segments include Application, Types.
4. Can you provide details about the market size?
The market size is estimated to be USD XXX million as of 2022.
5. What are some drivers contributing to market growth?
N/A
6. What are the notable trends driving market growth?
N/A
7. Are there any restraints impacting market growth?
N/A
8. Can you provide examples of recent developments in the market?
N/A
9. What pricing options are available for accessing the report?
Pricing options include single-user, multi-user, and enterprise licenses priced at USD 4900.00, USD 7350.00, and USD 9800.00 respectively.
10. Is the market size provided in terms of value or volume?
The market size is provided in terms of value, measured in million.
11. Are there any specific market keywords associated with the report?
Yes, the market keyword associated with the report is "Security Operation Center as a Service," which aids in identifying and referencing the specific market segment covered.
12. How do I determine which pricing option suits my needs best?
The pricing options vary based on user requirements and access needs. Individual users may opt for single-user licenses, while businesses requiring broader access may choose multi-user or enterprise licenses for cost-effective access to the report.
13. Are there any additional resources or data provided in the Security Operation Center as a Service report?
While the report offers comprehensive insights, it's advisable to review the specific contents or supplementary materials provided to ascertain if additional resources or data are available.
14. How can I stay updated on further developments or reports in the Security Operation Center as a Service?
To stay informed about further developments, trends, and reports in the Security Operation Center as a Service, consider subscribing to industry newsletters, following relevant companies and organizations, or regularly checking reputable industry news sources and publications.
Methodology
Step 1 - Identification of Relevant Samples Size from Population Database


Step 2 - Approaches for Defining Global Market Size (Value, Volume* & Price*)

Note*: In applicable scenarios
Step 3 - Data Sources
Primary Research
- Web Analytics
- Survey Reports
- Research Institute
- Latest Research Reports
- Opinion Leaders
Secondary Research
- Annual Reports
- White Paper
- Latest Press Release
- Industry Association
- Paid Database
- Investor Presentations

Step 4 - Data Triangulation
Involves using different sources of information in order to increase the validity of a study
These sources are likely to be stakeholders in a program - participants, other researchers, program staff, other community members, and so on.
Then we put all data in single framework & apply various statistical tools to find out the dynamic on the market.
During the analysis stage, feedback from the stakeholder groups would be compared to determine areas of agreement as well as areas of divergence
