

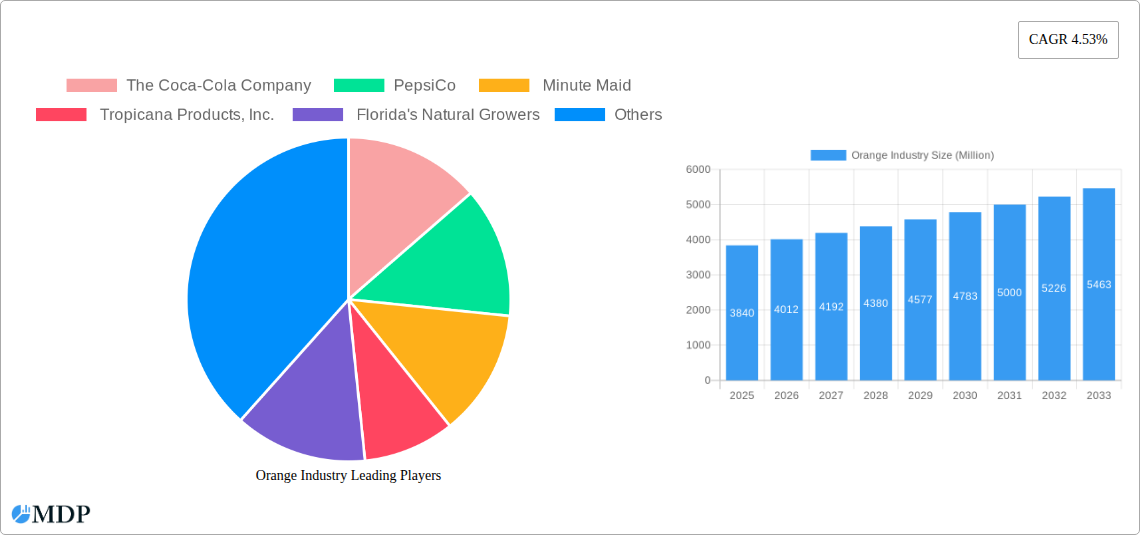
Key Insights
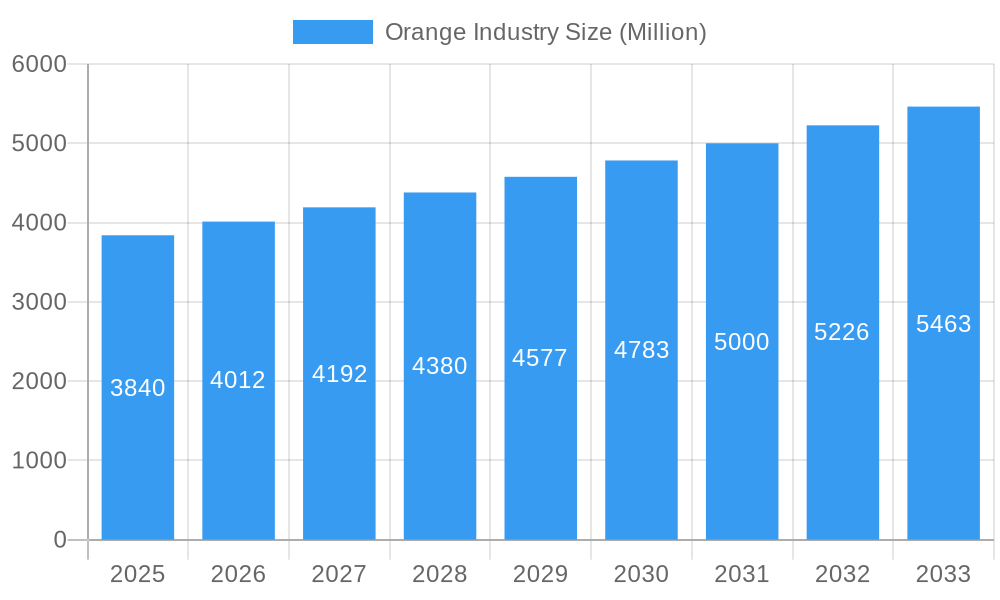
The global orange industry, valued at $3.84 billion in 2025, is projected to experience robust growth, driven by increasing consumer demand for healthy beverages and convenient food options. The Compound Annual Growth Rate (CAGR) of 4.53% from 2025 to 2033 indicates a significant expansion of the market over the forecast period. Key drivers include the rising popularity of orange juice as a source of Vitamin C, the growing use of oranges in processed foods, and the increasing preference for fresh, natural products. Furthermore, the beverage industry's significant reliance on orange concentrates and juices fuels substantial market demand. Market segmentation reveals a diverse landscape, with fresh oranges, frozen oranges, orange juice, concentrates, and peels contributing to the overall value. Application-wise, the beverage industry holds the largest market share, followed by food processing and direct consumption. Leading players like Coca-Cola, PepsiCo, Minute Maid, Tropicana, and Florida's Natural Growers are strategically positioned to capitalize on these trends, with ongoing innovation in product offerings and distribution channels. Regional variations in consumption patterns and production capabilities influence market dynamics; North America and Europe are currently leading regions, but Asia-Pacific shows promising growth potential due to increasing disposable incomes and changing dietary habits. Challenges include fluctuations in orange yields due to climate change and competition from other fruit juices.
Orange Industry Market Size (In Billion)
The forecast period (2025-2033) anticipates continued growth, although the rate might fluctuate slightly year-on-year due to external factors impacting agricultural production and consumer spending. The industry's success will depend on adapting to evolving consumer preferences, embracing sustainable farming practices, and navigating potential supply chain disruptions. Innovation in product development, such as functional beverages incorporating orange extracts or novel processing techniques, will be key to maintaining market competitiveness. The strategic expansion into emerging markets, coupled with effective marketing campaigns highlighting the health benefits of oranges and orange-based products, will be crucial for driving future market growth. The ongoing competition among major players will stimulate innovation and efficiency improvements throughout the value chain, benefiting consumers with diverse options and competitive pricing.
Orange Industry Company Market Share
Orange Industry Market Report: 2019-2033 Forecast
Dive into the comprehensive analysis of the global orange industry, encompassing market dynamics, leading players, emerging trends, and future growth projections (2019-2033). This report provides actionable insights for stakeholders across the value chain, from growers to processors and retailers.
This in-depth report covers:
Market Sizing & Forecasting: Detailed analysis of the orange industry's historical performance (2019-2024), current state (2025), and future projections (2025-2033) with a focus on key segments and geographical regions. Total market value projected to reach xx Million USD by 2033.
Competitive Landscape: In-depth profiles of key players including The Coca-Cola Company, PepsiCo, Minute Maid, Tropicana Products, Inc., and Florida's Natural Growers, analyzing their market share, strategies, and competitive advantages.
Growth Drivers & Challenges: Identification of key factors influencing market growth, including technological advancements, consumer preferences, regulatory changes, and supply chain dynamics. Analysis of challenges like fluctuating prices, climate change impacts, and competitive pressures.
Emerging Opportunities: Exploration of untapped potential within the orange industry, including new product development, market expansion, and strategic partnerships.
Orange Industry Market Dynamics & Concentration
The global orange industry is characterized by a moderately concentrated market structure, with a few multinational corporations holding significant market share. The market is driven by innovation in processing technologies, leading to the development of new products like functional orange juices and convenient packaging options. Regulatory frameworks concerning food safety and labeling influence production practices and trade. Product substitutes, such as other fruit juices and beverages, present competition. End-user trends toward healthier and more convenient food and beverage options are driving demand for certain orange-based products. M&A activities have played a role in shaping the market landscape, with larger companies consolidating their position through acquisitions of smaller players. The number of M&A deals in the orange industry has averaged xx per year over the past five years, representing a xx% increase compared to the previous five-year period. Leading companies, such as The Coca-Cola Company and PepsiCo, hold a significant market share in the processed orange juice segment, estimated at xx% and xx% respectively in 2025.
Orange Industry Industry Trends & Analysis
The orange industry is experiencing a dynamic evolution, driven by several key factors. Market growth is largely fueled by rising consumer demand for healthier beverage options and the increasing popularity of orange-based products in various applications. This is reflected in a Compound Annual Growth Rate (CAGR) of xx% during the historical period (2019-2024), projected to increase to xx% during the forecast period (2025-2033). Technological advancements in processing and packaging are improving efficiency and extending shelf life. Consumer preferences are shifting towards premium and organic orange products, driving innovation in this sector. Market penetration of organic orange products is projected to reach xx% by 2033. Intense competition among major players necessitates constant product innovation and aggressive marketing strategies to retain and attract consumers.
Leading Markets & Segments in Orange Industry
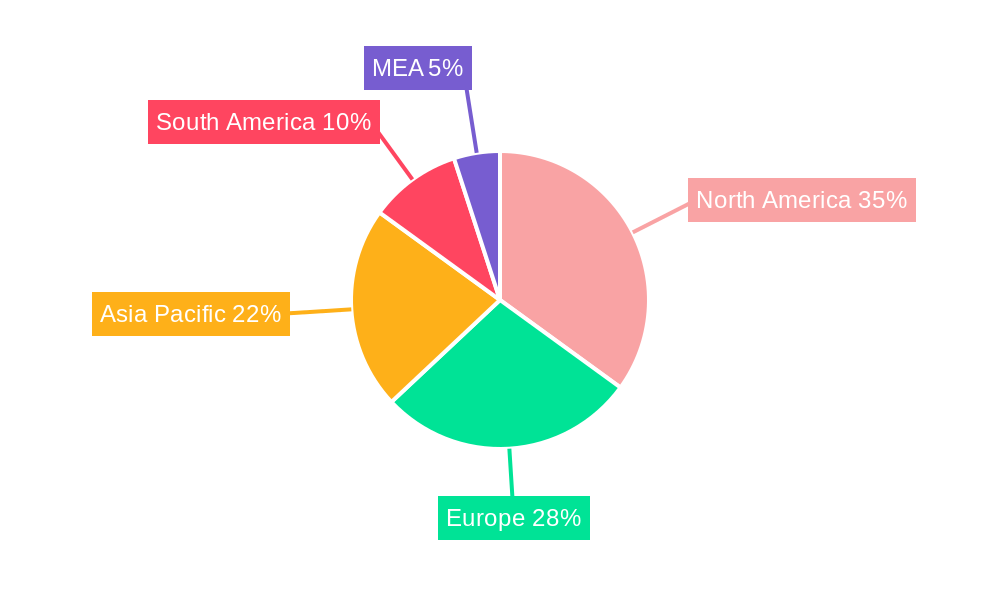
The United States remains the dominant market for oranges, followed by Brazil and other major citrus-producing nations. The largest segments by type are fresh oranges and orange juice, driven by robust direct consumption and the beverage industry.
Key Drivers:
- United States: Established infrastructure for production, processing, and distribution; high per capita consumption; strong regulatory frameworks.
- Brazil: Favorable climatic conditions; extensive orange production capacity; large domestic market and export potential.
Dominance Analysis: The dominance of the US market is attributable to its advanced agricultural practices, large consumer base with high purchasing power, and extensive distribution network for fresh oranges and processed products. Brazil’s dominance stems from its significant production capacity and competitive pricing strategies. The beverage industry represents the largest segment by application, with orange juice being a significant ingredient in various beverages worldwide.
Orange Industry Product Developments
Recent product innovations focus on enhancing convenience, expanding product portfolios and responding to consumer demand for healthier options. Companies are introducing new varieties of orange juice, including functional juices enriched with vitamins and minerals, and convenient packaging such as single-serve bottles and cartons. The use of advanced processing technologies allows for longer shelf life and improved quality retention. These developments reflect the industry's adaptability to evolving consumer preferences and growing health consciousness. The increasing popularity of ready-to-drink orange beverages and functional drinks that contain added nutritional supplements represents a substantial opportunity for growth.
Key Drivers of Orange Industry Growth
Several factors are contributing to the growth of the orange industry. Technological advancements in cultivation, processing, and packaging techniques are enhancing efficiency and product quality. Favorable economic conditions in key markets are boosting consumer spending on food and beverages. Government regulations promoting sustainable agricultural practices are driving the adoption of environmentally friendly techniques. Examples include the increased use of precision agriculture and organic farming methods. The growing health awareness among consumers is contributing to a surge in the demand for orange products, especially fresh oranges and 100% orange juices.
Challenges in the Orange Industry Market
The orange industry faces several significant challenges. Fluctuating prices due to weather conditions and global supply chain disruptions represent a considerable obstacle for producers and processors. Stringent food safety and labeling regulations increase compliance costs and complexity. Intense competition from other fruit juices and beverages necessitates innovative product development to maintain market share. The impact of climate change, including extreme weather events and the spread of pests and diseases, is predicted to reduce orange yields by xx% by 2033.
Emerging Opportunities in Orange Industry
The orange industry presents several emerging opportunities. Technological breakthroughs in areas such as biotechnology and precision agriculture hold the potential to enhance productivity and improve the nutritional value of oranges. Strategic partnerships among producers, processors, and retailers can facilitate greater market penetration and value chain integration. Expanding into new markets with growing demand for orange products, particularly in developing economies, creates further growth potential. The development of value-added products, such as orange peel extracts for cosmetic and pharmaceutical applications, presents an opportunity for diversification.
Leading Players in the Orange Industry Sector
- The Coca-Cola Company
- PepsiCo
- Minute Maid
- Tropicana Products, Inc.
- Florida's Natural Growers
Key Milestones in Orange Industry Industry
May 2022: An agreement between the Agricultural and Processed Food Products Export Development Authority and Agrovision Foundation aims to boost orange exports from USD 61.2 Million to USD 612.0 Million through organic farming and hybrid varieties. This signifies a major push towards expanding the market for Indian oranges internationally.
September 2022: Virtue Clean Energy launched an orange-flavored energy drink, demonstrating market diversification and interest in innovative orange-flavored products beyond traditional juice. This highlights the opportunity for orange-based products in various sectors.
November 2022: The first export of 6 metric tons of oranges from Arunachal Pradesh to the UAE and Qatar marks a significant step in expanding global reach. This signals growing potential for exports from new regions.
Strategic Outlook for Orange Industry Market
The future of the orange industry is promising, with significant growth potential driven by factors such as rising consumer demand, technological advancements, and strategic market expansions. Companies focused on sustainable production, value-added products, and innovative marketing strategies will be best positioned for success. The increasing focus on health and wellness will continue to fuel demand for high-quality, minimally processed orange products. Strategic collaborations across the value chain and investments in research and development will play a crucial role in shaping the future of this dynamic industry.
Orange Industry Segmentation
- 1. Production Analysis
- 2. Consumption Analysis
- 3. Import Market Analysis (Value & Volume)
- 4. Export Market Analysis (Value & Volume)
- 5. Price Trend Analysis
Orange Industry Segmentation By Geography
- 1. Brazil
- 2. China
- 3. India
- 4. Mexico
- 5. United States
- 6. European Union
- 7. Egypt
- 8. South Africa
- 9. Indonesia
- 10. Turkey
Orange Industry Regional Market Share
Geographic Coverage of Orange Industry
Orange Industry REPORT HIGHLIGHTS
| Aspects | Details |
|---|---|
| Study Period | 2020-2034 |
| Base Year | 2025 |
| Estimated Year | 2026 |
| Forecast Period | 2026-2034 |
| Historical Period | 2020-2025 |
| Growth Rate | CAGR of 4.53% from 2020-2034 |
| Segmentation |
|
Table of Contents
- 1. Introduction
- 1.1. Research Scope
- 1.2. Market Segmentation
- 1.3. Research Methodology
- 1.4. Definitions and Assumptions
- 2. Executive Summary
- 2.1. Introduction
- 3. Market Dynamics
- 3.1. Introduction
- 3.2. Market Drivers
- 3.2.1. Rising Consumption of Cashew Nuts as a Healthy Snack; Increasing Government initiatives; Growing Cashew Nut Imports in The United States
- 3.3. Market Restrains
- 3.3.1. Hazardous Climatic Condition Hinders Cashew Production; Stringent Regulations Related To Food Quality Standards
- 3.4. Market Trends
- 3.4.1. Growing Seasonal Consumption of Orange
- 4. Market Factor Analysis
- 4.1. Porters Five Forces
- 4.2. Supply/Value Chain
- 4.3. PESTEL analysis
- 4.4. Market Entropy
- 4.5. Patent/Trademark Analysis
- 5. Global Orange Industry Analysis, Insights and Forecast, 2020-2032
- 5.1. Market Analysis, Insights and Forecast - by Production Analysis
- 5.2. Market Analysis, Insights and Forecast - by Consumption Analysis
- 5.3. Market Analysis, Insights and Forecast - by Import Market Analysis (Value & Volume)
- 5.4. Market Analysis, Insights and Forecast - by Export Market Analysis (Value & Volume)
- 5.5. Market Analysis, Insights and Forecast - by Price Trend Analysis
- 5.6. Market Analysis, Insights and Forecast - by Region
- 5.6.1. Brazil
- 5.6.2. China
- 5.6.3. India
- 5.6.4. Mexico
- 5.6.5. United States
- 5.6.6. European Union
- 5.6.7. Egypt
- 5.6.8. South Africa
- 5.6.9. Indonesia
- 5.6.10. Turkey
- 5.1. Market Analysis, Insights and Forecast - by Production Analysis
- 6. Brazil Orange Industry Analysis, Insights and Forecast, 2020-2032
- 6.1. Market Analysis, Insights and Forecast - by Production Analysis
- 6.2. Market Analysis, Insights and Forecast - by Consumption Analysis
- 6.3. Market Analysis, Insights and Forecast - by Import Market Analysis (Value & Volume)
- 6.4. Market Analysis, Insights and Forecast - by Export Market Analysis (Value & Volume)
- 6.5. Market Analysis, Insights and Forecast - by Price Trend Analysis
- 6.1. Market Analysis, Insights and Forecast - by Production Analysis
- 7. China Orange Industry Analysis, Insights and Forecast, 2020-2032
- 7.1. Market Analysis, Insights and Forecast - by Production Analysis
- 7.2. Market Analysis, Insights and Forecast - by Consumption Analysis
- 7.3. Market Analysis, Insights and Forecast - by Import Market Analysis (Value & Volume)
- 7.4. Market Analysis, Insights and Forecast - by Export Market Analysis (Value & Volume)
- 7.5. Market Analysis, Insights and Forecast - by Price Trend Analysis
- 7.1. Market Analysis, Insights and Forecast - by Production Analysis
- 8. India Orange Industry Analysis, Insights and Forecast, 2020-2032
- 8.1. Market Analysis, Insights and Forecast - by Production Analysis
- 8.2. Market Analysis, Insights and Forecast - by Consumption Analysis
- 8.3. Market Analysis, Insights and Forecast - by Import Market Analysis (Value & Volume)
- 8.4. Market Analysis, Insights and Forecast - by Export Market Analysis (Value & Volume)
- 8.5. Market Analysis, Insights and Forecast - by Price Trend Analysis
- 8.1. Market Analysis, Insights and Forecast - by Production Analysis
- 9. Mexico Orange Industry Analysis, Insights and Forecast, 2020-2032
- 9.1. Market Analysis, Insights and Forecast - by Production Analysis
- 9.2. Market Analysis, Insights and Forecast - by Consumption Analysis
- 9.3. Market Analysis, Insights and Forecast - by Import Market Analysis (Value & Volume)
- 9.4. Market Analysis, Insights and Forecast - by Export Market Analysis (Value & Volume)
- 9.5. Market Analysis, Insights and Forecast - by Price Trend Analysis
- 9.1. Market Analysis, Insights and Forecast - by Production Analysis
- 10. United States Orange Industry Analysis, Insights and Forecast, 2020-2032
- 10.1. Market Analysis, Insights and Forecast - by Production Analysis
- 10.2. Market Analysis, Insights and Forecast - by Consumption Analysis
- 10.3. Market Analysis, Insights and Forecast - by Import Market Analysis (Value & Volume)
- 10.4. Market Analysis, Insights and Forecast - by Export Market Analysis (Value & Volume)
- 10.5. Market Analysis, Insights and Forecast - by Price Trend Analysis
- 10.1. Market Analysis, Insights and Forecast - by Production Analysis
- 11. European Union Orange Industry Analysis, Insights and Forecast, 2020-2032
- 11.1. Market Analysis, Insights and Forecast - by Production Analysis
- 11.2. Market Analysis, Insights and Forecast - by Consumption Analysis
- 11.3. Market Analysis, Insights and Forecast - by Import Market Analysis (Value & Volume)
- 11.4. Market Analysis, Insights and Forecast - by Export Market Analysis (Value & Volume)
- 11.5. Market Analysis, Insights and Forecast - by Price Trend Analysis
- 11.1. Market Analysis, Insights and Forecast - by Production Analysis
- 12. Egypt Orange Industry Analysis, Insights and Forecast, 2020-2032
- 12.1. Market Analysis, Insights and Forecast - by Production Analysis
- 12.2. Market Analysis, Insights and Forecast - by Consumption Analysis
- 12.3. Market Analysis, Insights and Forecast - by Import Market Analysis (Value & Volume)
- 12.4. Market Analysis, Insights and Forecast - by Export Market Analysis (Value & Volume)
- 12.5. Market Analysis, Insights and Forecast - by Price Trend Analysis
- 12.1. Market Analysis, Insights and Forecast - by Production Analysis
- 13. South Africa Orange Industry Analysis, Insights and Forecast, 2020-2032
- 13.1. Market Analysis, Insights and Forecast - by Production Analysis
- 13.2. Market Analysis, Insights and Forecast - by Consumption Analysis
- 13.3. Market Analysis, Insights and Forecast - by Import Market Analysis (Value & Volume)
- 13.4. Market Analysis, Insights and Forecast - by Export Market Analysis (Value & Volume)
- 13.5. Market Analysis, Insights and Forecast - by Price Trend Analysis
- 13.1. Market Analysis, Insights and Forecast - by Production Analysis
- 14. Indonesia Orange Industry Analysis, Insights and Forecast, 2020-2032
- 14.1. Market Analysis, Insights and Forecast - by Production Analysis
- 14.2. Market Analysis, Insights and Forecast - by Consumption Analysis
- 14.3. Market Analysis, Insights and Forecast - by Import Market Analysis (Value & Volume)
- 14.4. Market Analysis, Insights and Forecast - by Export Market Analysis (Value & Volume)
- 14.5. Market Analysis, Insights and Forecast - by Price Trend Analysis
- 14.1. Market Analysis, Insights and Forecast - by Production Analysis
- 15. Turkey Orange Industry Analysis, Insights and Forecast, 2020-2032
- 15.1. Market Analysis, Insights and Forecast - by Production Analysis
- 15.2. Market Analysis, Insights and Forecast - by Consumption Analysis
- 15.3. Market Analysis, Insights and Forecast - by Import Market Analysis (Value & Volume)
- 15.4. Market Analysis, Insights and Forecast - by Export Market Analysis (Value & Volume)
- 15.5. Market Analysis, Insights and Forecast - by Price Trend Analysis
- 15.1. Market Analysis, Insights and Forecast - by Production Analysis
- 16. Competitive Analysis
- 16.1. Global Market Share Analysis 2025
- 16.2. Company Profiles
- 16.2.1 The Coca-Cola Company
- 16.2.1.1. Overview
- 16.2.1.2. Products
- 16.2.1.3. SWOT Analysis
- 16.2.1.4. Recent Developments
- 16.2.1.5. Financials (Based on Availability)
- 16.2.2 PepsiCo
- 16.2.2.1. Overview
- 16.2.2.2. Products
- 16.2.2.3. SWOT Analysis
- 16.2.2.4. Recent Developments
- 16.2.2.5. Financials (Based on Availability)
- 16.2.3 Minute Maid
- 16.2.3.1. Overview
- 16.2.3.2. Products
- 16.2.3.3. SWOT Analysis
- 16.2.3.4. Recent Developments
- 16.2.3.5. Financials (Based on Availability)
- 16.2.4 Tropicana Products Inc.
- 16.2.4.1. Overview
- 16.2.4.2. Products
- 16.2.4.3. SWOT Analysis
- 16.2.4.4. Recent Developments
- 16.2.4.5. Financials (Based on Availability)
- 16.2.5 Florida's Natural Growers
- 16.2.5.1. Overview
- 16.2.5.2. Products
- 16.2.5.3. SWOT Analysis
- 16.2.5.4. Recent Developments
- 16.2.5.5. Financials (Based on Availability)
- 16.2.1 The Coca-Cola Company
List of Figures
- Figure 1: Global Orange Industry Revenue Breakdown (Million, %) by Region 2025 & 2033
- Figure 2: Global Orange Industry Volume Breakdown (Kiloton, %) by Region 2025 & 2033
- Figure 3: Brazil Orange Industry Revenue (Million), by Production Analysis 2025 & 2033
- Figure 4: Brazil Orange Industry Volume (Kiloton), by Production Analysis 2025 & 2033
- Figure 5: Brazil Orange Industry Revenue Share (%), by Production Analysis 2025 & 2033
- Figure 6: Brazil Orange Industry Volume Share (%), by Production Analysis 2025 & 2033
- Figure 7: Brazil Orange Industry Revenue (Million), by Consumption Analysis 2025 & 2033
- Figure 8: Brazil Orange Industry Volume (Kiloton), by Consumption Analysis 2025 & 2033
- Figure 9: Brazil Orange Industry Revenue Share (%), by Consumption Analysis 2025 & 2033
- Figure 10: Brazil Orange Industry Volume Share (%), by Consumption Analysis 2025 & 2033
- Figure 11: Brazil Orange Industry Revenue (Million), by Import Market Analysis (Value & Volume) 2025 & 2033
- Figure 12: Brazil Orange Industry Volume (Kiloton), by Import Market Analysis (Value & Volume) 2025 & 2033
- Figure 13: Brazil Orange Industry Revenue Share (%), by Import Market Analysis (Value & Volume) 2025 & 2033
- Figure 14: Brazil Orange Industry Volume Share (%), by Import Market Analysis (Value & Volume) 2025 & 2033
- Figure 15: Brazil Orange Industry Revenue (Million), by Export Market Analysis (Value & Volume) 2025 & 2033
- Figure 16: Brazil Orange Industry Volume (Kiloton), by Export Market Analysis (Value & Volume) 2025 & 2033
- Figure 17: Brazil Orange Industry Revenue Share (%), by Export Market Analysis (Value & Volume) 2025 & 2033
- Figure 18: Brazil Orange Industry Volume Share (%), by Export Market Analysis (Value & Volume) 2025 & 2033
- Figure 19: Brazil Orange Industry Revenue (Million), by Price Trend Analysis 2025 & 2033
- Figure 20: Brazil Orange Industry Volume (Kiloton), by Price Trend Analysis 2025 & 2033
- Figure 21: Brazil Orange Industry Revenue Share (%), by Price Trend Analysis 2025 & 2033
- Figure 22: Brazil Orange Industry Volume Share (%), by Price Trend Analysis 2025 & 2033
- Figure 23: Brazil Orange Industry Revenue (Million), by Country 2025 & 2033
- Figure 24: Brazil Orange Industry Volume (Kiloton), by Country 2025 & 2033
- Figure 25: Brazil Orange Industry Revenue Share (%), by Country 2025 & 2033
- Figure 26: Brazil Orange Industry Volume Share (%), by Country 2025 & 2033
- Figure 27: China Orange Industry Revenue (Million), by Production Analysis 2025 & 2033
- Figure 28: China Orange Industry Volume (Kiloton), by Production Analysis 2025 & 2033
- Figure 29: China Orange Industry Revenue Share (%), by Production Analysis 2025 & 2033
- Figure 30: China Orange Industry Volume Share (%), by Production Analysis 2025 & 2033
- Figure 31: China Orange Industry Revenue (Million), by Consumption Analysis 2025 & 2033
- Figure 32: China Orange Industry Volume (Kiloton), by Consumption Analysis 2025 & 2033
- Figure 33: China Orange Industry Revenue Share (%), by Consumption Analysis 2025 & 2033
- Figure 34: China Orange Industry Volume Share (%), by Consumption Analysis 2025 & 2033
- Figure 35: China Orange Industry Revenue (Million), by Import Market Analysis (Value & Volume) 2025 & 2033
- Figure 36: China Orange Industry Volume (Kiloton), by Import Market Analysis (Value & Volume) 2025 & 2033
- Figure 37: China Orange Industry Revenue Share (%), by Import Market Analysis (Value & Volume) 2025 & 2033
- Figure 38: China Orange Industry Volume Share (%), by Import Market Analysis (Value & Volume) 2025 & 2033
- Figure 39: China Orange Industry Revenue (Million), by Export Market Analysis (Value & Volume) 2025 & 2033
- Figure 40: China Orange Industry Volume (Kiloton), by Export Market Analysis (Value & Volume) 2025 & 2033
- Figure 41: China Orange Industry Revenue Share (%), by Export Market Analysis (Value & Volume) 2025 & 2033
- Figure 42: China Orange Industry Volume Share (%), by Export Market Analysis (Value & Volume) 2025 & 2033
- Figure 43: China Orange Industry Revenue (Million), by Price Trend Analysis 2025 & 2033
- Figure 44: China Orange Industry Volume (Kiloton), by Price Trend Analysis 2025 & 2033
- Figure 45: China Orange Industry Revenue Share (%), by Price Trend Analysis 2025 & 2033
- Figure 46: China Orange Industry Volume Share (%), by Price Trend Analysis 2025 & 2033
- Figure 47: China Orange Industry Revenue (Million), by Country 2025 & 2033
- Figure 48: China Orange Industry Volume (Kiloton), by Country 2025 & 2033
- Figure 49: China Orange Industry Revenue Share (%), by Country 2025 & 2033
- Figure 50: China Orange Industry Volume Share (%), by Country 2025 & 2033
- Figure 51: India Orange Industry Revenue (Million), by Production Analysis 2025 & 2033
- Figure 52: India Orange Industry Volume (Kiloton), by Production Analysis 2025 & 2033
- Figure 53: India Orange Industry Revenue Share (%), by Production Analysis 2025 & 2033
- Figure 54: India Orange Industry Volume Share (%), by Production Analysis 2025 & 2033
- Figure 55: India Orange Industry Revenue (Million), by Consumption Analysis 2025 & 2033
- Figure 56: India Orange Industry Volume (Kiloton), by Consumption Analysis 2025 & 2033
- Figure 57: India Orange Industry Revenue Share (%), by Consumption Analysis 2025 & 2033
- Figure 58: India Orange Industry Volume Share (%), by Consumption Analysis 2025 & 2033
- Figure 59: India Orange Industry Revenue (Million), by Import Market Analysis (Value & Volume) 2025 & 2033
- Figure 60: India Orange Industry Volume (Kiloton), by Import Market Analysis (Value & Volume) 2025 & 2033
- Figure 61: India Orange Industry Revenue Share (%), by Import Market Analysis (Value & Volume) 2025 & 2033
- Figure 62: India Orange Industry Volume Share (%), by Import Market Analysis (Value & Volume) 2025 & 2033
- Figure 63: India Orange Industry Revenue (Million), by Export Market Analysis (Value & Volume) 2025 & 2033
- Figure 64: India Orange Industry Volume (Kiloton), by Export Market Analysis (Value & Volume) 2025 & 2033
- Figure 65: India Orange Industry Revenue Share (%), by Export Market Analysis (Value & Volume) 2025 & 2033
- Figure 66: India Orange Industry Volume Share (%), by Export Market Analysis (Value & Volume) 2025 & 2033
- Figure 67: India Orange Industry Revenue (Million), by Price Trend Analysis 2025 & 2033
- Figure 68: India Orange Industry Volume (Kiloton), by Price Trend Analysis 2025 & 2033
- Figure 69: India Orange Industry Revenue Share (%), by Price Trend Analysis 2025 & 2033
- Figure 70: India Orange Industry Volume Share (%), by Price Trend Analysis 2025 & 2033
- Figure 71: India Orange Industry Revenue (Million), by Country 2025 & 2033
- Figure 72: India Orange Industry Volume (Kiloton), by Country 2025 & 2033
- Figure 73: India Orange Industry Revenue Share (%), by Country 2025 & 2033
- Figure 74: India Orange Industry Volume Share (%), by Country 2025 & 2033
- Figure 75: Mexico Orange Industry Revenue (Million), by Production Analysis 2025 & 2033
- Figure 76: Mexico Orange Industry Volume (Kiloton), by Production Analysis 2025 & 2033
- Figure 77: Mexico Orange Industry Revenue Share (%), by Production Analysis 2025 & 2033
- Figure 78: Mexico Orange Industry Volume Share (%), by Production Analysis 2025 & 2033
- Figure 79: Mexico Orange Industry Revenue (Million), by Consumption Analysis 2025 & 2033
- Figure 80: Mexico Orange Industry Volume (Kiloton), by Consumption Analysis 2025 & 2033
- Figure 81: Mexico Orange Industry Revenue Share (%), by Consumption Analysis 2025 & 2033
- Figure 82: Mexico Orange Industry Volume Share (%), by Consumption Analysis 2025 & 2033
- Figure 83: Mexico Orange Industry Revenue (Million), by Import Market Analysis (Value & Volume) 2025 & 2033
- Figure 84: Mexico Orange Industry Volume (Kiloton), by Import Market Analysis (Value & Volume) 2025 & 2033
- Figure 85: Mexico Orange Industry Revenue Share (%), by Import Market Analysis (Value & Volume) 2025 & 2033
- Figure 86: Mexico Orange Industry Volume Share (%), by Import Market Analysis (Value & Volume) 2025 & 2033
- Figure 87: Mexico Orange Industry Revenue (Million), by Export Market Analysis (Value & Volume) 2025 & 2033
- Figure 88: Mexico Orange Industry Volume (Kiloton), by Export Market Analysis (Value & Volume) 2025 & 2033
- Figure 89: Mexico Orange Industry Revenue Share (%), by Export Market Analysis (Value & Volume) 2025 & 2033
- Figure 90: Mexico Orange Industry Volume Share (%), by Export Market Analysis (Value & Volume) 2025 & 2033
- Figure 91: Mexico Orange Industry Revenue (Million), by Price Trend Analysis 2025 & 2033
- Figure 92: Mexico Orange Industry Volume (Kiloton), by Price Trend Analysis 2025 & 2033
- Figure 93: Mexico Orange Industry Revenue Share (%), by Price Trend Analysis 2025 & 2033
- Figure 94: Mexico Orange Industry Volume Share (%), by Price Trend Analysis 2025 & 2033
- Figure 95: Mexico Orange Industry Revenue (Million), by Country 2025 & 2033
- Figure 96: Mexico Orange Industry Volume (Kiloton), by Country 2025 & 2033
- Figure 97: Mexico Orange Industry Revenue Share (%), by Country 2025 & 2033
- Figure 98: Mexico Orange Industry Volume Share (%), by Country 2025 & 2033
- Figure 99: United States Orange Industry Revenue (Million), by Production Analysis 2025 & 2033
- Figure 100: United States Orange Industry Volume (Kiloton), by Production Analysis 2025 & 2033
- Figure 101: United States Orange Industry Revenue Share (%), by Production Analysis 2025 & 2033
- Figure 102: United States Orange Industry Volume Share (%), by Production Analysis 2025 & 2033
- Figure 103: United States Orange Industry Revenue (Million), by Consumption Analysis 2025 & 2033
- Figure 104: United States Orange Industry Volume (Kiloton), by Consumption Analysis 2025 & 2033
- Figure 105: United States Orange Industry Revenue Share (%), by Consumption Analysis 2025 & 2033
- Figure 106: United States Orange Industry Volume Share (%), by Consumption Analysis 2025 & 2033
- Figure 107: United States Orange Industry Revenue (Million), by Import Market Analysis (Value & Volume) 2025 & 2033
- Figure 108: United States Orange Industry Volume (Kiloton), by Import Market Analysis (Value & Volume) 2025 & 2033
- Figure 109: United States Orange Industry Revenue Share (%), by Import Market Analysis (Value & Volume) 2025 & 2033
- Figure 110: United States Orange Industry Volume Share (%), by Import Market Analysis (Value & Volume) 2025 & 2033
- Figure 111: United States Orange Industry Revenue (Million), by Export Market Analysis (Value & Volume) 2025 & 2033
- Figure 112: United States Orange Industry Volume (Kiloton), by Export Market Analysis (Value & Volume) 2025 & 2033
- Figure 113: United States Orange Industry Revenue Share (%), by Export Market Analysis (Value & Volume) 2025 & 2033
- Figure 114: United States Orange Industry Volume Share (%), by Export Market Analysis (Value & Volume) 2025 & 2033
- Figure 115: United States Orange Industry Revenue (Million), by Price Trend Analysis 2025 & 2033
- Figure 116: United States Orange Industry Volume (Kiloton), by Price Trend Analysis 2025 & 2033
- Figure 117: United States Orange Industry Revenue Share (%), by Price Trend Analysis 2025 & 2033
- Figure 118: United States Orange Industry Volume Share (%), by Price Trend Analysis 2025 & 2033
- Figure 119: United States Orange Industry Revenue (Million), by Country 2025 & 2033
- Figure 120: United States Orange Industry Volume (Kiloton), by Country 2025 & 2033
- Figure 121: United States Orange Industry Revenue Share (%), by Country 2025 & 2033
- Figure 122: United States Orange Industry Volume Share (%), by Country 2025 & 2033
- Figure 123: European Union Orange Industry Revenue (Million), by Production Analysis 2025 & 2033
- Figure 124: European Union Orange Industry Volume (Kiloton), by Production Analysis 2025 & 2033
- Figure 125: European Union Orange Industry Revenue Share (%), by Production Analysis 2025 & 2033
- Figure 126: European Union Orange Industry Volume Share (%), by Production Analysis 2025 & 2033
- Figure 127: European Union Orange Industry Revenue (Million), by Consumption Analysis 2025 & 2033
- Figure 128: European Union Orange Industry Volume (Kiloton), by Consumption Analysis 2025 & 2033
- Figure 129: European Union Orange Industry Revenue Share (%), by Consumption Analysis 2025 & 2033
- Figure 130: European Union Orange Industry Volume Share (%), by Consumption Analysis 2025 & 2033
- Figure 131: European Union Orange Industry Revenue (Million), by Import Market Analysis (Value & Volume) 2025 & 2033
- Figure 132: European Union Orange Industry Volume (Kiloton), by Import Market Analysis (Value & Volume) 2025 & 2033
- Figure 133: European Union Orange Industry Revenue Share (%), by Import Market Analysis (Value & Volume) 2025 & 2033
- Figure 134: European Union Orange Industry Volume Share (%), by Import Market Analysis (Value & Volume) 2025 & 2033
- Figure 135: European Union Orange Industry Revenue (Million), by Export Market Analysis (Value & Volume) 2025 & 2033
- Figure 136: European Union Orange Industry Volume (Kiloton), by Export Market Analysis (Value & Volume) 2025 & 2033
- Figure 137: European Union Orange Industry Revenue Share (%), by Export Market Analysis (Value & Volume) 2025 & 2033
- Figure 138: European Union Orange Industry Volume Share (%), by Export Market Analysis (Value & Volume) 2025 & 2033
- Figure 139: European Union Orange Industry Revenue (Million), by Price Trend Analysis 2025 & 2033
- Figure 140: European Union Orange Industry Volume (Kiloton), by Price Trend Analysis 2025 & 2033
- Figure 141: European Union Orange Industry Revenue Share (%), by Price Trend Analysis 2025 & 2033
- Figure 142: European Union Orange Industry Volume Share (%), by Price Trend Analysis 2025 & 2033
- Figure 143: European Union Orange Industry Revenue (Million), by Country 2025 & 2033
- Figure 144: European Union Orange Industry Volume (Kiloton), by Country 2025 & 2033
- Figure 145: European Union Orange Industry Revenue Share (%), by Country 2025 & 2033
- Figure 146: European Union Orange Industry Volume Share (%), by Country 2025 & 2033
- Figure 147: Egypt Orange Industry Revenue (Million), by Production Analysis 2025 & 2033
- Figure 148: Egypt Orange Industry Volume (Kiloton), by Production Analysis 2025 & 2033
- Figure 149: Egypt Orange Industry Revenue Share (%), by Production Analysis 2025 & 2033
- Figure 150: Egypt Orange Industry Volume Share (%), by Production Analysis 2025 & 2033
- Figure 151: Egypt Orange Industry Revenue (Million), by Consumption Analysis 2025 & 2033
- Figure 152: Egypt Orange Industry Volume (Kiloton), by Consumption Analysis 2025 & 2033
- Figure 153: Egypt Orange Industry Revenue Share (%), by Consumption Analysis 2025 & 2033
- Figure 154: Egypt Orange Industry Volume Share (%), by Consumption Analysis 2025 & 2033
- Figure 155: Egypt Orange Industry Revenue (Million), by Import Market Analysis (Value & Volume) 2025 & 2033
- Figure 156: Egypt Orange Industry Volume (Kiloton), by Import Market Analysis (Value & Volume) 2025 & 2033
- Figure 157: Egypt Orange Industry Revenue Share (%), by Import Market Analysis (Value & Volume) 2025 & 2033
- Figure 158: Egypt Orange Industry Volume Share (%), by Import Market Analysis (Value & Volume) 2025 & 2033
- Figure 159: Egypt Orange Industry Revenue (Million), by Export Market Analysis (Value & Volume) 2025 & 2033
- Figure 160: Egypt Orange Industry Volume (Kiloton), by Export Market Analysis (Value & Volume) 2025 & 2033
- Figure 161: Egypt Orange Industry Revenue Share (%), by Export Market Analysis (Value & Volume) 2025 & 2033
- Figure 162: Egypt Orange Industry Volume Share (%), by Export Market Analysis (Value & Volume) 2025 & 2033
- Figure 163: Egypt Orange Industry Revenue (Million), by Price Trend Analysis 2025 & 2033
- Figure 164: Egypt Orange Industry Volume (Kiloton), by Price Trend Analysis 2025 & 2033
- Figure 165: Egypt Orange Industry Revenue Share (%), by Price Trend Analysis 2025 & 2033
- Figure 166: Egypt Orange Industry Volume Share (%), by Price Trend Analysis 2025 & 2033
- Figure 167: Egypt Orange Industry Revenue (Million), by Country 2025 & 2033
- Figure 168: Egypt Orange Industry Volume (Kiloton), by Country 2025 & 2033
- Figure 169: Egypt Orange Industry Revenue Share (%), by Country 2025 & 2033
- Figure 170: Egypt Orange Industry Volume Share (%), by Country 2025 & 2033
- Figure 171: South Africa Orange Industry Revenue (Million), by Production Analysis 2025 & 2033
- Figure 172: South Africa Orange Industry Volume (Kiloton), by Production Analysis 2025 & 2033
- Figure 173: South Africa Orange Industry Revenue Share (%), by Production Analysis 2025 & 2033
- Figure 174: South Africa Orange Industry Volume Share (%), by Production Analysis 2025 & 2033
- Figure 175: South Africa Orange Industry Revenue (Million), by Consumption Analysis 2025 & 2033
- Figure 176: South Africa Orange Industry Volume (Kiloton), by Consumption Analysis 2025 & 2033
- Figure 177: South Africa Orange Industry Revenue Share (%), by Consumption Analysis 2025 & 2033
- Figure 178: South Africa Orange Industry Volume Share (%), by Consumption Analysis 2025 & 2033
- Figure 179: South Africa Orange Industry Revenue (Million), by Import Market Analysis (Value & Volume) 2025 & 2033
- Figure 180: South Africa Orange Industry Volume (Kiloton), by Import Market Analysis (Value & Volume) 2025 & 2033
- Figure 181: South Africa Orange Industry Revenue Share (%), by Import Market Analysis (Value & Volume) 2025 & 2033
- Figure 182: South Africa Orange Industry Volume Share (%), by Import Market Analysis (Value & Volume) 2025 & 2033
- Figure 183: South Africa Orange Industry Revenue (Million), by Export Market Analysis (Value & Volume) 2025 & 2033
- Figure 184: South Africa Orange Industry Volume (Kiloton), by Export Market Analysis (Value & Volume) 2025 & 2033
- Figure 185: South Africa Orange Industry Revenue Share (%), by Export Market Analysis (Value & Volume) 2025 & 2033
- Figure 186: South Africa Orange Industry Volume Share (%), by Export Market Analysis (Value & Volume) 2025 & 2033
- Figure 187: South Africa Orange Industry Revenue (Million), by Price Trend Analysis 2025 & 2033
- Figure 188: South Africa Orange Industry Volume (Kiloton), by Price Trend Analysis 2025 & 2033
- Figure 189: South Africa Orange Industry Revenue Share (%), by Price Trend Analysis 2025 & 2033
- Figure 190: South Africa Orange Industry Volume Share (%), by Price Trend Analysis 2025 & 2033
- Figure 191: South Africa Orange Industry Revenue (Million), by Country 2025 & 2033
- Figure 192: South Africa Orange Industry Volume (Kiloton), by Country 2025 & 2033
- Figure 193: South Africa Orange Industry Revenue Share (%), by Country 2025 & 2033
- Figure 194: South Africa Orange Industry Volume Share (%), by Country 2025 & 2033
- Figure 195: Indonesia Orange Industry Revenue (Million), by Production Analysis 2025 & 2033
- Figure 196: Indonesia Orange Industry Volume (Kiloton), by Production Analysis 2025 & 2033
- Figure 197: Indonesia Orange Industry Revenue Share (%), by Production Analysis 2025 & 2033
- Figure 198: Indonesia Orange Industry Volume Share (%), by Production Analysis 2025 & 2033
- Figure 199: Indonesia Orange Industry Revenue (Million), by Consumption Analysis 2025 & 2033
- Figure 200: Indonesia Orange Industry Volume (Kiloton), by Consumption Analysis 2025 & 2033
- Figure 201: Indonesia Orange Industry Revenue Share (%), by Consumption Analysis 2025 & 2033
- Figure 202: Indonesia Orange Industry Volume Share (%), by Consumption Analysis 2025 & 2033
- Figure 203: Indonesia Orange Industry Revenue (Million), by Import Market Analysis (Value & Volume) 2025 & 2033
- Figure 204: Indonesia Orange Industry Volume (Kiloton), by Import Market Analysis (Value & Volume) 2025 & 2033
- Figure 205: Indonesia Orange Industry Revenue Share (%), by Import Market Analysis (Value & Volume) 2025 & 2033
- Figure 206: Indonesia Orange Industry Volume Share (%), by Import Market Analysis (Value & Volume) 2025 & 2033
- Figure 207: Indonesia Orange Industry Revenue (Million), by Export Market Analysis (Value & Volume) 2025 & 2033
- Figure 208: Indonesia Orange Industry Volume (Kiloton), by Export Market Analysis (Value & Volume) 2025 & 2033
- Figure 209: Indonesia Orange Industry Revenue Share (%), by Export Market Analysis (Value & Volume) 2025 & 2033
- Figure 210: Indonesia Orange Industry Volume Share (%), by Export Market Analysis (Value & Volume) 2025 & 2033
- Figure 211: Indonesia Orange Industry Revenue (Million), by Price Trend Analysis 2025 & 2033
- Figure 212: Indonesia Orange Industry Volume (Kiloton), by Price Trend Analysis 2025 & 2033
- Figure 213: Indonesia Orange Industry Revenue Share (%), by Price Trend Analysis 2025 & 2033
- Figure 214: Indonesia Orange Industry Volume Share (%), by Price Trend Analysis 2025 & 2033
- Figure 215: Indonesia Orange Industry Revenue (Million), by Country 2025 & 2033
- Figure 216: Indonesia Orange Industry Volume (Kiloton), by Country 2025 & 2033
- Figure 217: Indonesia Orange Industry Revenue Share (%), by Country 2025 & 2033
- Figure 218: Indonesia Orange Industry Volume Share (%), by Country 2025 & 2033
- Figure 219: Turkey Orange Industry Revenue (Million), by Production Analysis 2025 & 2033
- Figure 220: Turkey Orange Industry Volume (Kiloton), by Production Analysis 2025 & 2033
- Figure 221: Turkey Orange Industry Revenue Share (%), by Production Analysis 2025 & 2033
- Figure 222: Turkey Orange Industry Volume Share (%), by Production Analysis 2025 & 2033
- Figure 223: Turkey Orange Industry Revenue (Million), by Consumption Analysis 2025 & 2033
- Figure 224: Turkey Orange Industry Volume (Kiloton), by Consumption Analysis 2025 & 2033
- Figure 225: Turkey Orange Industry Revenue Share (%), by Consumption Analysis 2025 & 2033
- Figure 226: Turkey Orange Industry Volume Share (%), by Consumption Analysis 2025 & 2033
- Figure 227: Turkey Orange Industry Revenue (Million), by Import Market Analysis (Value & Volume) 2025 & 2033
- Figure 228: Turkey Orange Industry Volume (Kiloton), by Import Market Analysis (Value & Volume) 2025 & 2033
- Figure 229: Turkey Orange Industry Revenue Share (%), by Import Market Analysis (Value & Volume) 2025 & 2033
- Figure 230: Turkey Orange Industry Volume Share (%), by Import Market Analysis (Value & Volume) 2025 & 2033
- Figure 231: Turkey Orange Industry Revenue (Million), by Export Market Analysis (Value & Volume) 2025 & 2033
- Figure 232: Turkey Orange Industry Volume (Kiloton), by Export Market Analysis (Value & Volume) 2025 & 2033
- Figure 233: Turkey Orange Industry Revenue Share (%), by Export Market Analysis (Value & Volume) 2025 & 2033
- Figure 234: Turkey Orange Industry Volume Share (%), by Export Market Analysis (Value & Volume) 2025 & 2033
- Figure 235: Turkey Orange Industry Revenue (Million), by Price Trend Analysis 2025 & 2033
- Figure 236: Turkey Orange Industry Volume (Kiloton), by Price Trend Analysis 2025 & 2033
- Figure 237: Turkey Orange Industry Revenue Share (%), by Price Trend Analysis 2025 & 2033
- Figure 238: Turkey Orange Industry Volume Share (%), by Price Trend Analysis 2025 & 2033
- Figure 239: Turkey Orange Industry Revenue (Million), by Country 2025 & 2033
- Figure 240: Turkey Orange Industry Volume (Kiloton), by Country 2025 & 2033
- Figure 241: Turkey Orange Industry Revenue Share (%), by Country 2025 & 2033
- Figure 242: Turkey Orange Industry Volume Share (%), by Country 2025 & 2033
List of Tables
- Table 1: Global Orange Industry Revenue Million Forecast, by Production Analysis 2020 & 2033
- Table 2: Global Orange Industry Volume Kiloton Forecast, by Production Analysis 2020 & 2033
- Table 3: Global Orange Industry Revenue Million Forecast, by Consumption Analysis 2020 & 2033
- Table 4: Global Orange Industry Volume Kiloton Forecast, by Consumption Analysis 2020 & 2033
- Table 5: Global Orange Industry Revenue Million Forecast, by Import Market Analysis (Value & Volume) 2020 & 2033
- Table 6: Global Orange Industry Volume Kiloton Forecast, by Import Market Analysis (Value & Volume) 2020 & 2033
- Table 7: Global Orange Industry Revenue Million Forecast, by Export Market Analysis (Value & Volume) 2020 & 2033
- Table 8: Global Orange Industry Volume Kiloton Forecast, by Export Market Analysis (Value & Volume) 2020 & 2033
- Table 9: Global Orange Industry Revenue Million Forecast, by Price Trend Analysis 2020 & 2033
- Table 10: Global Orange Industry Volume Kiloton Forecast, by Price Trend Analysis 2020 & 2033
- Table 11: Global Orange Industry Revenue Million Forecast, by Region 2020 & 2033
- Table 12: Global Orange Industry Volume Kiloton Forecast, by Region 2020 & 2033
- Table 13: Global Orange Industry Revenue Million Forecast, by Production Analysis 2020 & 2033
- Table 14: Global Orange Industry Volume Kiloton Forecast, by Production Analysis 2020 & 2033
- Table 15: Global Orange Industry Revenue Million Forecast, by Consumption Analysis 2020 & 2033
- Table 16: Global Orange Industry Volume Kiloton Forecast, by Consumption Analysis 2020 & 2033
- Table 17: Global Orange Industry Revenue Million Forecast, by Import Market Analysis (Value & Volume) 2020 & 2033
- Table 18: Global Orange Industry Volume Kiloton Forecast, by Import Market Analysis (Value & Volume) 2020 & 2033
- Table 19: Global Orange Industry Revenue Million Forecast, by Export Market Analysis (Value & Volume) 2020 & 2033
- Table 20: Global Orange Industry Volume Kiloton Forecast, by Export Market Analysis (Value & Volume) 2020 & 2033
- Table 21: Global Orange Industry Revenue Million Forecast, by Price Trend Analysis 2020 & 2033
- Table 22: Global Orange Industry Volume Kiloton Forecast, by Price Trend Analysis 2020 & 2033
- Table 23: Global Orange Industry Revenue Million Forecast, by Country 2020 & 2033
- Table 24: Global Orange Industry Volume Kiloton Forecast, by Country 2020 & 2033
- Table 25: Global Orange Industry Revenue Million Forecast, by Production Analysis 2020 & 2033
- Table 26: Global Orange Industry Volume Kiloton Forecast, by Production Analysis 2020 & 2033
- Table 27: Global Orange Industry Revenue Million Forecast, by Consumption Analysis 2020 & 2033
- Table 28: Global Orange Industry Volume Kiloton Forecast, by Consumption Analysis 2020 & 2033
- Table 29: Global Orange Industry Revenue Million Forecast, by Import Market Analysis (Value & Volume) 2020 & 2033
- Table 30: Global Orange Industry Volume Kiloton Forecast, by Import Market Analysis (Value & Volume) 2020 & 2033
- Table 31: Global Orange Industry Revenue Million Forecast, by Export Market Analysis (Value & Volume) 2020 & 2033
- Table 32: Global Orange Industry Volume Kiloton Forecast, by Export Market Analysis (Value & Volume) 2020 & 2033
- Table 33: Global Orange Industry Revenue Million Forecast, by Price Trend Analysis 2020 & 2033
- Table 34: Global Orange Industry Volume Kiloton Forecast, by Price Trend Analysis 2020 & 2033
- Table 35: Global Orange Industry Revenue Million Forecast, by Country 2020 & 2033
- Table 36: Global Orange Industry Volume Kiloton Forecast, by Country 2020 & 2033
- Table 37: Global Orange Industry Revenue Million Forecast, by Production Analysis 2020 & 2033
- Table 38: Global Orange Industry Volume Kiloton Forecast, by Production Analysis 2020 & 2033
- Table 39: Global Orange Industry Revenue Million Forecast, by Consumption Analysis 2020 & 2033
- Table 40: Global Orange Industry Volume Kiloton Forecast, by Consumption Analysis 2020 & 2033
- Table 41: Global Orange Industry Revenue Million Forecast, by Import Market Analysis (Value & Volume) 2020 & 2033
- Table 42: Global Orange Industry Volume Kiloton Forecast, by Import Market Analysis (Value & Volume) 2020 & 2033
- Table 43: Global Orange Industry Revenue Million Forecast, by Export Market Analysis (Value & Volume) 2020 & 2033
- Table 44: Global Orange Industry Volume Kiloton Forecast, by Export Market Analysis (Value & Volume) 2020 & 2033
- Table 45: Global Orange Industry Revenue Million Forecast, by Price Trend Analysis 2020 & 2033
- Table 46: Global Orange Industry Volume Kiloton Forecast, by Price Trend Analysis 2020 & 2033
- Table 47: Global Orange Industry Revenue Million Forecast, by Country 2020 & 2033
- Table 48: Global Orange Industry Volume Kiloton Forecast, by Country 2020 & 2033
- Table 49: Global Orange Industry Revenue Million Forecast, by Production Analysis 2020 & 2033
- Table 50: Global Orange Industry Volume Kiloton Forecast, by Production Analysis 2020 & 2033
- Table 51: Global Orange Industry Revenue Million Forecast, by Consumption Analysis 2020 & 2033
- Table 52: Global Orange Industry Volume Kiloton Forecast, by Consumption Analysis 2020 & 2033
- Table 53: Global Orange Industry Revenue Million Forecast, by Import Market Analysis (Value & Volume) 2020 & 2033
- Table 54: Global Orange Industry Volume Kiloton Forecast, by Import Market Analysis (Value & Volume) 2020 & 2033
- Table 55: Global Orange Industry Revenue Million Forecast, by Export Market Analysis (Value & Volume) 2020 & 2033
- Table 56: Global Orange Industry Volume Kiloton Forecast, by Export Market Analysis (Value & Volume) 2020 & 2033
- Table 57: Global Orange Industry Revenue Million Forecast, by Price Trend Analysis 2020 & 2033
- Table 58: Global Orange Industry Volume Kiloton Forecast, by Price Trend Analysis 2020 & 2033
- Table 59: Global Orange Industry Revenue Million Forecast, by Country 2020 & 2033
- Table 60: Global Orange Industry Volume Kiloton Forecast, by Country 2020 & 2033
- Table 61: Global Orange Industry Revenue Million Forecast, by Production Analysis 2020 & 2033
- Table 62: Global Orange Industry Volume Kiloton Forecast, by Production Analysis 2020 & 2033
- Table 63: Global Orange Industry Revenue Million Forecast, by Consumption Analysis 2020 & 2033
- Table 64: Global Orange Industry Volume Kiloton Forecast, by Consumption Analysis 2020 & 2033
- Table 65: Global Orange Industry Revenue Million Forecast, by Import Market Analysis (Value & Volume) 2020 & 2033
- Table 66: Global Orange Industry Volume Kiloton Forecast, by Import Market Analysis (Value & Volume) 2020 & 2033
- Table 67: Global Orange Industry Revenue Million Forecast, by Export Market Analysis (Value & Volume) 2020 & 2033
- Table 68: Global Orange Industry Volume Kiloton Forecast, by Export Market Analysis (Value & Volume) 2020 & 2033
- Table 69: Global Orange Industry Revenue Million Forecast, by Price Trend Analysis 2020 & 2033
- Table 70: Global Orange Industry Volume Kiloton Forecast, by Price Trend Analysis 2020 & 2033
- Table 71: Global Orange Industry Revenue Million Forecast, by Country 2020 & 2033
- Table 72: Global Orange Industry Volume Kiloton Forecast, by Country 2020 & 2033
- Table 73: Global Orange Industry Revenue Million Forecast, by Production Analysis 2020 & 2033
- Table 74: Global Orange Industry Volume Kiloton Forecast, by Production Analysis 2020 & 2033
- Table 75: Global Orange Industry Revenue Million Forecast, by Consumption Analysis 2020 & 2033
- Table 76: Global Orange Industry Volume Kiloton Forecast, by Consumption Analysis 2020 & 2033
- Table 77: Global Orange Industry Revenue Million Forecast, by Import Market Analysis (Value & Volume) 2020 & 2033
- Table 78: Global Orange Industry Volume Kiloton Forecast, by Import Market Analysis (Value & Volume) 2020 & 2033
- Table 79: Global Orange Industry Revenue Million Forecast, by Export Market Analysis (Value & Volume) 2020 & 2033
- Table 80: Global Orange Industry Volume Kiloton Forecast, by Export Market Analysis (Value & Volume) 2020 & 2033
- Table 81: Global Orange Industry Revenue Million Forecast, by Price Trend Analysis 2020 & 2033
- Table 82: Global Orange Industry Volume Kiloton Forecast, by Price Trend Analysis 2020 & 2033
- Table 83: Global Orange Industry Revenue Million Forecast, by Country 2020 & 2033
- Table 84: Global Orange Industry Volume Kiloton Forecast, by Country 2020 & 2033
- Table 85: Global Orange Industry Revenue Million Forecast, by Production Analysis 2020 & 2033
- Table 86: Global Orange Industry Volume Kiloton Forecast, by Production Analysis 2020 & 2033
- Table 87: Global Orange Industry Revenue Million Forecast, by Consumption Analysis 2020 & 2033
- Table 88: Global Orange Industry Volume Kiloton Forecast, by Consumption Analysis 2020 & 2033
- Table 89: Global Orange Industry Revenue Million Forecast, by Import Market Analysis (Value & Volume) 2020 & 2033
- Table 90: Global Orange Industry Volume Kiloton Forecast, by Import Market Analysis (Value & Volume) 2020 & 2033
- Table 91: Global Orange Industry Revenue Million Forecast, by Export Market Analysis (Value & Volume) 2020 & 2033
- Table 92: Global Orange Industry Volume Kiloton Forecast, by Export Market Analysis (Value & Volume) 2020 & 2033
- Table 93: Global Orange Industry Revenue Million Forecast, by Price Trend Analysis 2020 & 2033
- Table 94: Global Orange Industry Volume Kiloton Forecast, by Price Trend Analysis 2020 & 2033
- Table 95: Global Orange Industry Revenue Million Forecast, by Country 2020 & 2033
- Table 96: Global Orange Industry Volume Kiloton Forecast, by Country 2020 & 2033
- Table 97: Global Orange Industry Revenue Million Forecast, by Production Analysis 2020 & 2033
- Table 98: Global Orange Industry Volume Kiloton Forecast, by Production Analysis 2020 & 2033
- Table 99: Global Orange Industry Revenue Million Forecast, by Consumption Analysis 2020 & 2033
- Table 100: Global Orange Industry Volume Kiloton Forecast, by Consumption Analysis 2020 & 2033
- Table 101: Global Orange Industry Revenue Million Forecast, by Import Market Analysis (Value & Volume) 2020 & 2033
- Table 102: Global Orange Industry Volume Kiloton Forecast, by Import Market Analysis (Value & Volume) 2020 & 2033
- Table 103: Global Orange Industry Revenue Million Forecast, by Export Market Analysis (Value & Volume) 2020 & 2033
- Table 104: Global Orange Industry Volume Kiloton Forecast, by Export Market Analysis (Value & Volume) 2020 & 2033
- Table 105: Global Orange Industry Revenue Million Forecast, by Price Trend Analysis 2020 & 2033
- Table 106: Global Orange Industry Volume Kiloton Forecast, by Price Trend Analysis 2020 & 2033
- Table 107: Global Orange Industry Revenue Million Forecast, by Country 2020 & 2033
- Table 108: Global Orange Industry Volume Kiloton Forecast, by Country 2020 & 2033
- Table 109: Global Orange Industry Revenue Million Forecast, by Production Analysis 2020 & 2033
- Table 110: Global Orange Industry Volume Kiloton Forecast, by Production Analysis 2020 & 2033
- Table 111: Global Orange Industry Revenue Million Forecast, by Consumption Analysis 2020 & 2033
- Table 112: Global Orange Industry Volume Kiloton Forecast, by Consumption Analysis 2020 & 2033
- Table 113: Global Orange Industry Revenue Million Forecast, by Import Market Analysis (Value & Volume) 2020 & 2033
- Table 114: Global Orange Industry Volume Kiloton Forecast, by Import Market Analysis (Value & Volume) 2020 & 2033
- Table 115: Global Orange Industry Revenue Million Forecast, by Export Market Analysis (Value & Volume) 2020 & 2033
- Table 116: Global Orange Industry Volume Kiloton Forecast, by Export Market Analysis (Value & Volume) 2020 & 2033
- Table 117: Global Orange Industry Revenue Million Forecast, by Price Trend Analysis 2020 & 2033
- Table 118: Global Orange Industry Volume Kiloton Forecast, by Price Trend Analysis 2020 & 2033
- Table 119: Global Orange Industry Revenue Million Forecast, by Country 2020 & 2033
- Table 120: Global Orange Industry Volume Kiloton Forecast, by Country 2020 & 2033
- Table 121: Global Orange Industry Revenue Million Forecast, by Production Analysis 2020 & 2033
- Table 122: Global Orange Industry Volume Kiloton Forecast, by Production Analysis 2020 & 2033
- Table 123: Global Orange Industry Revenue Million Forecast, by Consumption Analysis 2020 & 2033
- Table 124: Global Orange Industry Volume Kiloton Forecast, by Consumption Analysis 2020 & 2033
- Table 125: Global Orange Industry Revenue Million Forecast, by Import Market Analysis (Value & Volume) 2020 & 2033
- Table 126: Global Orange Industry Volume Kiloton Forecast, by Import Market Analysis (Value & Volume) 2020 & 2033
- Table 127: Global Orange Industry Revenue Million Forecast, by Export Market Analysis (Value & Volume) 2020 & 2033
- Table 128: Global Orange Industry Volume Kiloton Forecast, by Export Market Analysis (Value & Volume) 2020 & 2033
- Table 129: Global Orange Industry Revenue Million Forecast, by Price Trend Analysis 2020 & 2033
- Table 130: Global Orange Industry Volume Kiloton Forecast, by Price Trend Analysis 2020 & 2033
- Table 131: Global Orange Industry Revenue Million Forecast, by Country 2020 & 2033
- Table 132: Global Orange Industry Volume Kiloton Forecast, by Country 2020 & 2033
Frequently Asked Questions
1. What is the projected Compound Annual Growth Rate (CAGR) of the Orange Industry?
The projected CAGR is approximately 4.53%.
2. Which companies are prominent players in the Orange Industry?
Key companies in the market include The Coca-Cola Company , PepsiCo , Minute Maid, Tropicana Products, Inc. , Florida's Natural Growers.
3. What are the main segments of the Orange Industry?
The market segments include Production Analysis, Consumption Analysis, Import Market Analysis (Value & Volume), Export Market Analysis (Value & Volume), Price Trend Analysis.
4. Can you provide details about the market size?
The market size is estimated to be USD 3.84 Million as of 2022.
5. What are some drivers contributing to market growth?
Rising Consumption of Cashew Nuts as a Healthy Snack; Increasing Government initiatives; Growing Cashew Nut Imports in The United States.
6. What are the notable trends driving market growth?
Growing Seasonal Consumption of Orange.
7. Are there any restraints impacting market growth?
Hazardous Climatic Condition Hinders Cashew Production; Stringent Regulations Related To Food Quality Standards.
8. Can you provide examples of recent developments in the market?
November 2022: Arunachal Pradesh Agriculture Marketing Board exported the first 6 metric tons of oranges consignment to the UAE and Qatar in collaboration with the Agricultural and Processed Food Products Export Development Authority, the central government, and the Dubai-based Lulu Group International. The oranges will be launched at the Lulu Group's hypermarkets in the UAE and Qatar.
9. What pricing options are available for accessing the report?
Pricing options include single-user, multi-user, and enterprise licenses priced at USD 4750, USD 5250, and USD 8750 respectively.
10. Is the market size provided in terms of value or volume?
The market size is provided in terms of value, measured in Million and volume, measured in Kiloton.
11. Are there any specific market keywords associated with the report?
Yes, the market keyword associated with the report is "Orange Industry," which aids in identifying and referencing the specific market segment covered.
12. How do I determine which pricing option suits my needs best?
The pricing options vary based on user requirements and access needs. Individual users may opt for single-user licenses, while businesses requiring broader access may choose multi-user or enterprise licenses for cost-effective access to the report.
13. Are there any additional resources or data provided in the Orange Industry report?
While the report offers comprehensive insights, it's advisable to review the specific contents or supplementary materials provided to ascertain if additional resources or data are available.
14. How can I stay updated on further developments or reports in the Orange Industry?
To stay informed about further developments, trends, and reports in the Orange Industry, consider subscribing to industry newsletters, following relevant companies and organizations, or regularly checking reputable industry news sources and publications.
Methodology
Step 1 - Identification of Relevant Samples Size from Population Database


Step 2 - Approaches for Defining Global Market Size (Value, Volume* & Price*)

Note*: In applicable scenarios
Step 3 - Data Sources
Primary Research
- Web Analytics
- Survey Reports
- Research Institute
- Latest Research Reports
- Opinion Leaders
Secondary Research
- Annual Reports
- White Paper
- Latest Press Release
- Industry Association
- Paid Database
- Investor Presentations

Step 4 - Data Triangulation
Involves using different sources of information in order to increase the validity of a study
These sources are likely to be stakeholders in a program - participants, other researchers, program staff, other community members, and so on.
Then we put all data in single framework & apply various statistical tools to find out the dynamic on the market.
During the analysis stage, feedback from the stakeholder groups would be compared to determine areas of agreement as well as areas of divergence