

Key Insights
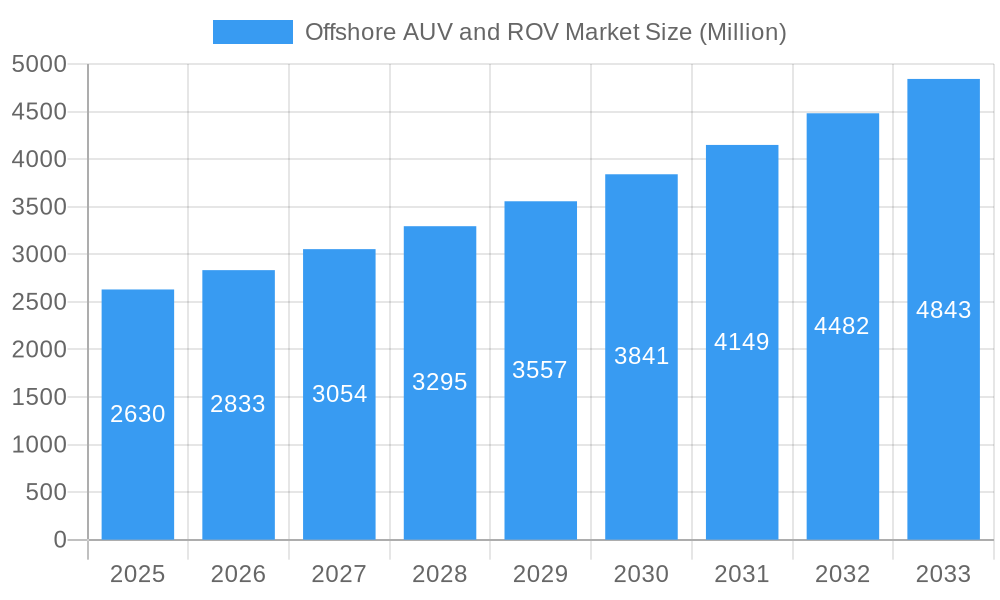
The offshore AUV (Autonomous Underwater Vehicle) and ROV (Remotely Operated Vehicle) market is experiencing robust growth, projected to reach \$2.63 billion in 2025 and maintain a healthy Compound Annual Growth Rate (CAGR) of 7.69% from 2025 to 2033. This expansion is fueled by several key drivers. The increasing demand for subsea infrastructure development and maintenance within the oil and gas sector is a primary catalyst. Exploration and production activities in deeper waters necessitate the use of advanced AUVs and ROVs for tasks like pipeline inspection, subsea well intervention, and seabed mapping, driving market growth. Furthermore, the growing adoption of AUVs and ROVs in the defense and research sectors, for tasks such as mine countermeasures, oceanographic studies, and underwater surveillance, contributes significantly to market expansion. Technological advancements, including enhanced sensor capabilities, improved navigation systems, and the development of more robust and versatile platforms, are further accelerating market growth. The segment comprising work-class and heavy work-class ROVs, particularly observatory-class vehicles, holds significant market share due to their capacity for complex and demanding tasks. Geographically, North America and Europe currently dominate the market, but the Asia-Pacific region is poised for significant growth, driven by increasing offshore energy exploration and infrastructure projects.
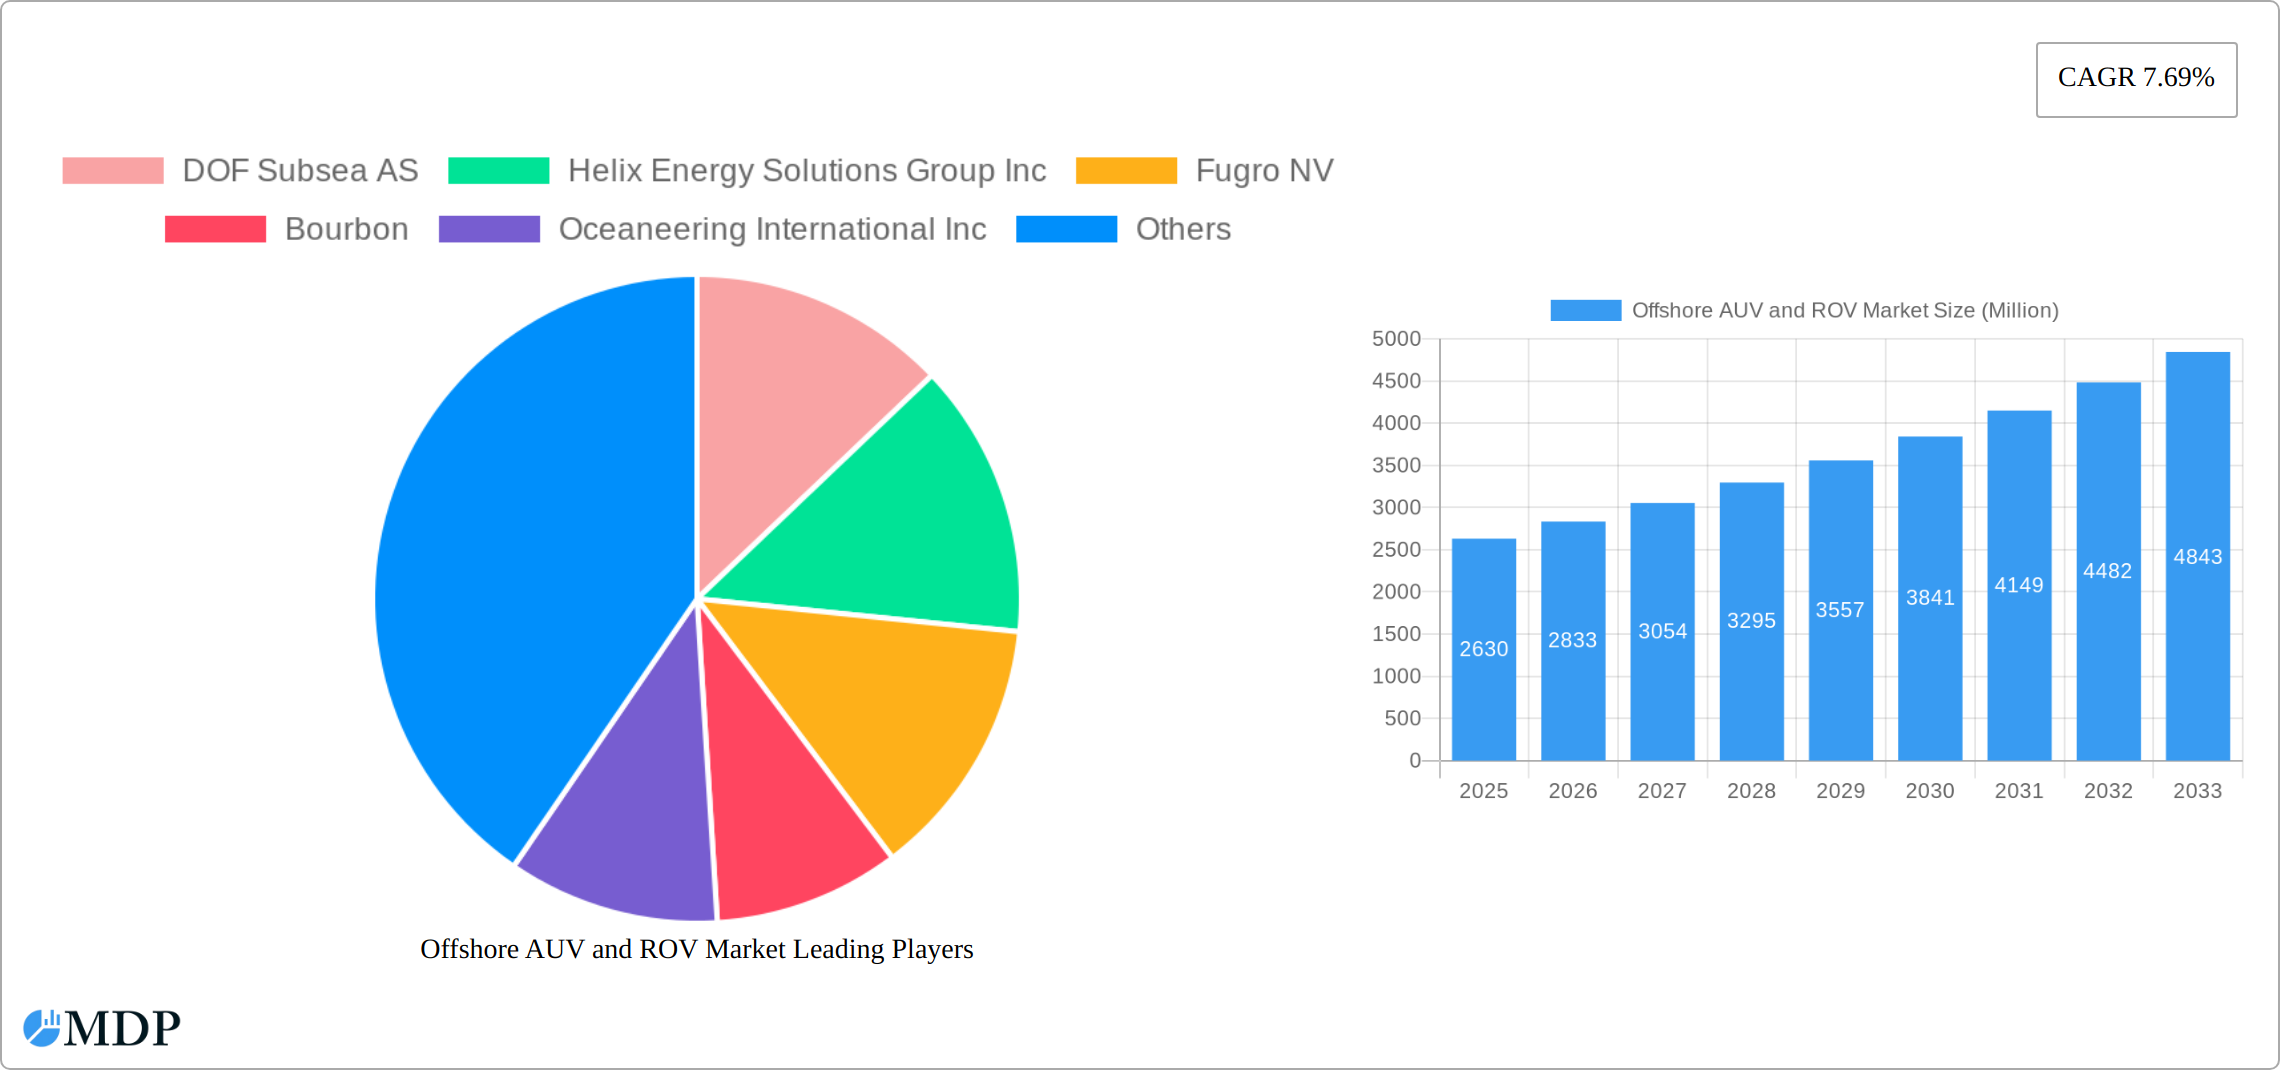
Offshore AUV and ROV Market Market Size (In Billion)
The market's growth trajectory is expected to continue, primarily due to ongoing investments in offshore energy infrastructure, growing interest in renewable energy exploration, and sustained demand from government and research institutions for subsea exploration and monitoring. However, potential restraints include the high initial investment cost associated with AUV and ROV technology and the need for specialized skilled personnel for operation and maintenance. Nonetheless, technological advancements and the potential for cost reduction through automation and standardization are anticipated to mitigate these challenges. The market segmentation by vehicle type (AUV vs. ROV), vehicle class (work-class, heavy work-class, observatory-class), end-user application (oil and gas, defense, research), and activity (drilling, construction, inspection, maintenance) provides a granular understanding of market dynamics and helps companies strategically target specific niches. Companies such as DOF Subsea AS, Helix Energy Solutions Group Inc., Fugro NV, and Oceaneering International Inc. are key players, shaping the competitive landscape through innovation and strategic acquisitions.
Offshore AUV and ROV Market Company Market Share
Dive Deep into the Offshore AUV and ROV Market: A Comprehensive Report (2019-2033)
This insightful report provides a detailed analysis of the dynamic Offshore AUV and ROV Market, offering invaluable data and strategic insights for industry stakeholders. Covering the period from 2019 to 2033, with a focus on 2025, this report is your essential guide to understanding market trends, competitive landscapes, and future growth opportunities. The market is projected to reach xx Million by 2033, exhibiting a compelling CAGR of xx% during the forecast period (2025-2033).
Offshore AUV and ROV Market Market Dynamics & Concentration
The offshore AUV and ROV sector is characterized by a dynamic competitive landscape, driven by rapid technological innovation, evolving regulatory frameworks, and shifting end-user demands. The market exhibits a moderately concentrated structure, with established industry leaders holding substantial market share. However, this is increasingly being challenged by the emergence of agile, specialized companies introducing disruptive technologies. The ongoing pursuit of enhanced operational efficiency, reduced costs, and improved safety in demanding subsea environments is a primary catalyst for market evolution.
-
Market Concentration: The top five key players, including DOF Subsea AS, Helix Energy Solutions Group Inc, Fugro NV, Bourbon, and Oceaneering International Inc, are projected to collectively hold an estimated [Insert Data]% of the market share in 2025. This share is anticipated to experience a marginal decrease to [Insert Data]% by 2033, a trend attributable to the expanding competitive base and the growing capabilities of emerging players.
-
Innovation Drivers: The relentless pursuit of technological advancements in AUV and ROV capabilities is a pivotal driver. This includes leaps in enhanced autonomy, sophisticated sensor technology (such as advanced sonar, Lidar, and optical imaging), and the integration of artificial intelligence for data analysis and decision-making. The imperative for higher operational efficiency, extended mission endurance, and minimized downtime in complex offshore operations directly fuels this innovation pipeline.
-
Regulatory Frameworks: Stringent safety regulations, driven by the inherent risks of offshore operations, alongside growing environmental concerns, are significantly shaping market dynamics. Compliance with international and regional standards, coupled with rigorous certification processes, directly influences operational costs and the pace of technology adoption. Emerging regulations concerning emissions reduction, underwater noise pollution mitigation, and marine ecosystem protection will continue to be influential factors in the market's trajectory.
-
Product Substitutes: While direct substitutes for the full suite of AUV and ROV functionalities are limited, alternative technologies for specific subsea tasks, such as remotely operated surface vehicles (ROSVs) for certain survey and inspection activities, may present some competitive pressure. The unique capabilities of AUVs and ROVs in terms of depth, autonomy, and data acquisition continue to position them as indispensable tools for many offshore applications.
-
End-User Trends: The burgeoning demand for subsea infrastructure development and maintenance across diverse sectors, including oil and gas, defense, and scientific research, is a primary growth engine. A significant emerging trend is the rapid expansion of the offshore renewable energy sector, particularly offshore wind farms. These projects necessitate extensive subsea surveys, installation support, and ongoing inspection and maintenance, creating substantial new opportunities for AUV and ROV deployment.
-
M&A Activities: The Offshore AUV and ROV market has experienced a discernible level of mergers and acquisitions (M&A) activity in recent years. The number of documented deals is estimated at [Insert Data] within the historical period (2019-2024), with primary motivations stemming from strategic market expansion, the acquisition of cutting-edge technologies, and the consolidation of service offerings. While this trend is expected to persist, the pace may moderate in the forecast period as the market matures.
Offshore AUV and ROV Market Industry Trends & Analysis
The global offshore AUV and ROV market is experiencing robust growth, driven by increasing offshore exploration and production activities, coupled with technological advancements. The market's trajectory is influenced by several key factors:
The market growth is significantly influenced by technological advancements such as the development of more robust and versatile AUVs and ROVs, integration of advanced sensors and AI, and improved communication technologies. The increasing adoption of AUVs for autonomous operations, particularly in inspection and survey tasks, is a notable trend. The industry is also moving towards the development of hybrid ROVs that combine the advantages of both ROVs and AUVs. Consumer preferences are shifting towards more efficient, reliable, and environmentally friendly solutions, further propelling innovation in this space. Competitive dynamics are fierce, with established players and new entrants continuously vying for market share through strategic partnerships, technological innovations, and cost-effective solutions. This competitive pressure drives efficiency improvements and enhances the quality of services. The market is expected to continue its robust growth trajectory, driven by technological advancements, expansion of offshore energy exploration, and heightened demand for subsea infrastructure development and maintenance.
Leading Markets & Segments in Offshore AUV and ROV Market
The offshore AUV and ROV market demonstrates regional variations in growth and segment dominance. While the exact figures require further analysis, here’s a projection:
Dominant Region: The North American region is expected to dominate the market in 2025, driven by robust activity in the oil and gas sector and increasing investments in offshore renewable energy. This dominance is projected to persist throughout the forecast period.
Dominant Country: Within North America, the United States is expected to remain the dominant market due to its large offshore energy infrastructure and significant investments in research and development.
Dominant Vehicle Type: ROVs are expected to account for a larger market share compared to AUVs in 2025, driven by their versatility and proven operational capability.
Dominant Vehicle Class: Work-class ROVs are expected to dominate the market due to their capabilities for diverse subsea tasks.
Dominant End-User Application: The oil and gas sector will remain the primary driver of demand in 2025, although the defense and research sectors are projected to witness substantial growth.
Dominant Activity: Inspection, Repair, and Maintenance (IRM) operations will continue to be the major application for AUVs and ROVs in 2025, contributing to the larger share of market revenue.
Key Drivers for Dominant Segments:
- Oil and Gas: High levels of offshore oil and gas exploration and production activities, particularly in North America and the Middle East.
- North America: Strong economic activity, substantial investments in energy infrastructure, and a well-established offshore oil and gas industry.
- Work-Class ROVs: Versatility to perform a wide range of subsea tasks, established operational history, and a larger installed base.
- IRM: Consistent need for subsea inspection, repair, and maintenance throughout the lifecycle of offshore assets.
Offshore AUV and ROV Market Product Developments
Recent years have witnessed a surge of significant advancements in AUV and ROV technologies, with a concentrated focus on amplifying autonomy, refining sensor integration, and bolstering overall operational efficiency. These advancements encompass sophisticated improvements in navigation and precise positioning systems, enhanced manipulator dexterity for delicate tasks, and the integration of next-generation imaging and sensing capabilities for superior data collection. The development and increasing adoption of hybrid AUV-ROV systems are also noteworthy, effectively merging the distinct advantages of both platforms. The industry trend is leaning towards modular and adaptable designs, enabling greater flexibility to cater to a wide spectrum of operational requirements and diverse environmental conditions. These continuous technological leaps are directly translating into increased operational efficiency, substantial reductions in overall operational costs, and significantly improved safety standards, thereby enhancing the market appeal and utility of these critical subsea systems.
Key Drivers of Offshore AUV and ROV Market Growth
The sustained expansion of the Offshore AUV and ROV market is propelled by a confluence of compelling factors:
- Technological Advancements: The ongoing and rapid development of increasingly sophisticated and autonomous underwater vehicles, equipped with state-of-the-art sensors, advanced AI algorithms, and enhanced communication protocols, serves as a primary catalyst for market growth.
- Rising Demand for Offshore Energy: The intensified global exploration and production activities within the offshore oil and gas sector continue to drive robust demand. Concurrently, the accelerating growth of the offshore wind energy sector, with its extensive subsea infrastructure requirements, is opening up substantial new avenues for AUV and ROV deployment.
- Government Initiatives: Supportive government policies, dedicated funding for offshore exploration and infrastructure development, and a growing emphasis on marine scientific research worldwide are providing significant impetus to market expansion.
Challenges in the Offshore AUV and ROV Market Market
Several factors pose challenges to the Offshore AUV and ROV market's growth:
- High Operational Costs: The deployment and maintenance of AUVs and ROVs can be expensive, limiting wider adoption. The cost of specialized equipment, skilled personnel, and specialized vessels significantly contribute to the overall operational expenditure.
- Environmental Concerns: Regulations aimed at mitigating the environmental impact of offshore operations pose challenges to AUV and ROV operations.
- Technological Limitations: Despite recent progress, technological limitations in terms of autonomy, endurance, and communication capabilities remain. Harsh underwater conditions and communication challenges continue to hinder widespread AUV and ROV deployment.
Emerging Opportunities in Offshore AUV and ROV Market
The long-term growth trajectory of the Offshore AUV and ROV market is poised for significant expansion, fueled by several key opportunities:
The market is expected to benefit from the continued development of more robust, reliable, and cost-effective AUV and ROV technologies. Particular emphasis will be placed on systems with enhanced autonomy for extended missions, superior sensor payloads for richer data acquisition, and advanced communication capabilities for real-time data transfer. Strategic partnerships and collaborations between leading technology providers and key end-users are anticipated to play a crucial role in accelerating market penetration and fostering innovation. The increasing integration of AUVs and ROVs in the development and maintenance of offshore renewable energy infrastructure, especially offshore wind farms, presents a significant and growing opportunity. Furthermore, the expansion of these technologies into new and emerging applications, such as underwater archaeology, deep-sea mining exploration, and advanced marine scientific research, will also contribute substantially to the market's overall growth.
Leading Players in the Offshore AUV and ROV Market Sector
Key Milestones in Offshore AUV and ROV Market Industry
-
January 2024: DeepTech announced the successful acquisition of a three-year contract with BP Plc for comprehensive ROV services in Egypt's West Nile Delta. This significant contract underscores the escalating demand for advanced ROV capabilities in critical offshore drilling and subsea operational support.
-
October 2022: Oceaneering's Subsea Robotics segment reported securing a series of valuable contracts, collectively valued at approximately USD 300 Million. This substantial contract award signifies robust market activity and a high level of demand for integrated ROV and AUV services.
-
May 2022: The Gujarat Police in India made a notable adoption of ROV technology for critical underwater recovery operations. This development highlights the expanding application scope of ROVs beyond their traditional dominance in the oil and gas sector, demonstrating their versatility in public safety and search-and-rescue missions.
Strategic Outlook for Offshore AUV and ROV Market Market
The future of the Offshore AUV and ROV market looks promising, fueled by continuous technological innovation, expanding applications beyond the traditional oil and gas industry, and increasing government support for offshore exploration and renewable energy projects. Strategic partnerships and collaborations among technology providers, operators, and research institutions are expected to accelerate market growth. The market is poised for significant expansion, with opportunities for both established players and new entrants to capitalize on the increasing demand for advanced subsea technologies.
Offshore AUV and ROV Market Segmentation
-
1. Vehicle Type
- 1.1. ROV
- 1.2. AUV
-
2. Vehicle Class
-
2.1. Work-class Vehicle
- 2.1.1. Light Work-class Vehicle
- 2.1.2. Medium Work-class Vehicle
- 2.1.3. Heavy Work-class Vehicle
- 2.2. Observatory-class Vehicles
-
2.1. Work-class Vehicle
-
3. End-user Application
- 3.1. Oil and Gas
- 3.2. Defense
- 3.3. Research
- 3.4. Other End-user Applications
-
4. Activity
- 4.1. Drilling and Development
- 4.2. Construction
- 4.3. Inspection, Repair, and Maintenance
- 4.4. Decommissioning
- 4.5. Other Activities
Offshore AUV and ROV Market Segmentation By Geography
-
1. North America
- 1.1. United States
- 1.2. Canada
- 1.3. Mexico
-
2. Europe
- 2.1. Germany
- 2.2. United Kingdom
- 2.3. Denmark
- 2.4. Norway
- 2.5. Russia
- 2.6. France
- 2.7. Rest of Europe
-
3. Asia Pacific
- 3.1. China
- 3.2. India
- 3.3. ASEAN Countries
- 3.4. Rest of Asia Pacific
-
4. South America
- 4.1. Brazil
- 4.2. Venezuela
- 4.3. Argentina
- 4.4. Colombia
- 4.5. Rest of South America
-
5. Middle East and Africa
- 5.1. Saudi Arabia
- 5.2. United Arab Emirates
- 5.3. Qatar
- 5.4. Nigeria
- 5.5. Rest of Middle East and Africa
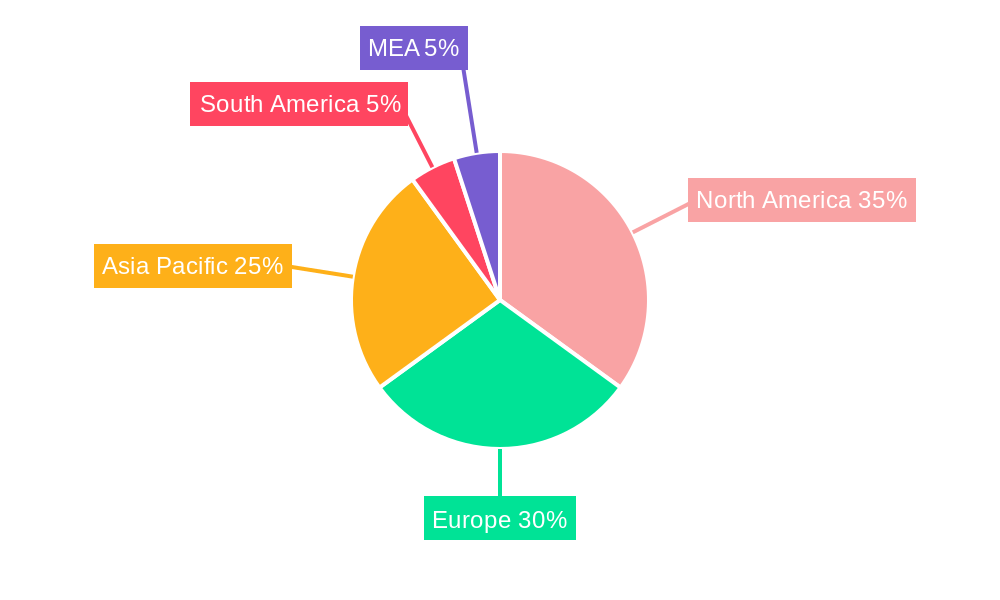
Offshore AUV and ROV Market Regional Market Share
Geographic Coverage of Offshore AUV and ROV Market
Offshore AUV and ROV Market REPORT HIGHLIGHTS
| Aspects | Details |
|---|---|
| Study Period | 2020-2034 |
| Base Year | 2025 |
| Estimated Year | 2026 |
| Forecast Period | 2026-2034 |
| Historical Period | 2020-2025 |
| Growth Rate | CAGR of 7.69% from 2020-2034 |
| Segmentation |
|
Table of Contents
- 1. Introduction
- 1.1. Research Scope
- 1.2. Market Segmentation
- 1.3. Research Objective
- 1.4. Definitions and Assumptions
- 2. Executive Summary
- 2.1. Market Snapshot
- 3. Market Dynamics
- 3.1. Market Drivers
- 3.2. Market Restrains
- 3.3. Market Trends
- 3.4. Market Opportunities
- 4. Market Factor Analysis
- 4.1. Porters Five Forces
- 4.1.1. Bargaining Power of Suppliers
- 4.1.2. Bargaining Power of Buyers
- 4.1.3. Threat of New Entrants
- 4.1.4. Threat of Substitutes
- 4.1.5. Competitive Rivalry
- 4.2. PESTEL analysis
- 4.3. BCG Analysis
- 4.3.1. Stars (High Growth, High Market Share)
- 4.3.2. Cash Cows (Low Growth, High Market Share)
- 4.3.3. Question Mark (High Growth, Low Market Share)
- 4.3.4. Dogs (Low Growth, Low Market Share)
- 4.4. Ansoff Matrix Analysis
- 4.5. Supply Chain Analysis
- 4.6. Regulatory Landscape
- 4.7. Current Market Potential and Opportunity Assessment (TAM–SAM–SOM Framework)
- 4.8. MDP Analyst Note
- 4.1. Porters Five Forces
- 5. Market Analysis, Insights and Forecast 2021-2033
- 5.1. Market Analysis, Insights and Forecast - by Vehicle Type
- 5.1.1. ROV
- 5.1.2. AUV
- 5.2. Market Analysis, Insights and Forecast - by Vehicle Class
- 5.2.1. Work-class Vehicle
- 5.2.1.1. Light Work-class Vehicle
- 5.2.1.2. Medium Work-class Vehicle
- 5.2.1.3. Heavy Work-class Vehicle
- 5.2.2. Observatory-class Vehicles
- 5.2.1. Work-class Vehicle
- 5.3. Market Analysis, Insights and Forecast - by End-user Application
- 5.3.1. Oil and Gas
- 5.3.2. Defense
- 5.3.3. Research
- 5.3.4. Other End-user Applications
- 5.4. Market Analysis, Insights and Forecast - by Activity
- 5.4.1. Drilling and Development
- 5.4.2. Construction
- 5.4.3. Inspection, Repair, and Maintenance
- 5.4.4. Decommissioning
- 5.4.5. Other Activities
- 5.5. Market Analysis, Insights and Forecast - by Region
- 5.5.1. North America
- 5.5.2. Europe
- 5.5.3. Asia Pacific
- 5.5.4. South America
- 5.5.5. Middle East and Africa
- 5.1. Market Analysis, Insights and Forecast - by Vehicle Type
- 6. Global Offshore AUV and ROV Market Analysis, Insights and Forecast, 2021-2033
- 6.1. Market Analysis, Insights and Forecast - by Vehicle Type
- 6.1.1. ROV
- 6.1.2. AUV
- 6.2. Market Analysis, Insights and Forecast - by Vehicle Class
- 6.2.1. Work-class Vehicle
- 6.2.1.1. Light Work-class Vehicle
- 6.2.1.2. Medium Work-class Vehicle
- 6.2.1.3. Heavy Work-class Vehicle
- 6.2.2. Observatory-class Vehicles
- 6.2.1. Work-class Vehicle
- 6.3. Market Analysis, Insights and Forecast - by End-user Application
- 6.3.1. Oil and Gas
- 6.3.2. Defense
- 6.3.3. Research
- 6.3.4. Other End-user Applications
- 6.4. Market Analysis, Insights and Forecast - by Activity
- 6.4.1. Drilling and Development
- 6.4.2. Construction
- 6.4.3. Inspection, Repair, and Maintenance
- 6.4.4. Decommissioning
- 6.4.5. Other Activities
- 6.1. Market Analysis, Insights and Forecast - by Vehicle Type
- 7. North America Offshore AUV and ROV Market Analysis, Insights and Forecast, 2020-2032
- 7.1. Market Analysis, Insights and Forecast - by Vehicle Type
- 7.1.1. ROV
- 7.1.2. AUV
- 7.2. Market Analysis, Insights and Forecast - by Vehicle Class
- 7.2.1. Work-class Vehicle
- 7.2.1.1. Light Work-class Vehicle
- 7.2.1.2. Medium Work-class Vehicle
- 7.2.1.3. Heavy Work-class Vehicle
- 7.2.2. Observatory-class Vehicles
- 7.2.1. Work-class Vehicle
- 7.3. Market Analysis, Insights and Forecast - by End-user Application
- 7.3.1. Oil and Gas
- 7.3.2. Defense
- 7.3.3. Research
- 7.3.4. Other End-user Applications
- 7.4. Market Analysis, Insights and Forecast - by Activity
- 7.4.1. Drilling and Development
- 7.4.2. Construction
- 7.4.3. Inspection, Repair, and Maintenance
- 7.4.4. Decommissioning
- 7.4.5. Other Activities
- 7.1. Market Analysis, Insights and Forecast - by Vehicle Type
- 8. Europe Offshore AUV and ROV Market Analysis, Insights and Forecast, 2020-2032
- 8.1. Market Analysis, Insights and Forecast - by Vehicle Type
- 8.1.1. ROV
- 8.1.2. AUV
- 8.2. Market Analysis, Insights and Forecast - by Vehicle Class
- 8.2.1. Work-class Vehicle
- 8.2.1.1. Light Work-class Vehicle
- 8.2.1.2. Medium Work-class Vehicle
- 8.2.1.3. Heavy Work-class Vehicle
- 8.2.2. Observatory-class Vehicles
- 8.2.1. Work-class Vehicle
- 8.3. Market Analysis, Insights and Forecast - by End-user Application
- 8.3.1. Oil and Gas
- 8.3.2. Defense
- 8.3.3. Research
- 8.3.4. Other End-user Applications
- 8.4. Market Analysis, Insights and Forecast - by Activity
- 8.4.1. Drilling and Development
- 8.4.2. Construction
- 8.4.3. Inspection, Repair, and Maintenance
- 8.4.4. Decommissioning
- 8.4.5. Other Activities
- 8.1. Market Analysis, Insights and Forecast - by Vehicle Type
- 9. Asia Pacific Offshore AUV and ROV Market Analysis, Insights and Forecast, 2020-2032
- 9.1. Market Analysis, Insights and Forecast - by Vehicle Type
- 9.1.1. ROV
- 9.1.2. AUV
- 9.2. Market Analysis, Insights and Forecast - by Vehicle Class
- 9.2.1. Work-class Vehicle
- 9.2.1.1. Light Work-class Vehicle
- 9.2.1.2. Medium Work-class Vehicle
- 9.2.1.3. Heavy Work-class Vehicle
- 9.2.2. Observatory-class Vehicles
- 9.2.1. Work-class Vehicle
- 9.3. Market Analysis, Insights and Forecast - by End-user Application
- 9.3.1. Oil and Gas
- 9.3.2. Defense
- 9.3.3. Research
- 9.3.4. Other End-user Applications
- 9.4. Market Analysis, Insights and Forecast - by Activity
- 9.4.1. Drilling and Development
- 9.4.2. Construction
- 9.4.3. Inspection, Repair, and Maintenance
- 9.4.4. Decommissioning
- 9.4.5. Other Activities
- 9.1. Market Analysis, Insights and Forecast - by Vehicle Type
- 10. South America Offshore AUV and ROV Market Analysis, Insights and Forecast, 2020-2032
- 10.1. Market Analysis, Insights and Forecast - by Vehicle Type
- 10.1.1. ROV
- 10.1.2. AUV
- 10.2. Market Analysis, Insights and Forecast - by Vehicle Class
- 10.2.1. Work-class Vehicle
- 10.2.1.1. Light Work-class Vehicle
- 10.2.1.2. Medium Work-class Vehicle
- 10.2.1.3. Heavy Work-class Vehicle
- 10.2.2. Observatory-class Vehicles
- 10.2.1. Work-class Vehicle
- 10.3. Market Analysis, Insights and Forecast - by End-user Application
- 10.3.1. Oil and Gas
- 10.3.2. Defense
- 10.3.3. Research
- 10.3.4. Other End-user Applications
- 10.4. Market Analysis, Insights and Forecast - by Activity
- 10.4.1. Drilling and Development
- 10.4.2. Construction
- 10.4.3. Inspection, Repair, and Maintenance
- 10.4.4. Decommissioning
- 10.4.5. Other Activities
- 10.1. Market Analysis, Insights and Forecast - by Vehicle Type
- 11. Middle East and Africa Offshore AUV and ROV Market Analysis, Insights and Forecast, 2020-2032
- 11.1. Market Analysis, Insights and Forecast - by Vehicle Type
- 11.1.1. ROV
- 11.1.2. AUV
- 11.2. Market Analysis, Insights and Forecast - by Vehicle Class
- 11.2.1. Work-class Vehicle
- 11.2.1.1. Light Work-class Vehicle
- 11.2.1.2. Medium Work-class Vehicle
- 11.2.1.3. Heavy Work-class Vehicle
- 11.2.2. Observatory-class Vehicles
- 11.2.1. Work-class Vehicle
- 11.3. Market Analysis, Insights and Forecast - by End-user Application
- 11.3.1. Oil and Gas
- 11.3.2. Defense
- 11.3.3. Research
- 11.3.4. Other End-user Applications
- 11.4. Market Analysis, Insights and Forecast - by Activity
- 11.4.1. Drilling and Development
- 11.4.2. Construction
- 11.4.3. Inspection, Repair, and Maintenance
- 11.4.4. Decommissioning
- 11.4.5. Other Activities
- 11.1. Market Analysis, Insights and Forecast - by Vehicle Type
- 12. Competitive Analysis
- 12.1. Company Profiles
- 12.1.1 DOF Subsea AS
- 12.1.1.1. Company Overview
- 12.1.1.2. Products
- 12.1.1.3. Company Financials
- 12.1.1.4. SWOT Analysis
- 12.1.2 Helix Energy Solutions Group Inc
- 12.1.2.1. Company Overview
- 12.1.2.2. Products
- 12.1.2.3. Company Financials
- 12.1.2.4. SWOT Analysis
- 12.1.3 Fugro NV
- 12.1.3.1. Company Overview
- 12.1.3.2. Products
- 12.1.3.3. Company Financials
- 12.1.3.4. SWOT Analysis
- 12.1.4 Bourbon
- 12.1.4.1. Company Overview
- 12.1.4.2. Products
- 12.1.4.3. Company Financials
- 12.1.4.4. SWOT Analysis
- 12.1.5 Oceaneering International Inc
- 12.1.5.1. Company Overview
- 12.1.5.2. Products
- 12.1.5.3. Company Financials
- 12.1.5.4. SWOT Analysis
- 12.1.6 Saipem SpA
- 12.1.6.1. Company Overview
- 12.1.6.2. Products
- 12.1.6.3. Company Financials
- 12.1.6.4. SWOT Analysis
- 12.1.7 DeepOcean AS
- 12.1.7.1. Company Overview
- 12.1.7.2. Products
- 12.1.7.3. Company Financials
- 12.1.7.4. SWOT Analysis
- 12.1.8 Subsea 7 SA
- 12.1.8.1. Company Overview
- 12.1.8.2. Products
- 12.1.8.3. Company Financials
- 12.1.8.4. SWOT Analysis
- 12.1.9 Teledyne Technologies Incorporated*List Not Exhaustive
- 12.1.9.1. Company Overview
- 12.1.9.2. Products
- 12.1.9.3. Company Financials
- 12.1.9.4. SWOT Analysis
- 12.1.10 TechnipFMC PLC
- 12.1.10.1. Company Overview
- 12.1.10.2. Products
- 12.1.10.3. Company Financials
- 12.1.10.4. SWOT Analysis
- 12.1.1 DOF Subsea AS
- 12.2. Market Entropy
- 12.2.1 Company's Key Areas Served
- 12.2.2 Recent Developments
- 12.3. Company Market Share Analysis 2025
- 12.3.1 Top 5 Companies Market Share Analysis
- 12.3.2 Top 3 Companies Market Share Analysis
- 12.4. List of Potential Customers
- 13. Research Methodology
List of Figures
- Figure 1: Global Offshore AUV and ROV Market Revenue Breakdown (Million, %) by Region 2025 & 2033
- Figure 2: Global Offshore AUV and ROV Market Volume Breakdown (K Unit, %) by Region 2025 & 2033
- Figure 3: North America Offshore AUV and ROV Market Revenue (Million), by Vehicle Type 2025 & 2033
- Figure 4: North America Offshore AUV and ROV Market Volume (K Unit), by Vehicle Type 2025 & 2033
- Figure 5: North America Offshore AUV and ROV Market Revenue Share (%), by Vehicle Type 2025 & 2033
- Figure 6: North America Offshore AUV and ROV Market Volume Share (%), by Vehicle Type 2025 & 2033
- Figure 7: North America Offshore AUV and ROV Market Revenue (Million), by Vehicle Class 2025 & 2033
- Figure 8: North America Offshore AUV and ROV Market Volume (K Unit), by Vehicle Class 2025 & 2033
- Figure 9: North America Offshore AUV and ROV Market Revenue Share (%), by Vehicle Class 2025 & 2033
- Figure 10: North America Offshore AUV and ROV Market Volume Share (%), by Vehicle Class 2025 & 2033
- Figure 11: North America Offshore AUV and ROV Market Revenue (Million), by End-user Application 2025 & 2033
- Figure 12: North America Offshore AUV and ROV Market Volume (K Unit), by End-user Application 2025 & 2033
- Figure 13: North America Offshore AUV and ROV Market Revenue Share (%), by End-user Application 2025 & 2033
- Figure 14: North America Offshore AUV and ROV Market Volume Share (%), by End-user Application 2025 & 2033
- Figure 15: North America Offshore AUV and ROV Market Revenue (Million), by Activity 2025 & 2033
- Figure 16: North America Offshore AUV and ROV Market Volume (K Unit), by Activity 2025 & 2033
- Figure 17: North America Offshore AUV and ROV Market Revenue Share (%), by Activity 2025 & 2033
- Figure 18: North America Offshore AUV and ROV Market Volume Share (%), by Activity 2025 & 2033
- Figure 19: North America Offshore AUV and ROV Market Revenue (Million), by Country 2025 & 2033
- Figure 20: North America Offshore AUV and ROV Market Volume (K Unit), by Country 2025 & 2033
- Figure 21: North America Offshore AUV and ROV Market Revenue Share (%), by Country 2025 & 2033
- Figure 22: North America Offshore AUV and ROV Market Volume Share (%), by Country 2025 & 2033
- Figure 23: Europe Offshore AUV and ROV Market Revenue (Million), by Vehicle Type 2025 & 2033
- Figure 24: Europe Offshore AUV and ROV Market Volume (K Unit), by Vehicle Type 2025 & 2033
- Figure 25: Europe Offshore AUV and ROV Market Revenue Share (%), by Vehicle Type 2025 & 2033
- Figure 26: Europe Offshore AUV and ROV Market Volume Share (%), by Vehicle Type 2025 & 2033
- Figure 27: Europe Offshore AUV and ROV Market Revenue (Million), by Vehicle Class 2025 & 2033
- Figure 28: Europe Offshore AUV and ROV Market Volume (K Unit), by Vehicle Class 2025 & 2033
- Figure 29: Europe Offshore AUV and ROV Market Revenue Share (%), by Vehicle Class 2025 & 2033
- Figure 30: Europe Offshore AUV and ROV Market Volume Share (%), by Vehicle Class 2025 & 2033
- Figure 31: Europe Offshore AUV and ROV Market Revenue (Million), by End-user Application 2025 & 2033
- Figure 32: Europe Offshore AUV and ROV Market Volume (K Unit), by End-user Application 2025 & 2033
- Figure 33: Europe Offshore AUV and ROV Market Revenue Share (%), by End-user Application 2025 & 2033
- Figure 34: Europe Offshore AUV and ROV Market Volume Share (%), by End-user Application 2025 & 2033
- Figure 35: Europe Offshore AUV and ROV Market Revenue (Million), by Activity 2025 & 2033
- Figure 36: Europe Offshore AUV and ROV Market Volume (K Unit), by Activity 2025 & 2033
- Figure 37: Europe Offshore AUV and ROV Market Revenue Share (%), by Activity 2025 & 2033
- Figure 38: Europe Offshore AUV and ROV Market Volume Share (%), by Activity 2025 & 2033
- Figure 39: Europe Offshore AUV and ROV Market Revenue (Million), by Country 2025 & 2033
- Figure 40: Europe Offshore AUV and ROV Market Volume (K Unit), by Country 2025 & 2033
- Figure 41: Europe Offshore AUV and ROV Market Revenue Share (%), by Country 2025 & 2033
- Figure 42: Europe Offshore AUV and ROV Market Volume Share (%), by Country 2025 & 2033
- Figure 43: Asia Pacific Offshore AUV and ROV Market Revenue (Million), by Vehicle Type 2025 & 2033
- Figure 44: Asia Pacific Offshore AUV and ROV Market Volume (K Unit), by Vehicle Type 2025 & 2033
- Figure 45: Asia Pacific Offshore AUV and ROV Market Revenue Share (%), by Vehicle Type 2025 & 2033
- Figure 46: Asia Pacific Offshore AUV and ROV Market Volume Share (%), by Vehicle Type 2025 & 2033
- Figure 47: Asia Pacific Offshore AUV and ROV Market Revenue (Million), by Vehicle Class 2025 & 2033
- Figure 48: Asia Pacific Offshore AUV and ROV Market Volume (K Unit), by Vehicle Class 2025 & 2033
- Figure 49: Asia Pacific Offshore AUV and ROV Market Revenue Share (%), by Vehicle Class 2025 & 2033
- Figure 50: Asia Pacific Offshore AUV and ROV Market Volume Share (%), by Vehicle Class 2025 & 2033
- Figure 51: Asia Pacific Offshore AUV and ROV Market Revenue (Million), by End-user Application 2025 & 2033
- Figure 52: Asia Pacific Offshore AUV and ROV Market Volume (K Unit), by End-user Application 2025 & 2033
- Figure 53: Asia Pacific Offshore AUV and ROV Market Revenue Share (%), by End-user Application 2025 & 2033
- Figure 54: Asia Pacific Offshore AUV and ROV Market Volume Share (%), by End-user Application 2025 & 2033
- Figure 55: Asia Pacific Offshore AUV and ROV Market Revenue (Million), by Activity 2025 & 2033
- Figure 56: Asia Pacific Offshore AUV and ROV Market Volume (K Unit), by Activity 2025 & 2033
- Figure 57: Asia Pacific Offshore AUV and ROV Market Revenue Share (%), by Activity 2025 & 2033
- Figure 58: Asia Pacific Offshore AUV and ROV Market Volume Share (%), by Activity 2025 & 2033
- Figure 59: Asia Pacific Offshore AUV and ROV Market Revenue (Million), by Country 2025 & 2033
- Figure 60: Asia Pacific Offshore AUV and ROV Market Volume (K Unit), by Country 2025 & 2033
- Figure 61: Asia Pacific Offshore AUV and ROV Market Revenue Share (%), by Country 2025 & 2033
- Figure 62: Asia Pacific Offshore AUV and ROV Market Volume Share (%), by Country 2025 & 2033
- Figure 63: South America Offshore AUV and ROV Market Revenue (Million), by Vehicle Type 2025 & 2033
- Figure 64: South America Offshore AUV and ROV Market Volume (K Unit), by Vehicle Type 2025 & 2033
- Figure 65: South America Offshore AUV and ROV Market Revenue Share (%), by Vehicle Type 2025 & 2033
- Figure 66: South America Offshore AUV and ROV Market Volume Share (%), by Vehicle Type 2025 & 2033
- Figure 67: South America Offshore AUV and ROV Market Revenue (Million), by Vehicle Class 2025 & 2033
- Figure 68: South America Offshore AUV and ROV Market Volume (K Unit), by Vehicle Class 2025 & 2033
- Figure 69: South America Offshore AUV and ROV Market Revenue Share (%), by Vehicle Class 2025 & 2033
- Figure 70: South America Offshore AUV and ROV Market Volume Share (%), by Vehicle Class 2025 & 2033
- Figure 71: South America Offshore AUV and ROV Market Revenue (Million), by End-user Application 2025 & 2033
- Figure 72: South America Offshore AUV and ROV Market Volume (K Unit), by End-user Application 2025 & 2033
- Figure 73: South America Offshore AUV and ROV Market Revenue Share (%), by End-user Application 2025 & 2033
- Figure 74: South America Offshore AUV and ROV Market Volume Share (%), by End-user Application 2025 & 2033
- Figure 75: South America Offshore AUV and ROV Market Revenue (Million), by Activity 2025 & 2033
- Figure 76: South America Offshore AUV and ROV Market Volume (K Unit), by Activity 2025 & 2033
- Figure 77: South America Offshore AUV and ROV Market Revenue Share (%), by Activity 2025 & 2033
- Figure 78: South America Offshore AUV and ROV Market Volume Share (%), by Activity 2025 & 2033
- Figure 79: South America Offshore AUV and ROV Market Revenue (Million), by Country 2025 & 2033
- Figure 80: South America Offshore AUV and ROV Market Volume (K Unit), by Country 2025 & 2033
- Figure 81: South America Offshore AUV and ROV Market Revenue Share (%), by Country 2025 & 2033
- Figure 82: South America Offshore AUV and ROV Market Volume Share (%), by Country 2025 & 2033
- Figure 83: Middle East and Africa Offshore AUV and ROV Market Revenue (Million), by Vehicle Type 2025 & 2033
- Figure 84: Middle East and Africa Offshore AUV and ROV Market Volume (K Unit), by Vehicle Type 2025 & 2033
- Figure 85: Middle East and Africa Offshore AUV and ROV Market Revenue Share (%), by Vehicle Type 2025 & 2033
- Figure 86: Middle East and Africa Offshore AUV and ROV Market Volume Share (%), by Vehicle Type 2025 & 2033
- Figure 87: Middle East and Africa Offshore AUV and ROV Market Revenue (Million), by Vehicle Class 2025 & 2033
- Figure 88: Middle East and Africa Offshore AUV and ROV Market Volume (K Unit), by Vehicle Class 2025 & 2033
- Figure 89: Middle East and Africa Offshore AUV and ROV Market Revenue Share (%), by Vehicle Class 2025 & 2033
- Figure 90: Middle East and Africa Offshore AUV and ROV Market Volume Share (%), by Vehicle Class 2025 & 2033
- Figure 91: Middle East and Africa Offshore AUV and ROV Market Revenue (Million), by End-user Application 2025 & 2033
- Figure 92: Middle East and Africa Offshore AUV and ROV Market Volume (K Unit), by End-user Application 2025 & 2033
- Figure 93: Middle East and Africa Offshore AUV and ROV Market Revenue Share (%), by End-user Application 2025 & 2033
- Figure 94: Middle East and Africa Offshore AUV and ROV Market Volume Share (%), by End-user Application 2025 & 2033
- Figure 95: Middle East and Africa Offshore AUV and ROV Market Revenue (Million), by Activity 2025 & 2033
- Figure 96: Middle East and Africa Offshore AUV and ROV Market Volume (K Unit), by Activity 2025 & 2033
- Figure 97: Middle East and Africa Offshore AUV and ROV Market Revenue Share (%), by Activity 2025 & 2033
- Figure 98: Middle East and Africa Offshore AUV and ROV Market Volume Share (%), by Activity 2025 & 2033
- Figure 99: Middle East and Africa Offshore AUV and ROV Market Revenue (Million), by Country 2025 & 2033
- Figure 100: Middle East and Africa Offshore AUV and ROV Market Volume (K Unit), by Country 2025 & 2033
- Figure 101: Middle East and Africa Offshore AUV and ROV Market Revenue Share (%), by Country 2025 & 2033
- Figure 102: Middle East and Africa Offshore AUV and ROV Market Volume Share (%), by Country 2025 & 2033
List of Tables
- Table 1: Global Offshore AUV and ROV Market Revenue Million Forecast, by Vehicle Type 2020 & 2033
- Table 2: Global Offshore AUV and ROV Market Volume K Unit Forecast, by Vehicle Type 2020 & 2033
- Table 3: Global Offshore AUV and ROV Market Revenue Million Forecast, by Vehicle Class 2020 & 2033
- Table 4: Global Offshore AUV and ROV Market Volume K Unit Forecast, by Vehicle Class 2020 & 2033
- Table 5: Global Offshore AUV and ROV Market Revenue Million Forecast, by End-user Application 2020 & 2033
- Table 6: Global Offshore AUV and ROV Market Volume K Unit Forecast, by End-user Application 2020 & 2033
- Table 7: Global Offshore AUV and ROV Market Revenue Million Forecast, by Activity 2020 & 2033
- Table 8: Global Offshore AUV and ROV Market Volume K Unit Forecast, by Activity 2020 & 2033
- Table 9: Global Offshore AUV and ROV Market Revenue Million Forecast, by Region 2020 & 2033
- Table 10: Global Offshore AUV and ROV Market Volume K Unit Forecast, by Region 2020 & 2033
- Table 11: Global Offshore AUV and ROV Market Revenue Million Forecast, by Vehicle Type 2020 & 2033
- Table 12: Global Offshore AUV and ROV Market Volume K Unit Forecast, by Vehicle Type 2020 & 2033
- Table 13: Global Offshore AUV and ROV Market Revenue Million Forecast, by Vehicle Class 2020 & 2033
- Table 14: Global Offshore AUV and ROV Market Volume K Unit Forecast, by Vehicle Class 2020 & 2033
- Table 15: Global Offshore AUV and ROV Market Revenue Million Forecast, by End-user Application 2020 & 2033
- Table 16: Global Offshore AUV and ROV Market Volume K Unit Forecast, by End-user Application 2020 & 2033
- Table 17: Global Offshore AUV and ROV Market Revenue Million Forecast, by Activity 2020 & 2033
- Table 18: Global Offshore AUV and ROV Market Volume K Unit Forecast, by Activity 2020 & 2033
- Table 19: Global Offshore AUV and ROV Market Revenue Million Forecast, by Country 2020 & 2033
- Table 20: Global Offshore AUV and ROV Market Volume K Unit Forecast, by Country 2020 & 2033
- Table 21: United States Offshore AUV and ROV Market Revenue (Million) Forecast, by Application 2020 & 2033
- Table 22: United States Offshore AUV and ROV Market Volume (K Unit) Forecast, by Application 2020 & 2033
- Table 23: Canada Offshore AUV and ROV Market Revenue (Million) Forecast, by Application 2020 & 2033
- Table 24: Canada Offshore AUV and ROV Market Volume (K Unit) Forecast, by Application 2020 & 2033
- Table 25: Mexico Offshore AUV and ROV Market Revenue (Million) Forecast, by Application 2020 & 2033
- Table 26: Mexico Offshore AUV and ROV Market Volume (K Unit) Forecast, by Application 2020 & 2033
- Table 27: Global Offshore AUV and ROV Market Revenue Million Forecast, by Vehicle Type 2020 & 2033
- Table 28: Global Offshore AUV and ROV Market Volume K Unit Forecast, by Vehicle Type 2020 & 2033
- Table 29: Global Offshore AUV and ROV Market Revenue Million Forecast, by Vehicle Class 2020 & 2033
- Table 30: Global Offshore AUV and ROV Market Volume K Unit Forecast, by Vehicle Class 2020 & 2033
- Table 31: Global Offshore AUV and ROV Market Revenue Million Forecast, by End-user Application 2020 & 2033
- Table 32: Global Offshore AUV and ROV Market Volume K Unit Forecast, by End-user Application 2020 & 2033
- Table 33: Global Offshore AUV and ROV Market Revenue Million Forecast, by Activity 2020 & 2033
- Table 34: Global Offshore AUV and ROV Market Volume K Unit Forecast, by Activity 2020 & 2033
- Table 35: Global Offshore AUV and ROV Market Revenue Million Forecast, by Country 2020 & 2033
- Table 36: Global Offshore AUV and ROV Market Volume K Unit Forecast, by Country 2020 & 2033
- Table 37: Germany Offshore AUV and ROV Market Revenue (Million) Forecast, by Application 2020 & 2033
- Table 38: Germany Offshore AUV and ROV Market Volume (K Unit) Forecast, by Application 2020 & 2033
- Table 39: United Kingdom Offshore AUV and ROV Market Revenue (Million) Forecast, by Application 2020 & 2033
- Table 40: United Kingdom Offshore AUV and ROV Market Volume (K Unit) Forecast, by Application 2020 & 2033
- Table 41: Denmark Offshore AUV and ROV Market Revenue (Million) Forecast, by Application 2020 & 2033
- Table 42: Denmark Offshore AUV and ROV Market Volume (K Unit) Forecast, by Application 2020 & 2033
- Table 43: Norway Offshore AUV and ROV Market Revenue (Million) Forecast, by Application 2020 & 2033
- Table 44: Norway Offshore AUV and ROV Market Volume (K Unit) Forecast, by Application 2020 & 2033
- Table 45: Russia Offshore AUV and ROV Market Revenue (Million) Forecast, by Application 2020 & 2033
- Table 46: Russia Offshore AUV and ROV Market Volume (K Unit) Forecast, by Application 2020 & 2033
- Table 47: France Offshore AUV and ROV Market Revenue (Million) Forecast, by Application 2020 & 2033
- Table 48: France Offshore AUV and ROV Market Volume (K Unit) Forecast, by Application 2020 & 2033
- Table 49: Rest of Europe Offshore AUV and ROV Market Revenue (Million) Forecast, by Application 2020 & 2033
- Table 50: Rest of Europe Offshore AUV and ROV Market Volume (K Unit) Forecast, by Application 2020 & 2033
- Table 51: Global Offshore AUV and ROV Market Revenue Million Forecast, by Vehicle Type 2020 & 2033
- Table 52: Global Offshore AUV and ROV Market Volume K Unit Forecast, by Vehicle Type 2020 & 2033
- Table 53: Global Offshore AUV and ROV Market Revenue Million Forecast, by Vehicle Class 2020 & 2033
- Table 54: Global Offshore AUV and ROV Market Volume K Unit Forecast, by Vehicle Class 2020 & 2033
- Table 55: Global Offshore AUV and ROV Market Revenue Million Forecast, by End-user Application 2020 & 2033
- Table 56: Global Offshore AUV and ROV Market Volume K Unit Forecast, by End-user Application 2020 & 2033
- Table 57: Global Offshore AUV and ROV Market Revenue Million Forecast, by Activity 2020 & 2033
- Table 58: Global Offshore AUV and ROV Market Volume K Unit Forecast, by Activity 2020 & 2033
- Table 59: Global Offshore AUV and ROV Market Revenue Million Forecast, by Country 2020 & 2033
- Table 60: Global Offshore AUV and ROV Market Volume K Unit Forecast, by Country 2020 & 2033
- Table 61: China Offshore AUV and ROV Market Revenue (Million) Forecast, by Application 2020 & 2033
- Table 62: China Offshore AUV and ROV Market Volume (K Unit) Forecast, by Application 2020 & 2033
- Table 63: India Offshore AUV and ROV Market Revenue (Million) Forecast, by Application 2020 & 2033
- Table 64: India Offshore AUV and ROV Market Volume (K Unit) Forecast, by Application 2020 & 2033
- Table 65: ASEAN Countries Offshore AUV and ROV Market Revenue (Million) Forecast, by Application 2020 & 2033
- Table 66: ASEAN Countries Offshore AUV and ROV Market Volume (K Unit) Forecast, by Application 2020 & 2033
- Table 67: Rest of Asia Pacific Offshore AUV and ROV Market Revenue (Million) Forecast, by Application 2020 & 2033
- Table 68: Rest of Asia Pacific Offshore AUV and ROV Market Volume (K Unit) Forecast, by Application 2020 & 2033
- Table 69: Global Offshore AUV and ROV Market Revenue Million Forecast, by Vehicle Type 2020 & 2033
- Table 70: Global Offshore AUV and ROV Market Volume K Unit Forecast, by Vehicle Type 2020 & 2033
- Table 71: Global Offshore AUV and ROV Market Revenue Million Forecast, by Vehicle Class 2020 & 2033
- Table 72: Global Offshore AUV and ROV Market Volume K Unit Forecast, by Vehicle Class 2020 & 2033
- Table 73: Global Offshore AUV and ROV Market Revenue Million Forecast, by End-user Application 2020 & 2033
- Table 74: Global Offshore AUV and ROV Market Volume K Unit Forecast, by End-user Application 2020 & 2033
- Table 75: Global Offshore AUV and ROV Market Revenue Million Forecast, by Activity 2020 & 2033
- Table 76: Global Offshore AUV and ROV Market Volume K Unit Forecast, by Activity 2020 & 2033
- Table 77: Global Offshore AUV and ROV Market Revenue Million Forecast, by Country 2020 & 2033
- Table 78: Global Offshore AUV and ROV Market Volume K Unit Forecast, by Country 2020 & 2033
- Table 79: Brazil Offshore AUV and ROV Market Revenue (Million) Forecast, by Application 2020 & 2033
- Table 80: Brazil Offshore AUV and ROV Market Volume (K Unit) Forecast, by Application 2020 & 2033
- Table 81: Venezuela Offshore AUV and ROV Market Revenue (Million) Forecast, by Application 2020 & 2033
- Table 82: Venezuela Offshore AUV and ROV Market Volume (K Unit) Forecast, by Application 2020 & 2033
- Table 83: Argentina Offshore AUV and ROV Market Revenue (Million) Forecast, by Application 2020 & 2033
- Table 84: Argentina Offshore AUV and ROV Market Volume (K Unit) Forecast, by Application 2020 & 2033
- Table 85: Colombia Offshore AUV and ROV Market Revenue (Million) Forecast, by Application 2020 & 2033
- Table 86: Colombia Offshore AUV and ROV Market Volume (K Unit) Forecast, by Application 2020 & 2033
- Table 87: Rest of South America Offshore AUV and ROV Market Revenue (Million) Forecast, by Application 2020 & 2033
- Table 88: Rest of South America Offshore AUV and ROV Market Volume (K Unit) Forecast, by Application 2020 & 2033
- Table 89: Global Offshore AUV and ROV Market Revenue Million Forecast, by Vehicle Type 2020 & 2033
- Table 90: Global Offshore AUV and ROV Market Volume K Unit Forecast, by Vehicle Type 2020 & 2033
- Table 91: Global Offshore AUV and ROV Market Revenue Million Forecast, by Vehicle Class 2020 & 2033
- Table 92: Global Offshore AUV and ROV Market Volume K Unit Forecast, by Vehicle Class 2020 & 2033
- Table 93: Global Offshore AUV and ROV Market Revenue Million Forecast, by End-user Application 2020 & 2033
- Table 94: Global Offshore AUV and ROV Market Volume K Unit Forecast, by End-user Application 2020 & 2033
- Table 95: Global Offshore AUV and ROV Market Revenue Million Forecast, by Activity 2020 & 2033
- Table 96: Global Offshore AUV and ROV Market Volume K Unit Forecast, by Activity 2020 & 2033
- Table 97: Global Offshore AUV and ROV Market Revenue Million Forecast, by Country 2020 & 2033
- Table 98: Global Offshore AUV and ROV Market Volume K Unit Forecast, by Country 2020 & 2033
- Table 99: Saudi Arabia Offshore AUV and ROV Market Revenue (Million) Forecast, by Application 2020 & 2033
- Table 100: Saudi Arabia Offshore AUV and ROV Market Volume (K Unit) Forecast, by Application 2020 & 2033
- Table 101: United Arab Emirates Offshore AUV and ROV Market Revenue (Million) Forecast, by Application 2020 & 2033
- Table 102: United Arab Emirates Offshore AUV and ROV Market Volume (K Unit) Forecast, by Application 2020 & 2033
- Table 103: Qatar Offshore AUV and ROV Market Revenue (Million) Forecast, by Application 2020 & 2033
- Table 104: Qatar Offshore AUV and ROV Market Volume (K Unit) Forecast, by Application 2020 & 2033
- Table 105: Nigeria Offshore AUV and ROV Market Revenue (Million) Forecast, by Application 2020 & 2033
- Table 106: Nigeria Offshore AUV and ROV Market Volume (K Unit) Forecast, by Application 2020 & 2033
- Table 107: Rest of Middle East and Africa Offshore AUV and ROV Market Revenue (Million) Forecast, by Application 2020 & 2033
- Table 108: Rest of Middle East and Africa Offshore AUV and ROV Market Volume (K Unit) Forecast, by Application 2020 & 2033
Frequently Asked Questions
1. What is the projected Compound Annual Growth Rate (CAGR) of the Offshore AUV and ROV Market?
The projected CAGR is approximately 7.69%.
2. Which companies are prominent players in the Offshore AUV and ROV Market?
Key companies in the market include DOF Subsea AS, Helix Energy Solutions Group Inc, Fugro NV, Bourbon, Oceaneering International Inc, Saipem SpA, DeepOcean AS, Subsea 7 SA, Teledyne Technologies Incorporated*List Not Exhaustive, TechnipFMC PLC.
3. What are the main segments of the Offshore AUV and ROV Market?
The market segments include Vehicle Type, Vehicle Class, End-user Application, Activity.
4. Can you provide details about the market size?
The market size is estimated to be USD 2.63 Million as of 2022.
5. What are some drivers contributing to market growth?
4.; Increasing Offshore Oil and Gas Exploration Activities in the American. Asia-Pacific. and Middle-East and African Regions4.; Growing Offshore Renewable Technologies.
6. What are the notable trends driving market growth?
Oil and Gas Segment to Dominate the Market.
7. Are there any restraints impacting market growth?
4.; Ban on Offshore Exploration and Production Activities in Multiple Regions.
8. Can you provide examples of recent developments in the market?
Jan 2024: DeepTech won a three-year contract to provide rig support ROV services for BP Plc on the West Nile Delta development offshore Egypt. As part of the contract, two work class ROVs are provided to support the drilling, completion, and subsea activities directly on this long-term contract, which includes an option for further extension.
9. What pricing options are available for accessing the report?
Pricing options include single-user, multi-user, and enterprise licenses priced at USD 4750, USD 5250, and USD 8750 respectively.
10. Is the market size provided in terms of value or volume?
The market size is provided in terms of value, measured in Million and volume, measured in K Unit.
11. Are there any specific market keywords associated with the report?
Yes, the market keyword associated with the report is "Offshore AUV and ROV Market," which aids in identifying and referencing the specific market segment covered.
12. How do I determine which pricing option suits my needs best?
The pricing options vary based on user requirements and access needs. Individual users may opt for single-user licenses, while businesses requiring broader access may choose multi-user or enterprise licenses for cost-effective access to the report.
13. Are there any additional resources or data provided in the Offshore AUV and ROV Market report?
While the report offers comprehensive insights, it's advisable to review the specific contents or supplementary materials provided to ascertain if additional resources or data are available.
14. How can I stay updated on further developments or reports in the Offshore AUV and ROV Market?
To stay informed about further developments, trends, and reports in the Offshore AUV and ROV Market, consider subscribing to industry newsletters, following relevant companies and organizations, or regularly checking reputable industry news sources and publications.
Methodology
Step 1 - Identification of Relevant Samples Size from Population Database


Step 2 - Approaches for Defining Global Market Size (Value, Volume* & Price*)

Note*: In applicable scenarios
Step 3 - Data Sources
Primary Research
- Web Analytics
- Survey Reports
- Research Institute
- Latest Research Reports
- Opinion Leaders
Secondary Research
- Annual Reports
- White Paper
- Latest Press Release
- Industry Association
- Paid Database
- Investor Presentations

Step 4 - Data Triangulation
Involves using different sources of information in order to increase the validity of a study
These sources are likely to be stakeholders in a program - participants, other researchers, program staff, other community members, and so on.
Then we put all data in single framework & apply various statistical tools to find out the dynamic on the market.
During the analysis stage, feedback from the stakeholder groups would be compared to determine areas of agreement as well as areas of divergence