

Key Insights
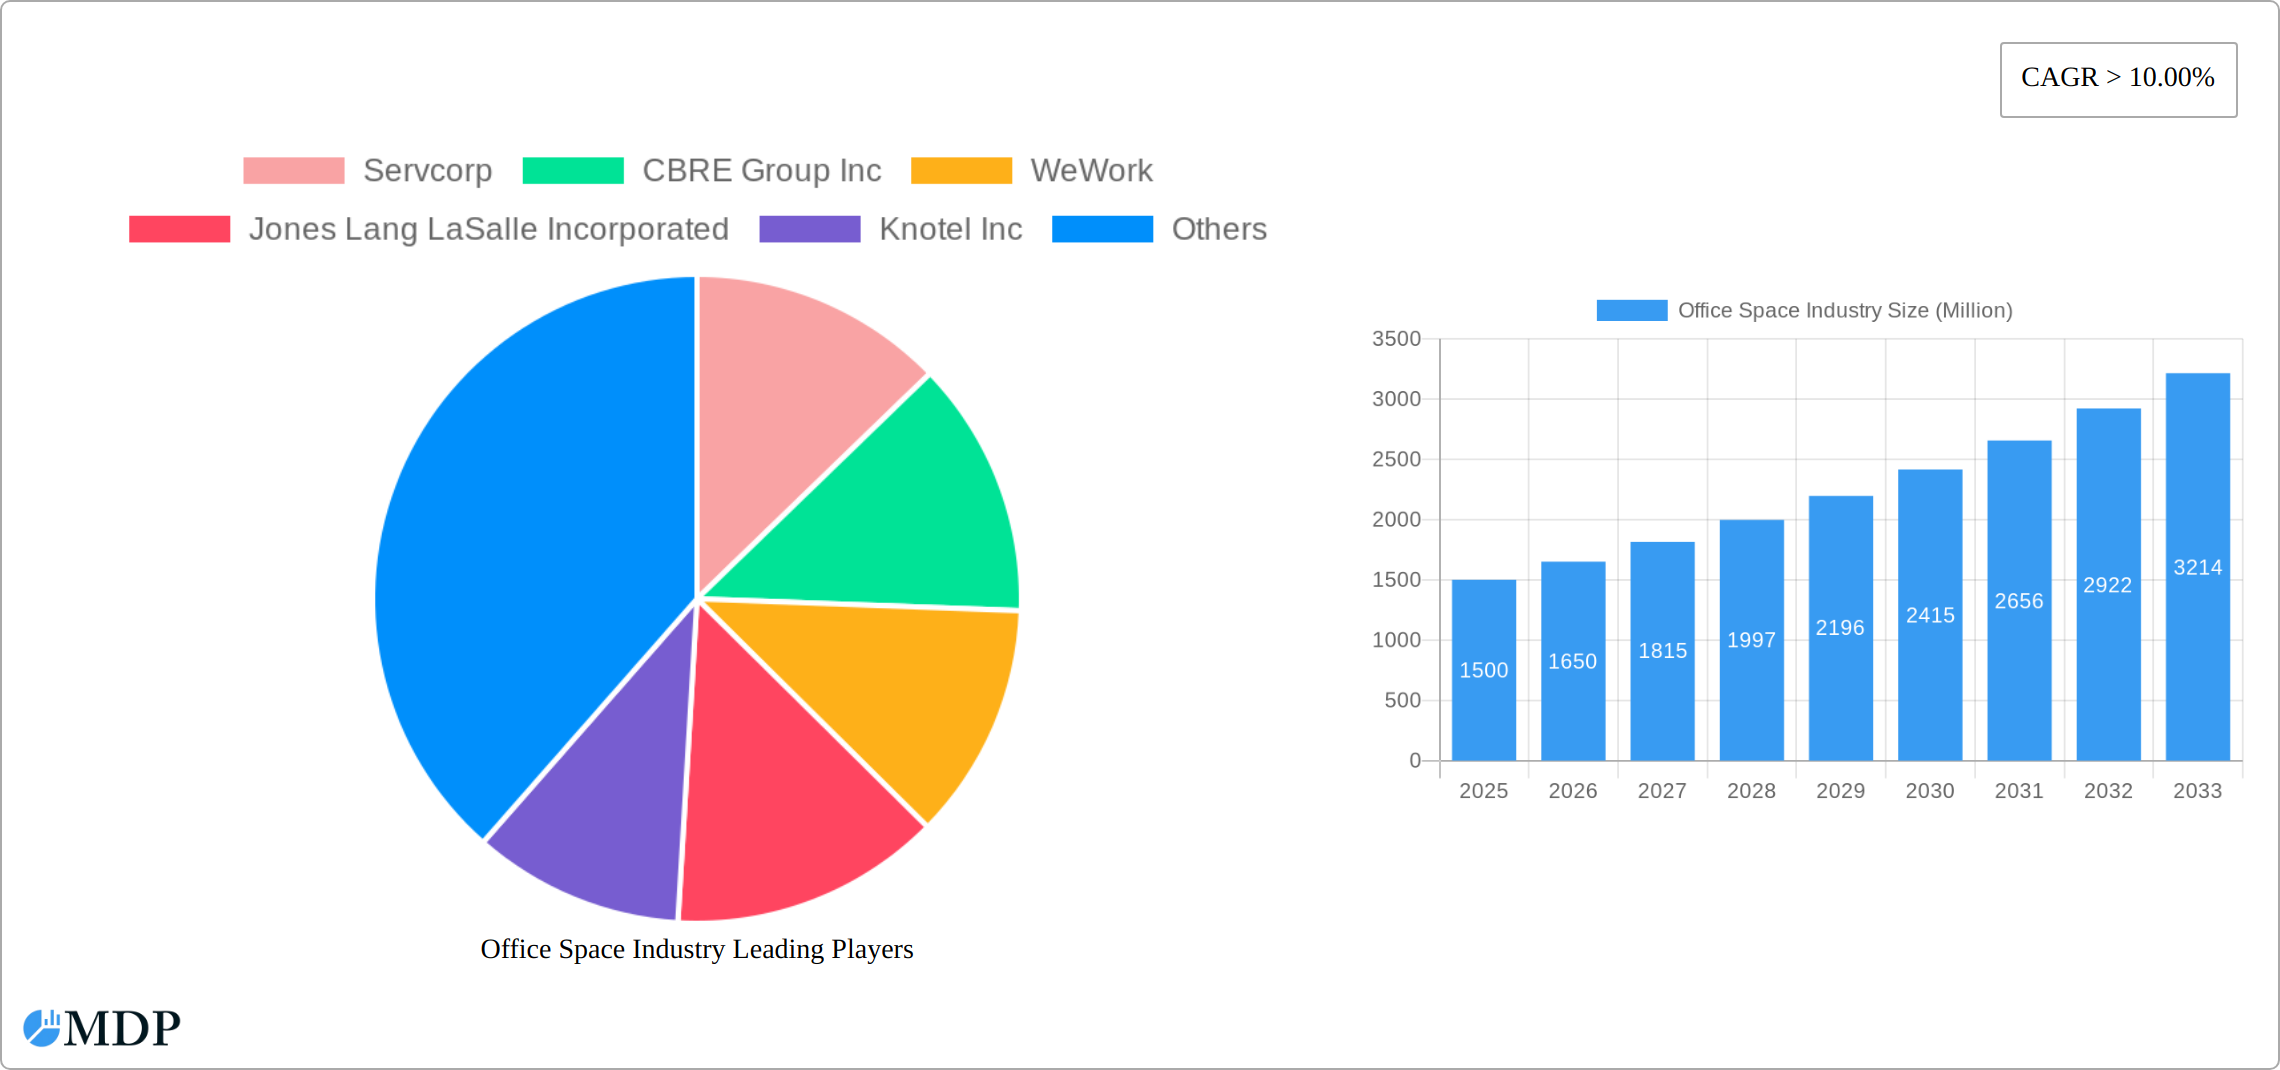
The global office space market, currently experiencing robust growth with a CAGR exceeding 10%, presents significant opportunities and challenges. The market's expansion is fueled by several key drivers. Firstly, the ongoing digital transformation across various sectors, particularly IT and telecommunications, media and entertainment, and retail, necessitates flexible and adaptable workspace solutions. Secondly, the increasing preference for collaborative work environments and the rise of co-working spaces are reshaping the traditional office landscape. Thirdly, urbanization and population growth in key regions continue to drive demand for office space, particularly in North America and Asia Pacific. However, the market also faces constraints. Economic downturns can significantly impact demand, particularly impacting the new building segment. Furthermore, the increasing popularity of remote work models poses a challenge to the traditional office market, forcing landlords and developers to adapt by providing more attractive and flexible options. The market is segmented by building type (retrofits and new buildings) and end-user (IT & Telecommunications, Media & Entertainment, Retail & Consumer Goods). Retrofits are likely experiencing higher demand currently due to existing building stock and cost-effectiveness compared to new construction. Major players like Servcorp, CBRE Group, WeWork, and IWG PLC are shaping the market dynamics through innovation and strategic acquisitions. Looking ahead, the market's trajectory will depend on the global economic climate, technological advancements shaping work practices, and evolving employee preferences for workspaces.
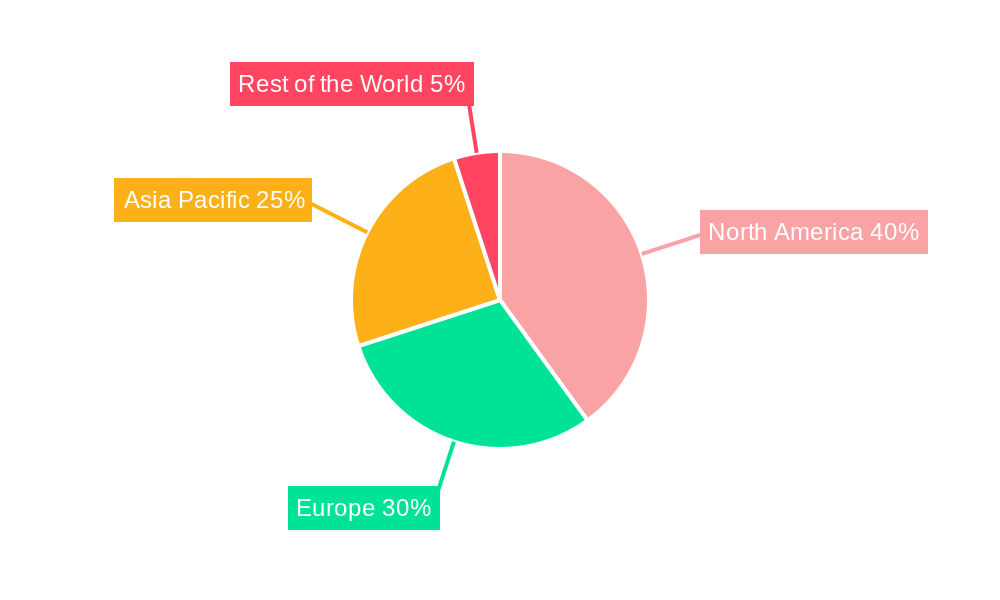
The continued growth of the office space market is expected to persist throughout the forecast period (2025-2033). While the exact regional breakdown is unavailable, considering typical market distribution and the projected growth, we can reasonably estimate that North America and Asia Pacific will likely maintain the largest market shares, fueled by economic strength and expanding tech sectors. Europe will also contribute significantly, although perhaps at a slightly lower rate. The 'Rest of the World' segment will represent a smaller but still growing portion of the market. The retrofitting segment may see slightly higher growth than the new buildings segment, given the existing building stock and shorter project timelines. Within the end-user segments, IT and Telecommunications, and Media and Entertainment are likely to be the fastest-growing sectors. This signifies a dynamic market requiring ongoing adaptation and innovation from industry players to meet evolving client needs and maintain a competitive edge.
Office Space Industry Report: 2019-2033 Forecast - A Comprehensive Market Analysis
Uncover the future of the $xx Million office space market with this in-depth report. This comprehensive analysis provides a detailed examination of the global office space industry, covering market dynamics, leading players, emerging trends, and future growth potential from 2019 to 2033. Benefit from actionable insights and strategic recommendations to navigate the evolving landscape and capitalize on lucrative opportunities. The report leverages data from the historical period (2019-2024), base year (2025), and estimated year (2025) to project market trends until 2033.
Office Space Industry Market Dynamics & Concentration
This section analyzes the competitive landscape, encompassing market concentration, innovation drivers, regulatory frameworks, product substitutes, end-user trends, and M&A activities within the $xx Million office space market. We delve into the market share held by key players such as Servcorp, CBRE Group Inc, WeWork, Jones Lang LaSalle Incorporated, Knotel Inc, IWG PLC, Mitsui Fudosan Co Ltd, The Office Group, Regus, and WOJO, among others.
- Market Concentration: The office space market exhibits a [Describe level of concentration, e.g., moderately concentrated] structure, with the top five players accounting for approximately xx% of the market share in 2024.
- Innovation Drivers: Technological advancements like smart building technologies and flexible workspace solutions are driving innovation and shaping market dynamics.
- Regulatory Frameworks: Government regulations concerning building codes, environmental standards, and lease agreements significantly impact the industry's operational costs and expansion strategies. Variations across regions create a diverse regulatory environment.
- Product Substitutes: The rise of co-working spaces and remote work arrangements presents significant competition to traditional office spaces, forcing traditional players to adapt and innovate.
- End-User Trends: The increasing demand for flexible and collaborative workspaces from IT and telecommunications, media and entertainment, and retail and consumer goods sectors is reshaping the market landscape.
- M&A Activities: The industry has witnessed [Number] M&A deals between 2019 and 2024, indicating a trend of consolidation and expansion among key players. This activity is expected to continue at a [xx%] CAGR during the forecast period.
Office Space Industry Industry Trends & Analysis
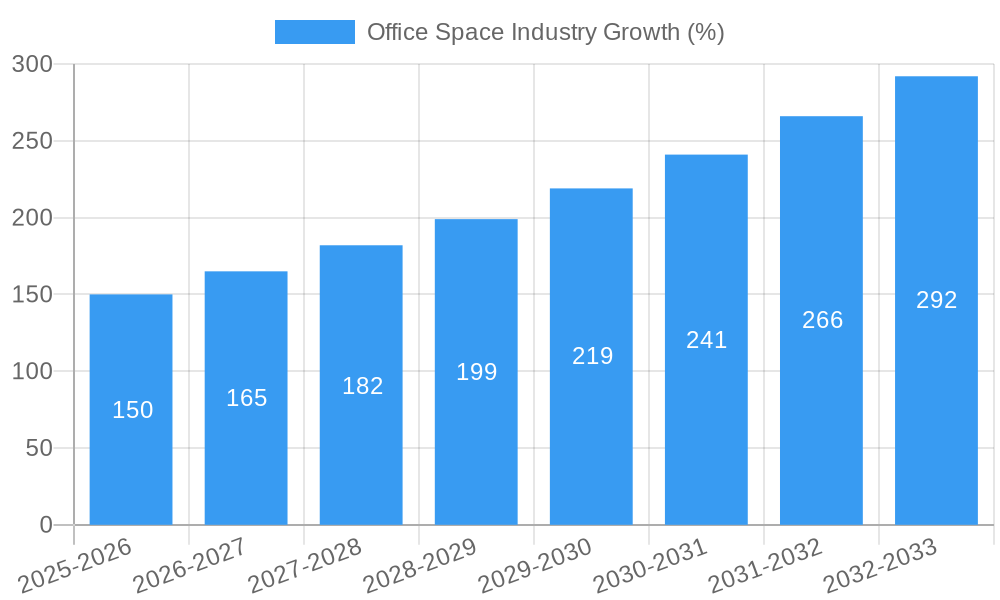
This section provides a detailed analysis of market growth drivers, technological disruptions, consumer preferences, and competitive dynamics impacting the $xx Million office space industry. We examine the CAGR and market penetration across various segments, identifying key trends shaping the industry's evolution and growth trajectory. The analysis covers the period from 2019 to 2033, with a focus on the impact of factors like evolving work styles, technological innovations, and the preferences of businesses across various sectors.
Leading Markets & Segments in Office Space Industry
This section identifies the dominant regions, countries, and segments within the office space market. We analyze this based on building typology, differentiating between new constructions and retrofits, and by key end-user industries including IT and Telecommunications, Media and Entertainment, and Retail and Consumer Goods. The analysis highlights the primary drivers contributing to the prominence of specific markets and segments.
- By Building Type:
- New Buildings: Growth in this segment is significantly fueled by robust investment in commercial real estate, a surging demand for modern, technologically advanced facilities, and ongoing urban expansion projects creating new development opportunities.
- Retrofits: The retrofit segment is primarily driven by the increasing imperative for sustainable business practices and the compelling cost-effectiveness of renovations and upgrades compared to the substantial investment required for new constructions.
- By End-User:
- IT and Telecommunications: This sector demonstrates exceptionally high demand for office space due to ambitious expansion plans, a continuously increasing workforce, and the critical need for specialized infrastructure and high-speed connectivity.
- Media and Entertainment: This sector displays significant demand driven by the dynamic nature of project-based work, a strong emphasis on collaborative environments, and the requirement for flexible, adaptable spaces.
- Retail and Consumer Goods: This sector presents consistent demand due to the strategic importance of prime office locations, proximity to key consumer markets, and the need for centralized operational hubs.
The United States is currently the leading market due to its strong economic growth, supportive government policies fostering business development, and a well-established, robust infrastructure that attracts significant domestic and international investment.
Office Space Industry Product Developments
This section summarizes recent innovations in office space design, technology integration, and service offerings. The focus is on emerging technological trends like smart building management systems, flexible workspace solutions, and sustainable design practices that enhance the value proposition and improve operational efficiency of office spaces. These developments are examined in the context of their market fit and competitive advantages, demonstrating how the industry is evolving to meet changing demands.
Key Drivers of Office Space Industry Growth
The office space industry is experiencing robust growth propelled by a confluence of transformative factors. Technological advancements are at the forefront, with the integration of smart building technologies enhancing operational efficiency, occupant comfort, and sustainability. The rise of flexible workspace solutions, including co-working and hybrid models, is also a major catalyst, attracting tenants seeking agility and cost-effectiveness. Economically, rising disposable incomes and sustained urbanization are directly fueling demand for commercial office environments in key metropolitan areas. Furthermore, supportive government policies, such as tax incentives for green building certifications and urban regeneration initiatives, play a crucial role in stimulating investment and development within the sector.
Challenges in the Office Space Industry Market
The office space industry faces significant challenges, including rising construction costs, competition from co-working spaces, and the increasing adoption of remote work models. Supply chain disruptions and regulatory hurdles further complicate operations, potentially impacting profitability and expansion plans. These factors could reduce market growth by an estimated xx% by [year].
Emerging Opportunities in Office Space Industry
The office space industry is ripe with emerging opportunities for forward-thinking stakeholders. The development and adoption of smart, sustainable, and highly flexible workspaces are paramount, catering to the evolving preferences of modern workforces and the rapid pace of technological advancement. Strategic partnerships between real estate developers, technology providers, and corporate occupiers are unlocking new value propositions. International market expansion into rapidly developing economies offers significant growth potential. Moreover, the exploration of innovative business models, such as outcome-based leasing and integrated facility management services, can create new revenue streams. Increased adoption of PropTech solutions for data analytics and tenant engagement, along with a focus on creating enhanced, value-added services beyond traditional office space, represent crucial avenues for future success and market differentiation.
Leading Players in the Office Space Industry Sector
- Servcorp
- CBRE Group Inc
- WeWork
- Jones Lang LaSalle Incorporated
- Knotel Inc
- IWG PLC
- Mitsui Fudosan Co Ltd
- The Office Group
- Regus
- WOJO
- 7 Other Companies
Key Milestones in Office Space Industry Industry
- January 2023: Launch of "EcoSmart Buildings," a new initiative by Global Properties Inc. promoting net-zero energy office developments. This impacted the market by accelerating the adoption of sustainable building practices and increasing demand for green certifications.
- April 2023: Merger between FlexiWork Solutions and ConnectHub Spaces. This resulted in the creation of the largest flexible workspace provider in North America, offering an expanded portfolio of on-demand office solutions and enhanced technological integration.
- September 2023: Introduction of an AI-powered building management system by Intelligent Spaces Co. This led to a significant increase in operational efficiency for commercial properties, optimizing energy consumption and enhancing tenant experience through predictive maintenance and personalized environmental controls.
- February 2024: Release of the "Future of Work Report" by the Office Research Institute, highlighting the permanent shift towards hybrid work models and the increased demand for well-being-focused amenities in office environments. This milestone is influencing corporate real estate strategies and design considerations across the industry.
Strategic Outlook for Office Space Industry Market
The future trajectory of the office space industry is intrinsically linked to its capacity for adaptability and relentless innovation. Enterprises that proactively embrace cutting-edge technological advancements, thoughtfully curate flexible and dynamic workspace environments, and prioritize environmental, social, and governance (ESG) principles will undoubtedly secure a competitive advantage and foster long-term success. Strategic alliances and calculated international market expansion are poised to be significant drivers of sustained market growth. Crucially, the industry's ability to evolve beyond conventional office rentals and focus on delivering comprehensive, value-added services will be the cornerstone of enduring competitiveness and profitability. The market is exceptionally well-positioned for substantial growth, with projections indicating a significant valuation increase, reaching an estimated $XXX Billion by 2030.
Office Space Industry Segmentation
-
1. Building Type
- 1.1. Retrofits
- 1.2. New Buildings
-
2. End User
- 2.1. IT and Telecommunications
- 2.2. Media and Entertainment
- 2.3. Retail and Consumer Goods
Office Space Industry Segmentation By Geography
- 1. North America
- 2. Europe
- 3. Asia Pacific
- 4. Rest of the World
Office Space Industry REPORT HIGHLIGHTS
| Aspects | Details |
|---|---|
| Study Period | 2019-2033 |
| Base Year | 2024 |
| Estimated Year | 2025 |
| Forecast Period | 2025-2033 |
| Historical Period | 2019-2024 |
| Growth Rate | CAGR of > 10.00% from 2019-2033 |
| Segmentation |
|
Table of Contents
- 1. Introduction
- 1.1. Research Scope
- 1.2. Market Segmentation
- 1.3. Research Methodology
- 1.4. Definitions and Assumptions
- 2. Executive Summary
- 2.1. Introduction
- 3. Market Dynamics
- 3.1. Introduction
- 3.2. Market Drivers
- 3.2.1. 4.; Increase in Aging Population Driving the Market4.; Healthcare and Long-term Care Needs Driving the Market
- 3.3. Market Restrains
- 3.3.1. 4.; High Affordability and Cost of Care Affecting the Market4.; Staffing and Workforce Challenges Affecting the Market
- 3.4. Market Trends
- 3.4.1. Increase in Office Space Vacancy Rate
- 4. Market Factor Analysis
- 4.1. Porters Five Forces
- 4.2. Supply/Value Chain
- 4.3. PESTEL analysis
- 4.4. Market Entropy
- 4.5. Patent/Trademark Analysis
- 5. Global Office Space Industry Analysis, Insights and Forecast, 2019-2031
- 5.1. Market Analysis, Insights and Forecast - by Building Type
- 5.1.1. Retrofits
- 5.1.2. New Buildings
- 5.2. Market Analysis, Insights and Forecast - by End User
- 5.2.1. IT and Telecommunications
- 5.2.2. Media and Entertainment
- 5.2.3. Retail and Consumer Goods
- 5.3. Market Analysis, Insights and Forecast - by Region
- 5.3.1. North America
- 5.3.2. Europe
- 5.3.3. Asia Pacific
- 5.3.4. Rest of the World
- 5.1. Market Analysis, Insights and Forecast - by Building Type
- 6. North America Office Space Industry Analysis, Insights and Forecast, 2019-2031
- 6.1. Market Analysis, Insights and Forecast - by Building Type
- 6.1.1. Retrofits
- 6.1.2. New Buildings
- 6.2. Market Analysis, Insights and Forecast - by End User
- 6.2.1. IT and Telecommunications
- 6.2.2. Media and Entertainment
- 6.2.3. Retail and Consumer Goods
- 6.1. Market Analysis, Insights and Forecast - by Building Type
- 7. Europe Office Space Industry Analysis, Insights and Forecast, 2019-2031
- 7.1. Market Analysis, Insights and Forecast - by Building Type
- 7.1.1. Retrofits
- 7.1.2. New Buildings
- 7.2. Market Analysis, Insights and Forecast - by End User
- 7.2.1. IT and Telecommunications
- 7.2.2. Media and Entertainment
- 7.2.3. Retail and Consumer Goods
- 7.1. Market Analysis, Insights and Forecast - by Building Type
- 8. Asia Pacific Office Space Industry Analysis, Insights and Forecast, 2019-2031
- 8.1. Market Analysis, Insights and Forecast - by Building Type
- 8.1.1. Retrofits
- 8.1.2. New Buildings
- 8.2. Market Analysis, Insights and Forecast - by End User
- 8.2.1. IT and Telecommunications
- 8.2.2. Media and Entertainment
- 8.2.3. Retail and Consumer Goods
- 8.1. Market Analysis, Insights and Forecast - by Building Type
- 9. Rest of the World Office Space Industry Analysis, Insights and Forecast, 2019-2031
- 9.1. Market Analysis, Insights and Forecast - by Building Type
- 9.1.1. Retrofits
- 9.1.2. New Buildings
- 9.2. Market Analysis, Insights and Forecast - by End User
- 9.2.1. IT and Telecommunications
- 9.2.2. Media and Entertainment
- 9.2.3. Retail and Consumer Goods
- 9.1. Market Analysis, Insights and Forecast - by Building Type
- 10. North America Office Space Industry Analysis, Insights and Forecast, 2019-2031
- 10.1. Market Analysis, Insights and Forecast - By Country/Sub-region
- 10.1.1.
- 11. Europe Office Space Industry Analysis, Insights and Forecast, 2019-2031
- 11.1. Market Analysis, Insights and Forecast - By Country/Sub-region
- 11.1.1.
- 12. Asia Pacific Office Space Industry Analysis, Insights and Forecast, 2019-2031
- 12.1. Market Analysis, Insights and Forecast - By Country/Sub-region
- 12.1.1.
- 13. Rest of the World Office Space Industry Analysis, Insights and Forecast, 2019-2031
- 13.1. Market Analysis, Insights and Forecast - By Country/Sub-region
- 13.1.1.
- 14. Competitive Analysis
- 14.1. Global Market Share Analysis 2024
- 14.2. Company Profiles
- 14.2.1 Servcorp
- 14.2.1.1. Overview
- 14.2.1.2. Products
- 14.2.1.3. SWOT Analysis
- 14.2.1.4. Recent Developments
- 14.2.1.5. Financials (Based on Availability)
- 14.2.2 CBRE Group Inc
- 14.2.2.1. Overview
- 14.2.2.2. Products
- 14.2.2.3. SWOT Analysis
- 14.2.2.4. Recent Developments
- 14.2.2.5. Financials (Based on Availability)
- 14.2.3 WeWork
- 14.2.3.1. Overview
- 14.2.3.2. Products
- 14.2.3.3. SWOT Analysis
- 14.2.3.4. Recent Developments
- 14.2.3.5. Financials (Based on Availability)
- 14.2.4 Jones Lang LaSalle Incorporated
- 14.2.4.1. Overview
- 14.2.4.2. Products
- 14.2.4.3. SWOT Analysis
- 14.2.4.4. Recent Developments
- 14.2.4.5. Financials (Based on Availability)
- 14.2.5 Knotel Inc
- 14.2.5.1. Overview
- 14.2.5.2. Products
- 14.2.5.3. SWOT Analysis
- 14.2.5.4. Recent Developments
- 14.2.5.5. Financials (Based on Availability)
- 14.2.6 IWG PLC
- 14.2.6.1. Overview
- 14.2.6.2. Products
- 14.2.6.3. SWOT Analysis
- 14.2.6.4. Recent Developments
- 14.2.6.5. Financials (Based on Availability)
- 14.2.7 Mitsui Fudosan Co Ltd
- 14.2.7.1. Overview
- 14.2.7.2. Products
- 14.2.7.3. SWOT Analysis
- 14.2.7.4. Recent Developments
- 14.2.7.5. Financials (Based on Availability)
- 14.2.8 The Office Group
- 14.2.8.1. Overview
- 14.2.8.2. Products
- 14.2.8.3. SWOT Analysis
- 14.2.8.4. Recent Developments
- 14.2.8.5. Financials (Based on Availability)
- 14.2.9 Regus
- 14.2.9.1. Overview
- 14.2.9.2. Products
- 14.2.9.3. SWOT Analysis
- 14.2.9.4. Recent Developments
- 14.2.9.5. Financials (Based on Availability)
- 14.2.10 WOJO**List Not Exhaustive 7 3 Other Companie
- 14.2.10.1. Overview
- 14.2.10.2. Products
- 14.2.10.3. SWOT Analysis
- 14.2.10.4. Recent Developments
- 14.2.10.5. Financials (Based on Availability)
- 14.2.1 Servcorp
List of Figures
- Figure 1: Global Office Space Industry Revenue Breakdown (Million, %) by Region 2024 & 2032
- Figure 2: North America Office Space Industry Revenue (Million), by Country 2024 & 2032
- Figure 3: North America Office Space Industry Revenue Share (%), by Country 2024 & 2032
- Figure 4: Europe Office Space Industry Revenue (Million), by Country 2024 & 2032
- Figure 5: Europe Office Space Industry Revenue Share (%), by Country 2024 & 2032
- Figure 6: Asia Pacific Office Space Industry Revenue (Million), by Country 2024 & 2032
- Figure 7: Asia Pacific Office Space Industry Revenue Share (%), by Country 2024 & 2032
- Figure 8: Rest of the World Office Space Industry Revenue (Million), by Country 2024 & 2032
- Figure 9: Rest of the World Office Space Industry Revenue Share (%), by Country 2024 & 2032
- Figure 10: North America Office Space Industry Revenue (Million), by Building Type 2024 & 2032
- Figure 11: North America Office Space Industry Revenue Share (%), by Building Type 2024 & 2032
- Figure 12: North America Office Space Industry Revenue (Million), by End User 2024 & 2032
- Figure 13: North America Office Space Industry Revenue Share (%), by End User 2024 & 2032
- Figure 14: North America Office Space Industry Revenue (Million), by Country 2024 & 2032
- Figure 15: North America Office Space Industry Revenue Share (%), by Country 2024 & 2032
- Figure 16: Europe Office Space Industry Revenue (Million), by Building Type 2024 & 2032
- Figure 17: Europe Office Space Industry Revenue Share (%), by Building Type 2024 & 2032
- Figure 18: Europe Office Space Industry Revenue (Million), by End User 2024 & 2032
- Figure 19: Europe Office Space Industry Revenue Share (%), by End User 2024 & 2032
- Figure 20: Europe Office Space Industry Revenue (Million), by Country 2024 & 2032
- Figure 21: Europe Office Space Industry Revenue Share (%), by Country 2024 & 2032
- Figure 22: Asia Pacific Office Space Industry Revenue (Million), by Building Type 2024 & 2032
- Figure 23: Asia Pacific Office Space Industry Revenue Share (%), by Building Type 2024 & 2032
- Figure 24: Asia Pacific Office Space Industry Revenue (Million), by End User 2024 & 2032
- Figure 25: Asia Pacific Office Space Industry Revenue Share (%), by End User 2024 & 2032
- Figure 26: Asia Pacific Office Space Industry Revenue (Million), by Country 2024 & 2032
- Figure 27: Asia Pacific Office Space Industry Revenue Share (%), by Country 2024 & 2032
- Figure 28: Rest of the World Office Space Industry Revenue (Million), by Building Type 2024 & 2032
- Figure 29: Rest of the World Office Space Industry Revenue Share (%), by Building Type 2024 & 2032
- Figure 30: Rest of the World Office Space Industry Revenue (Million), by End User 2024 & 2032
- Figure 31: Rest of the World Office Space Industry Revenue Share (%), by End User 2024 & 2032
- Figure 32: Rest of the World Office Space Industry Revenue (Million), by Country 2024 & 2032
- Figure 33: Rest of the World Office Space Industry Revenue Share (%), by Country 2024 & 2032
List of Tables
- Table 1: Global Office Space Industry Revenue Million Forecast, by Region 2019 & 2032
- Table 2: Global Office Space Industry Revenue Million Forecast, by Building Type 2019 & 2032
- Table 3: Global Office Space Industry Revenue Million Forecast, by End User 2019 & 2032
- Table 4: Global Office Space Industry Revenue Million Forecast, by Region 2019 & 2032
- Table 5: Global Office Space Industry Revenue Million Forecast, by Country 2019 & 2032
- Table 6: Office Space Industry Revenue (Million) Forecast, by Application 2019 & 2032
- Table 7: Global Office Space Industry Revenue Million Forecast, by Country 2019 & 2032
- Table 8: Office Space Industry Revenue (Million) Forecast, by Application 2019 & 2032
- Table 9: Global Office Space Industry Revenue Million Forecast, by Country 2019 & 2032
- Table 10: Office Space Industry Revenue (Million) Forecast, by Application 2019 & 2032
- Table 11: Global Office Space Industry Revenue Million Forecast, by Country 2019 & 2032
- Table 12: Office Space Industry Revenue (Million) Forecast, by Application 2019 & 2032
- Table 13: Global Office Space Industry Revenue Million Forecast, by Building Type 2019 & 2032
- Table 14: Global Office Space Industry Revenue Million Forecast, by End User 2019 & 2032
- Table 15: Global Office Space Industry Revenue Million Forecast, by Country 2019 & 2032
- Table 16: Global Office Space Industry Revenue Million Forecast, by Building Type 2019 & 2032
- Table 17: Global Office Space Industry Revenue Million Forecast, by End User 2019 & 2032
- Table 18: Global Office Space Industry Revenue Million Forecast, by Country 2019 & 2032
- Table 19: Global Office Space Industry Revenue Million Forecast, by Building Type 2019 & 2032
- Table 20: Global Office Space Industry Revenue Million Forecast, by End User 2019 & 2032
- Table 21: Global Office Space Industry Revenue Million Forecast, by Country 2019 & 2032
- Table 22: Global Office Space Industry Revenue Million Forecast, by Building Type 2019 & 2032
- Table 23: Global Office Space Industry Revenue Million Forecast, by End User 2019 & 2032
- Table 24: Global Office Space Industry Revenue Million Forecast, by Country 2019 & 2032
Frequently Asked Questions
1. What is the projected Compound Annual Growth Rate (CAGR) of the Office Space Industry?
The projected CAGR is approximately > 10.00%.
2. Which companies are prominent players in the Office Space Industry?
Key companies in the market include Servcorp, CBRE Group Inc, WeWork, Jones Lang LaSalle Incorporated, Knotel Inc, IWG PLC, Mitsui Fudosan Co Ltd, The Office Group, Regus, WOJO**List Not Exhaustive 7 3 Other Companie.
3. What are the main segments of the Office Space Industry?
The market segments include Building Type, End User.
4. Can you provide details about the market size?
The market size is estimated to be USD XX Million as of 2022.
5. What are some drivers contributing to market growth?
4.; Increase in Aging Population Driving the Market4.; Healthcare and Long-term Care Needs Driving the Market.
6. What are the notable trends driving market growth?
Increase in Office Space Vacancy Rate.
7. Are there any restraints impacting market growth?
4.; High Affordability and Cost of Care Affecting the Market4.; Staffing and Workforce Challenges Affecting the Market.
8. Can you provide examples of recent developments in the market?
N/A
9. What pricing options are available for accessing the report?
Pricing options include single-user, multi-user, and enterprise licenses priced at USD 4750, USD 5250, and USD 8750 respectively.
10. Is the market size provided in terms of value or volume?
The market size is provided in terms of value, measured in Million.
11. Are there any specific market keywords associated with the report?
Yes, the market keyword associated with the report is "Office Space Industry," which aids in identifying and referencing the specific market segment covered.
12. How do I determine which pricing option suits my needs best?
The pricing options vary based on user requirements and access needs. Individual users may opt for single-user licenses, while businesses requiring broader access may choose multi-user or enterprise licenses for cost-effective access to the report.
13. Are there any additional resources or data provided in the Office Space Industry report?
While the report offers comprehensive insights, it's advisable to review the specific contents or supplementary materials provided to ascertain if additional resources or data are available.
14. How can I stay updated on further developments or reports in the Office Space Industry?
To stay informed about further developments, trends, and reports in the Office Space Industry, consider subscribing to industry newsletters, following relevant companies and organizations, or regularly checking reputable industry news sources and publications.
Methodology
Step 1 - Identification of Relevant Samples Size from Population Database


Step 2 - Approaches for Defining Global Market Size (Value, Volume* & Price*)

Note*: In applicable scenarios
Step 3 - Data Sources
Primary Research
- Web Analytics
- Survey Reports
- Research Institute
- Latest Research Reports
- Opinion Leaders
Secondary Research
- Annual Reports
- White Paper
- Latest Press Release
- Industry Association
- Paid Database
- Investor Presentations

Step 4 - Data Triangulation
Involves using different sources of information in order to increase the validity of a study
These sources are likely to be stakeholders in a program - participants, other researchers, program staff, other community members, and so on.
Then we put all data in single framework & apply various statistical tools to find out the dynamic on the market.
During the analysis stage, feedback from the stakeholder groups would be compared to determine areas of agreement as well as areas of divergence
