

Key Insights
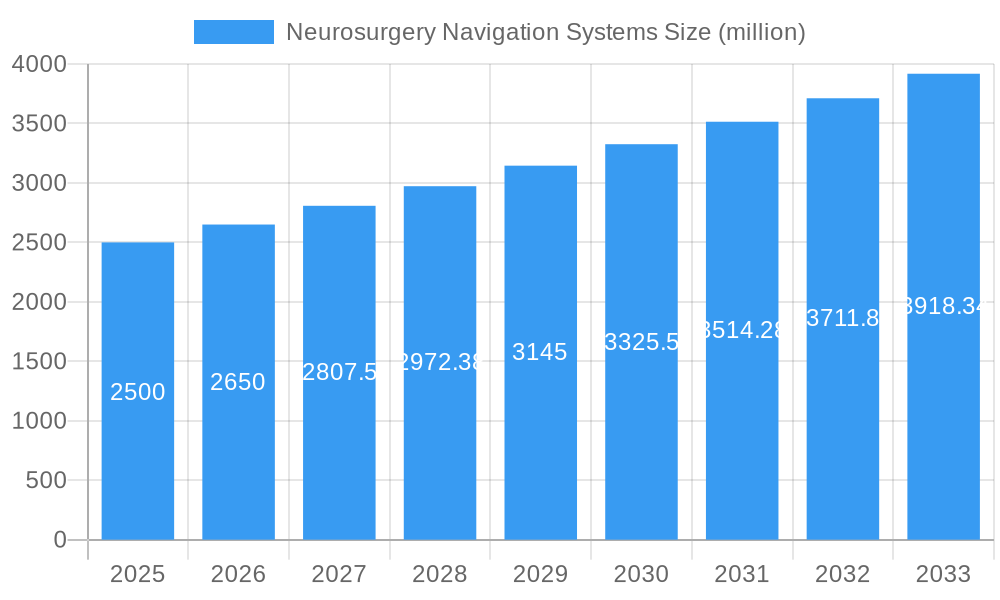
The global neurosurgery navigation systems market is poised for significant expansion, projected to reach $2.6 billion by 2025, with a Compound Annual Growth Rate (CAGR) of 7.7%. This growth is attributed to the rising incidence of neurological disorders, advancements in minimally invasive surgical techniques, and the increasing demand for enhanced surgical precision and improved patient outcomes. The market is segmented by application (hospitals, neurology clinics, ambulatory surgical centers (ASCs), research centers) and type (optical, electromagnetic, others). Hospitals currently lead in adoption due to robust infrastructure and high procedure volumes. However, ASCs are expected to experience rapid growth, driven by cost-effectiveness and patient preference for outpatient care. Technological innovations, particularly in image-guided surgery and robotic-assisted navigation, are key market accelerators. Leading companies like Medtronic, Brainlab, and Stryker are actively investing in research and development to boost system capabilities, accuracy, and product offerings. Intense competition is evident through technological innovation, strategic alliances, and mergers and acquisitions. North America and Europe currently dominate the market due to advanced healthcare infrastructure and high adoption rates. Asia-Pacific, however, shows promising growth due to escalating healthcare spending and growing awareness of advanced surgical methods. Regulatory approvals and reimbursement policies are critical for market penetration and growth across different regions.
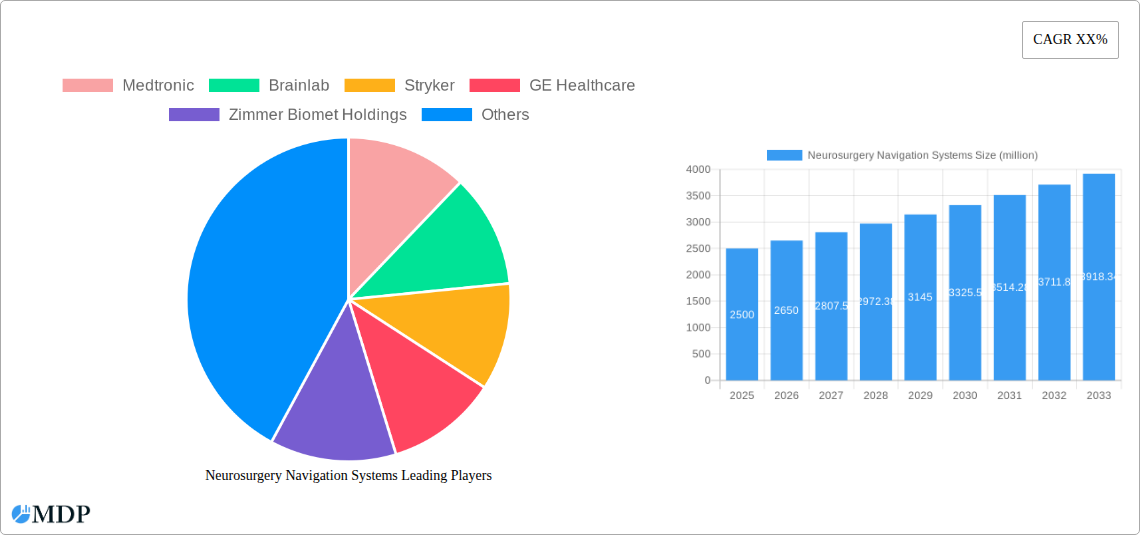
Neurosurgery Navigation Systems Market Size (In Billion)
Future market expansion will be influenced by continued advancements in imaging technologies, such as intraoperative MRI and CT, which will enhance the sophistication and precision of neurosurgical navigation systems. The integration of artificial intelligence (AI) and machine learning (ML) offers substantial potential to improve accuracy, efficiency, and personalized treatment planning. Furthermore, the growing availability of skilled neurosurgeons and a focus on training programs will be crucial for market adoption, especially in emerging economies. However, the high cost of these systems and the necessity for specialized training may present some constraints to market growth.
Neurosurgery Navigation Systems Company Market Share
Neurosurgery Navigation Systems Market Report: 2019-2033
This comprehensive report provides a detailed analysis of the global Neurosurgery Navigation Systems market, projecting a market valuation of $XX million by 2033. This in-depth study covers market dynamics, leading players, technological advancements, and future growth opportunities, offering invaluable insights for stakeholders across the neurosurgery landscape. The report meticulously examines the market from 2019 to 2024 (Historical Period), with a focus on the Base Year 2025 and forecasts extending to 2033 (Forecast Period).
Neurosurgery Navigation Systems Market Dynamics & Concentration
The global neurosurgery navigation systems market, valued at $XX million in 2025, is characterized by a moderately concentrated landscape. Key players such as Medtronic, Brainlab, and Stryker hold significant market share, driving innovation and shaping market trends. The market is fueled by several factors:
- Technological Advancements: Continuous innovation in image processing, AI integration, and minimally invasive techniques is expanding applications and improving surgical precision.
- Regulatory Landscape: Stringent regulatory approvals and safety standards are ensuring product quality and patient safety, although these can also pose challenges for smaller players.
- Product Substitutes: While advancements in image-guided surgery reduce the reliance on traditional methods, alternative techniques like frameless stereotaxy present some competition.
- End-User Trends: The increasing preference for minimally invasive procedures, coupled with the growing elderly population susceptible to neurological disorders, drives market demand.
- M&A Activities: The market has witnessed a moderate level of mergers and acquisitions (M&A) activity in recent years. XX major M&A deals were recorded between 2019 and 2024, consolidating market share and fostering innovation. Market leaders, holding approximately XX% of the total market share, are predicted to aggressively pursue strategic partnerships to enhance their competitive positions.
Neurosurgery Navigation Systems Industry Trends & Analysis
The neurosurgery navigation systems market exhibits a robust CAGR of XX% during the forecast period (2025-2033). Several factors contribute to this growth:
The increasing prevalence of neurological diseases, such as brain tumors, stroke, and epilepsy, is a major driver. Technological disruptions, particularly the integration of AI and machine learning, are enhancing the accuracy and efficiency of neurosurgical procedures. Consumer preference for minimally invasive surgeries with shorter recovery times further fuels demand. Competitive dynamics are characterized by intense R&D investment and the launch of advanced systems with improved features such as real-time tracking and intraoperative imaging. Market penetration is gradually increasing, particularly in developed regions with advanced healthcare infrastructure.
Leading Markets & Segments in Neurosurgery Navigation Systems
The Hospitals segment dominates the application market, accounting for approximately XX% of the total revenue in 2025. This is driven by the high volume of neurosurgical procedures performed in hospitals and the availability of advanced infrastructure.
- Key Drivers for Hospitals Segment Dominance:
- High concentration of neurosurgical specialists.
- Availability of sophisticated equipment and infrastructure.
- Government funding and healthcare policies supportive of advanced surgical procedures.
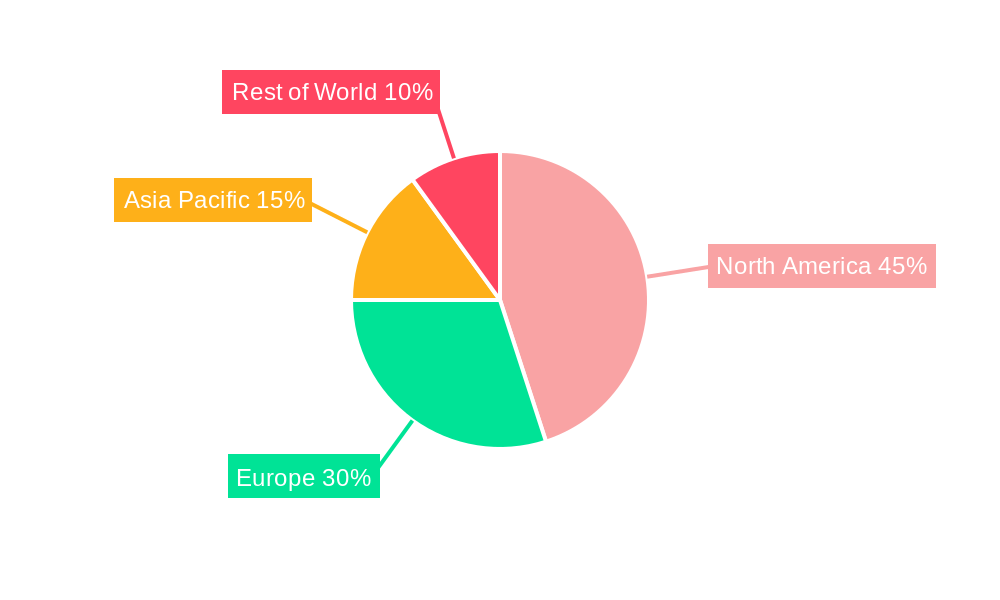
The Electromagnetic Navigation Systems segment leads in terms of type, holding a market share of approximately XX% in 2025, due to its relative ease of use, versatility and accuracy. North America is predicted to remain the leading regional market, fueled by advanced healthcare infrastructure and high adoption rates. Europe follows closely, exhibiting significant growth potential.
Neurosurgery Navigation Systems Product Developments
Recent product developments focus on enhancing accuracy, minimizing invasiveness, and integrating advanced imaging modalities. Companies are incorporating AI-powered image analysis and real-time tracking to improve surgical precision. The development of smaller, more portable systems facilitates wider accessibility, especially in ASCs and remote areas. These innovations aim to improve patient outcomes and streamline surgical workflows.
Key Drivers of Neurosurgery Navigation Systems Growth
The market is driven by a confluence of factors:
- Technological Advancements: Miniaturization, integration of AI and machine learning, and improved image quality lead to increased accuracy and efficiency.
- Economic Factors: Increased healthcare expenditure in developing nations is fueling market expansion.
- Regulatory Support: Favorable regulatory policies that streamline approvals accelerate market growth.
Challenges in the Neurosurgery Navigation Systems Market
Significant challenges include:
- High Initial Investment Costs: The expense of acquiring and maintaining these advanced systems limits market penetration in resource-constrained settings. This creates a barrier to entry for smaller players and potentially limits accessibility in under-resourced healthcare facilities.
- Stringent Regulatory Approvals: The rigorous regulatory pathway for new devices can delay product launches and increase development costs.
- Intense Competition: The presence of established market players and emerging companies creates fierce competition, requiring continuous innovation to maintain market share.
Emerging Opportunities in Neurosurgery Navigation Systems
The market offers substantial long-term growth prospects driven by technological breakthroughs, such as the development of augmented reality (AR) and virtual reality (VR) integrated systems. Strategic partnerships between device manufacturers and healthcare providers are enhancing market access and expanding application areas. Expansion into emerging markets with growing healthcare infrastructure offers significant untapped potential.
Leading Players in the Neurosurgery Navigation Systems Sector
- Medtronic
- Brainlab
- Stryker
- GE Healthcare
- Zimmer Biomet Holdings
- Braun Melsungen
- Fiagon
- Siemens Healthineers
- Amplitude Surgical
- Karl Storz
- Synaptive Medical
- Soterix Medical
- Nexstim
- ClaroNav
- Northern Digital
Key Milestones in Neurosurgery Navigation Systems Industry
- 2020: Launch of a new AI-powered navigation system by Medtronic.
- 2021: Acquisition of a smaller navigation system company by Stryker.
- 2022: FDA approval of a novel optical navigation system.
- 2023: Introduction of a robotic-assisted neurosurgery navigation system.
- 2024: Significant advancements in intraoperative imaging capabilities.
Strategic Outlook for Neurosurgery Navigation Systems Market
The neurosurgery navigation systems market is poised for continued growth driven by technological innovation, expanding applications, and increasing adoption in emerging markets. Strategic partnerships, focused R&D, and a proactive approach to regulatory compliance will be crucial for success in this dynamic and competitive landscape. The market's future potential is substantial, particularly with the integration of advanced technologies such as AI, AR/VR and robotic assistance, leading to even more precise, minimally invasive surgical procedures.
Neurosurgery Navigation Systems Segmentation
-
1. Application
- 1.1. Hospitals
- 1.2. Neurology Clinic
- 1.3. Ambulatory Surgical Centers (ASCs)
- 1.4. Research Centers
-
2. Types
- 2.1. Optical Navigation Systems
- 2.2. Electromagnetic Navigation Systems
- 2.3. Others
Neurosurgery Navigation Systems Segmentation By Geography
-
1. North America
- 1.1. United States
- 1.2. Canada
- 1.3. Mexico
-
2. South America
- 2.1. Brazil
- 2.2. Argentina
- 2.3. Rest of South America
-
3. Europe
- 3.1. United Kingdom
- 3.2. Germany
- 3.3. France
- 3.4. Italy
- 3.5. Spain
- 3.6. Russia
- 3.7. Benelux
- 3.8. Nordics
- 3.9. Rest of Europe
-
4. Middle East & Africa
- 4.1. Turkey
- 4.2. Israel
- 4.3. GCC
- 4.4. North Africa
- 4.5. South Africa
- 4.6. Rest of Middle East & Africa
-
5. Asia Pacific
- 5.1. China
- 5.2. India
- 5.3. Japan
- 5.4. South Korea
- 5.5. ASEAN
- 5.6. Oceania
- 5.7. Rest of Asia Pacific
Neurosurgery Navigation Systems Regional Market Share
Geographic Coverage of Neurosurgery Navigation Systems
Neurosurgery Navigation Systems REPORT HIGHLIGHTS
| Aspects | Details |
|---|---|
| Study Period | 2020-2034 |
| Base Year | 2025 |
| Estimated Year | 2026 |
| Forecast Period | 2026-2034 |
| Historical Period | 2020-2025 |
| Growth Rate | CAGR of 7.7% from 2020-2034 |
| Segmentation |
|
Table of Contents
- 1. Introduction
- 1.1. Research Scope
- 1.2. Market Segmentation
- 1.3. Research Methodology
- 1.4. Definitions and Assumptions
- 2. Executive Summary
- 2.1. Introduction
- 3. Market Dynamics
- 3.1. Introduction
- 3.2. Market Drivers
- 3.3. Market Restrains
- 3.4. Market Trends
- 4. Market Factor Analysis
- 4.1. Porters Five Forces
- 4.2. Supply/Value Chain
- 4.3. PESTEL analysis
- 4.4. Market Entropy
- 4.5. Patent/Trademark Analysis
- 5. Global Neurosurgery Navigation Systems Analysis, Insights and Forecast, 2020-2032
- 5.1. Market Analysis, Insights and Forecast - by Application
- 5.1.1. Hospitals
- 5.1.2. Neurology Clinic
- 5.1.3. Ambulatory Surgical Centers (ASCs)
- 5.1.4. Research Centers
- 5.2. Market Analysis, Insights and Forecast - by Types
- 5.2.1. Optical Navigation Systems
- 5.2.2. Electromagnetic Navigation Systems
- 5.2.3. Others
- 5.3. Market Analysis, Insights and Forecast - by Region
- 5.3.1. North America
- 5.3.2. South America
- 5.3.3. Europe
- 5.3.4. Middle East & Africa
- 5.3.5. Asia Pacific
- 5.1. Market Analysis, Insights and Forecast - by Application
- 6. North America Neurosurgery Navigation Systems Analysis, Insights and Forecast, 2020-2032
- 6.1. Market Analysis, Insights and Forecast - by Application
- 6.1.1. Hospitals
- 6.1.2. Neurology Clinic
- 6.1.3. Ambulatory Surgical Centers (ASCs)
- 6.1.4. Research Centers
- 6.2. Market Analysis, Insights and Forecast - by Types
- 6.2.1. Optical Navigation Systems
- 6.2.2. Electromagnetic Navigation Systems
- 6.2.3. Others
- 6.1. Market Analysis, Insights and Forecast - by Application
- 7. South America Neurosurgery Navigation Systems Analysis, Insights and Forecast, 2020-2032
- 7.1. Market Analysis, Insights and Forecast - by Application
- 7.1.1. Hospitals
- 7.1.2. Neurology Clinic
- 7.1.3. Ambulatory Surgical Centers (ASCs)
- 7.1.4. Research Centers
- 7.2. Market Analysis, Insights and Forecast - by Types
- 7.2.1. Optical Navigation Systems
- 7.2.2. Electromagnetic Navigation Systems
- 7.2.3. Others
- 7.1. Market Analysis, Insights and Forecast - by Application
- 8. Europe Neurosurgery Navigation Systems Analysis, Insights and Forecast, 2020-2032
- 8.1. Market Analysis, Insights and Forecast - by Application
- 8.1.1. Hospitals
- 8.1.2. Neurology Clinic
- 8.1.3. Ambulatory Surgical Centers (ASCs)
- 8.1.4. Research Centers
- 8.2. Market Analysis, Insights and Forecast - by Types
- 8.2.1. Optical Navigation Systems
- 8.2.2. Electromagnetic Navigation Systems
- 8.2.3. Others
- 8.1. Market Analysis, Insights and Forecast - by Application
- 9. Middle East & Africa Neurosurgery Navigation Systems Analysis, Insights and Forecast, 2020-2032
- 9.1. Market Analysis, Insights and Forecast - by Application
- 9.1.1. Hospitals
- 9.1.2. Neurology Clinic
- 9.1.3. Ambulatory Surgical Centers (ASCs)
- 9.1.4. Research Centers
- 9.2. Market Analysis, Insights and Forecast - by Types
- 9.2.1. Optical Navigation Systems
- 9.2.2. Electromagnetic Navigation Systems
- 9.2.3. Others
- 9.1. Market Analysis, Insights and Forecast - by Application
- 10. Asia Pacific Neurosurgery Navigation Systems Analysis, Insights and Forecast, 2020-2032
- 10.1. Market Analysis, Insights and Forecast - by Application
- 10.1.1. Hospitals
- 10.1.2. Neurology Clinic
- 10.1.3. Ambulatory Surgical Centers (ASCs)
- 10.1.4. Research Centers
- 10.2. Market Analysis, Insights and Forecast - by Types
- 10.2.1. Optical Navigation Systems
- 10.2.2. Electromagnetic Navigation Systems
- 10.2.3. Others
- 10.1. Market Analysis, Insights and Forecast - by Application
- 11. Competitive Analysis
- 11.1. Global Market Share Analysis 2025
- 11.2. Company Profiles
- 11.2.1 Medtronic
- 11.2.1.1. Overview
- 11.2.1.2. Products
- 11.2.1.3. SWOT Analysis
- 11.2.1.4. Recent Developments
- 11.2.1.5. Financials (Based on Availability)
- 11.2.2 Brainlab
- 11.2.2.1. Overview
- 11.2.2.2. Products
- 11.2.2.3. SWOT Analysis
- 11.2.2.4. Recent Developments
- 11.2.2.5. Financials (Based on Availability)
- 11.2.3 Stryker
- 11.2.3.1. Overview
- 11.2.3.2. Products
- 11.2.3.3. SWOT Analysis
- 11.2.3.4. Recent Developments
- 11.2.3.5. Financials (Based on Availability)
- 11.2.4 GE Healthcare
- 11.2.4.1. Overview
- 11.2.4.2. Products
- 11.2.4.3. SWOT Analysis
- 11.2.4.4. Recent Developments
- 11.2.4.5. Financials (Based on Availability)
- 11.2.5 Zimmer Biomet Holdings
- 11.2.5.1. Overview
- 11.2.5.2. Products
- 11.2.5.3. SWOT Analysis
- 11.2.5.4. Recent Developments
- 11.2.5.5. Financials (Based on Availability)
- 11.2.6 Braun Melsungen
- 11.2.6.1. Overview
- 11.2.6.2. Products
- 11.2.6.3. SWOT Analysis
- 11.2.6.4. Recent Developments
- 11.2.6.5. Financials (Based on Availability)
- 11.2.7 Fiagon
- 11.2.7.1. Overview
- 11.2.7.2. Products
- 11.2.7.3. SWOT Analysis
- 11.2.7.4. Recent Developments
- 11.2.7.5. Financials (Based on Availability)
- 11.2.8 Siemens Healthineers
- 11.2.8.1. Overview
- 11.2.8.2. Products
- 11.2.8.3. SWOT Analysis
- 11.2.8.4. Recent Developments
- 11.2.8.5. Financials (Based on Availability)
- 11.2.9 Amplitude Surgical
- 11.2.9.1. Overview
- 11.2.9.2. Products
- 11.2.9.3. SWOT Analysis
- 11.2.9.4. Recent Developments
- 11.2.9.5. Financials (Based on Availability)
- 11.2.10 Karl Storz
- 11.2.10.1. Overview
- 11.2.10.2. Products
- 11.2.10.3. SWOT Analysis
- 11.2.10.4. Recent Developments
- 11.2.10.5. Financials (Based on Availability)
- 11.2.11 Synaptive Medical
- 11.2.11.1. Overview
- 11.2.11.2. Products
- 11.2.11.3. SWOT Analysis
- 11.2.11.4. Recent Developments
- 11.2.11.5. Financials (Based on Availability)
- 11.2.12 Soterix Medical
- 11.2.12.1. Overview
- 11.2.12.2. Products
- 11.2.12.3. SWOT Analysis
- 11.2.12.4. Recent Developments
- 11.2.12.5. Financials (Based on Availability)
- 11.2.13 Nexstim
- 11.2.13.1. Overview
- 11.2.13.2. Products
- 11.2.13.3. SWOT Analysis
- 11.2.13.4. Recent Developments
- 11.2.13.5. Financials (Based on Availability)
- 11.2.14 ClaroNav
- 11.2.14.1. Overview
- 11.2.14.2. Products
- 11.2.14.3. SWOT Analysis
- 11.2.14.4. Recent Developments
- 11.2.14.5. Financials (Based on Availability)
- 11.2.15 Northern Digital
- 11.2.15.1. Overview
- 11.2.15.2. Products
- 11.2.15.3. SWOT Analysis
- 11.2.15.4. Recent Developments
- 11.2.15.5. Financials (Based on Availability)
- 11.2.1 Medtronic
List of Figures
- Figure 1: Global Neurosurgery Navigation Systems Revenue Breakdown (billion, %) by Region 2025 & 2033
- Figure 2: Global Neurosurgery Navigation Systems Volume Breakdown (K, %) by Region 2025 & 2033
- Figure 3: North America Neurosurgery Navigation Systems Revenue (billion), by Application 2025 & 2033
- Figure 4: North America Neurosurgery Navigation Systems Volume (K), by Application 2025 & 2033
- Figure 5: North America Neurosurgery Navigation Systems Revenue Share (%), by Application 2025 & 2033
- Figure 6: North America Neurosurgery Navigation Systems Volume Share (%), by Application 2025 & 2033
- Figure 7: North America Neurosurgery Navigation Systems Revenue (billion), by Types 2025 & 2033
- Figure 8: North America Neurosurgery Navigation Systems Volume (K), by Types 2025 & 2033
- Figure 9: North America Neurosurgery Navigation Systems Revenue Share (%), by Types 2025 & 2033
- Figure 10: North America Neurosurgery Navigation Systems Volume Share (%), by Types 2025 & 2033
- Figure 11: North America Neurosurgery Navigation Systems Revenue (billion), by Country 2025 & 2033
- Figure 12: North America Neurosurgery Navigation Systems Volume (K), by Country 2025 & 2033
- Figure 13: North America Neurosurgery Navigation Systems Revenue Share (%), by Country 2025 & 2033
- Figure 14: North America Neurosurgery Navigation Systems Volume Share (%), by Country 2025 & 2033
- Figure 15: South America Neurosurgery Navigation Systems Revenue (billion), by Application 2025 & 2033
- Figure 16: South America Neurosurgery Navigation Systems Volume (K), by Application 2025 & 2033
- Figure 17: South America Neurosurgery Navigation Systems Revenue Share (%), by Application 2025 & 2033
- Figure 18: South America Neurosurgery Navigation Systems Volume Share (%), by Application 2025 & 2033
- Figure 19: South America Neurosurgery Navigation Systems Revenue (billion), by Types 2025 & 2033
- Figure 20: South America Neurosurgery Navigation Systems Volume (K), by Types 2025 & 2033
- Figure 21: South America Neurosurgery Navigation Systems Revenue Share (%), by Types 2025 & 2033
- Figure 22: South America Neurosurgery Navigation Systems Volume Share (%), by Types 2025 & 2033
- Figure 23: South America Neurosurgery Navigation Systems Revenue (billion), by Country 2025 & 2033
- Figure 24: South America Neurosurgery Navigation Systems Volume (K), by Country 2025 & 2033
- Figure 25: South America Neurosurgery Navigation Systems Revenue Share (%), by Country 2025 & 2033
- Figure 26: South America Neurosurgery Navigation Systems Volume Share (%), by Country 2025 & 2033
- Figure 27: Europe Neurosurgery Navigation Systems Revenue (billion), by Application 2025 & 2033
- Figure 28: Europe Neurosurgery Navigation Systems Volume (K), by Application 2025 & 2033
- Figure 29: Europe Neurosurgery Navigation Systems Revenue Share (%), by Application 2025 & 2033
- Figure 30: Europe Neurosurgery Navigation Systems Volume Share (%), by Application 2025 & 2033
- Figure 31: Europe Neurosurgery Navigation Systems Revenue (billion), by Types 2025 & 2033
- Figure 32: Europe Neurosurgery Navigation Systems Volume (K), by Types 2025 & 2033
- Figure 33: Europe Neurosurgery Navigation Systems Revenue Share (%), by Types 2025 & 2033
- Figure 34: Europe Neurosurgery Navigation Systems Volume Share (%), by Types 2025 & 2033
- Figure 35: Europe Neurosurgery Navigation Systems Revenue (billion), by Country 2025 & 2033
- Figure 36: Europe Neurosurgery Navigation Systems Volume (K), by Country 2025 & 2033
- Figure 37: Europe Neurosurgery Navigation Systems Revenue Share (%), by Country 2025 & 2033
- Figure 38: Europe Neurosurgery Navigation Systems Volume Share (%), by Country 2025 & 2033
- Figure 39: Middle East & Africa Neurosurgery Navigation Systems Revenue (billion), by Application 2025 & 2033
- Figure 40: Middle East & Africa Neurosurgery Navigation Systems Volume (K), by Application 2025 & 2033
- Figure 41: Middle East & Africa Neurosurgery Navigation Systems Revenue Share (%), by Application 2025 & 2033
- Figure 42: Middle East & Africa Neurosurgery Navigation Systems Volume Share (%), by Application 2025 & 2033
- Figure 43: Middle East & Africa Neurosurgery Navigation Systems Revenue (billion), by Types 2025 & 2033
- Figure 44: Middle East & Africa Neurosurgery Navigation Systems Volume (K), by Types 2025 & 2033
- Figure 45: Middle East & Africa Neurosurgery Navigation Systems Revenue Share (%), by Types 2025 & 2033
- Figure 46: Middle East & Africa Neurosurgery Navigation Systems Volume Share (%), by Types 2025 & 2033
- Figure 47: Middle East & Africa Neurosurgery Navigation Systems Revenue (billion), by Country 2025 & 2033
- Figure 48: Middle East & Africa Neurosurgery Navigation Systems Volume (K), by Country 2025 & 2033
- Figure 49: Middle East & Africa Neurosurgery Navigation Systems Revenue Share (%), by Country 2025 & 2033
- Figure 50: Middle East & Africa Neurosurgery Navigation Systems Volume Share (%), by Country 2025 & 2033
- Figure 51: Asia Pacific Neurosurgery Navigation Systems Revenue (billion), by Application 2025 & 2033
- Figure 52: Asia Pacific Neurosurgery Navigation Systems Volume (K), by Application 2025 & 2033
- Figure 53: Asia Pacific Neurosurgery Navigation Systems Revenue Share (%), by Application 2025 & 2033
- Figure 54: Asia Pacific Neurosurgery Navigation Systems Volume Share (%), by Application 2025 & 2033
- Figure 55: Asia Pacific Neurosurgery Navigation Systems Revenue (billion), by Types 2025 & 2033
- Figure 56: Asia Pacific Neurosurgery Navigation Systems Volume (K), by Types 2025 & 2033
- Figure 57: Asia Pacific Neurosurgery Navigation Systems Revenue Share (%), by Types 2025 & 2033
- Figure 58: Asia Pacific Neurosurgery Navigation Systems Volume Share (%), by Types 2025 & 2033
- Figure 59: Asia Pacific Neurosurgery Navigation Systems Revenue (billion), by Country 2025 & 2033
- Figure 60: Asia Pacific Neurosurgery Navigation Systems Volume (K), by Country 2025 & 2033
- Figure 61: Asia Pacific Neurosurgery Navigation Systems Revenue Share (%), by Country 2025 & 2033
- Figure 62: Asia Pacific Neurosurgery Navigation Systems Volume Share (%), by Country 2025 & 2033
List of Tables
- Table 1: Global Neurosurgery Navigation Systems Revenue billion Forecast, by Application 2020 & 2033
- Table 2: Global Neurosurgery Navigation Systems Volume K Forecast, by Application 2020 & 2033
- Table 3: Global Neurosurgery Navigation Systems Revenue billion Forecast, by Types 2020 & 2033
- Table 4: Global Neurosurgery Navigation Systems Volume K Forecast, by Types 2020 & 2033
- Table 5: Global Neurosurgery Navigation Systems Revenue billion Forecast, by Region 2020 & 2033
- Table 6: Global Neurosurgery Navigation Systems Volume K Forecast, by Region 2020 & 2033
- Table 7: Global Neurosurgery Navigation Systems Revenue billion Forecast, by Application 2020 & 2033
- Table 8: Global Neurosurgery Navigation Systems Volume K Forecast, by Application 2020 & 2033
- Table 9: Global Neurosurgery Navigation Systems Revenue billion Forecast, by Types 2020 & 2033
- Table 10: Global Neurosurgery Navigation Systems Volume K Forecast, by Types 2020 & 2033
- Table 11: Global Neurosurgery Navigation Systems Revenue billion Forecast, by Country 2020 & 2033
- Table 12: Global Neurosurgery Navigation Systems Volume K Forecast, by Country 2020 & 2033
- Table 13: United States Neurosurgery Navigation Systems Revenue (billion) Forecast, by Application 2020 & 2033
- Table 14: United States Neurosurgery Navigation Systems Volume (K) Forecast, by Application 2020 & 2033
- Table 15: Canada Neurosurgery Navigation Systems Revenue (billion) Forecast, by Application 2020 & 2033
- Table 16: Canada Neurosurgery Navigation Systems Volume (K) Forecast, by Application 2020 & 2033
- Table 17: Mexico Neurosurgery Navigation Systems Revenue (billion) Forecast, by Application 2020 & 2033
- Table 18: Mexico Neurosurgery Navigation Systems Volume (K) Forecast, by Application 2020 & 2033
- Table 19: Global Neurosurgery Navigation Systems Revenue billion Forecast, by Application 2020 & 2033
- Table 20: Global Neurosurgery Navigation Systems Volume K Forecast, by Application 2020 & 2033
- Table 21: Global Neurosurgery Navigation Systems Revenue billion Forecast, by Types 2020 & 2033
- Table 22: Global Neurosurgery Navigation Systems Volume K Forecast, by Types 2020 & 2033
- Table 23: Global Neurosurgery Navigation Systems Revenue billion Forecast, by Country 2020 & 2033
- Table 24: Global Neurosurgery Navigation Systems Volume K Forecast, by Country 2020 & 2033
- Table 25: Brazil Neurosurgery Navigation Systems Revenue (billion) Forecast, by Application 2020 & 2033
- Table 26: Brazil Neurosurgery Navigation Systems Volume (K) Forecast, by Application 2020 & 2033
- Table 27: Argentina Neurosurgery Navigation Systems Revenue (billion) Forecast, by Application 2020 & 2033
- Table 28: Argentina Neurosurgery Navigation Systems Volume (K) Forecast, by Application 2020 & 2033
- Table 29: Rest of South America Neurosurgery Navigation Systems Revenue (billion) Forecast, by Application 2020 & 2033
- Table 30: Rest of South America Neurosurgery Navigation Systems Volume (K) Forecast, by Application 2020 & 2033
- Table 31: Global Neurosurgery Navigation Systems Revenue billion Forecast, by Application 2020 & 2033
- Table 32: Global Neurosurgery Navigation Systems Volume K Forecast, by Application 2020 & 2033
- Table 33: Global Neurosurgery Navigation Systems Revenue billion Forecast, by Types 2020 & 2033
- Table 34: Global Neurosurgery Navigation Systems Volume K Forecast, by Types 2020 & 2033
- Table 35: Global Neurosurgery Navigation Systems Revenue billion Forecast, by Country 2020 & 2033
- Table 36: Global Neurosurgery Navigation Systems Volume K Forecast, by Country 2020 & 2033
- Table 37: United Kingdom Neurosurgery Navigation Systems Revenue (billion) Forecast, by Application 2020 & 2033
- Table 38: United Kingdom Neurosurgery Navigation Systems Volume (K) Forecast, by Application 2020 & 2033
- Table 39: Germany Neurosurgery Navigation Systems Revenue (billion) Forecast, by Application 2020 & 2033
- Table 40: Germany Neurosurgery Navigation Systems Volume (K) Forecast, by Application 2020 & 2033
- Table 41: France Neurosurgery Navigation Systems Revenue (billion) Forecast, by Application 2020 & 2033
- Table 42: France Neurosurgery Navigation Systems Volume (K) Forecast, by Application 2020 & 2033
- Table 43: Italy Neurosurgery Navigation Systems Revenue (billion) Forecast, by Application 2020 & 2033
- Table 44: Italy Neurosurgery Navigation Systems Volume (K) Forecast, by Application 2020 & 2033
- Table 45: Spain Neurosurgery Navigation Systems Revenue (billion) Forecast, by Application 2020 & 2033
- Table 46: Spain Neurosurgery Navigation Systems Volume (K) Forecast, by Application 2020 & 2033
- Table 47: Russia Neurosurgery Navigation Systems Revenue (billion) Forecast, by Application 2020 & 2033
- Table 48: Russia Neurosurgery Navigation Systems Volume (K) Forecast, by Application 2020 & 2033
- Table 49: Benelux Neurosurgery Navigation Systems Revenue (billion) Forecast, by Application 2020 & 2033
- Table 50: Benelux Neurosurgery Navigation Systems Volume (K) Forecast, by Application 2020 & 2033
- Table 51: Nordics Neurosurgery Navigation Systems Revenue (billion) Forecast, by Application 2020 & 2033
- Table 52: Nordics Neurosurgery Navigation Systems Volume (K) Forecast, by Application 2020 & 2033
- Table 53: Rest of Europe Neurosurgery Navigation Systems Revenue (billion) Forecast, by Application 2020 & 2033
- Table 54: Rest of Europe Neurosurgery Navigation Systems Volume (K) Forecast, by Application 2020 & 2033
- Table 55: Global Neurosurgery Navigation Systems Revenue billion Forecast, by Application 2020 & 2033
- Table 56: Global Neurosurgery Navigation Systems Volume K Forecast, by Application 2020 & 2033
- Table 57: Global Neurosurgery Navigation Systems Revenue billion Forecast, by Types 2020 & 2033
- Table 58: Global Neurosurgery Navigation Systems Volume K Forecast, by Types 2020 & 2033
- Table 59: Global Neurosurgery Navigation Systems Revenue billion Forecast, by Country 2020 & 2033
- Table 60: Global Neurosurgery Navigation Systems Volume K Forecast, by Country 2020 & 2033
- Table 61: Turkey Neurosurgery Navigation Systems Revenue (billion) Forecast, by Application 2020 & 2033
- Table 62: Turkey Neurosurgery Navigation Systems Volume (K) Forecast, by Application 2020 & 2033
- Table 63: Israel Neurosurgery Navigation Systems Revenue (billion) Forecast, by Application 2020 & 2033
- Table 64: Israel Neurosurgery Navigation Systems Volume (K) Forecast, by Application 2020 & 2033
- Table 65: GCC Neurosurgery Navigation Systems Revenue (billion) Forecast, by Application 2020 & 2033
- Table 66: GCC Neurosurgery Navigation Systems Volume (K) Forecast, by Application 2020 & 2033
- Table 67: North Africa Neurosurgery Navigation Systems Revenue (billion) Forecast, by Application 2020 & 2033
- Table 68: North Africa Neurosurgery Navigation Systems Volume (K) Forecast, by Application 2020 & 2033
- Table 69: South Africa Neurosurgery Navigation Systems Revenue (billion) Forecast, by Application 2020 & 2033
- Table 70: South Africa Neurosurgery Navigation Systems Volume (K) Forecast, by Application 2020 & 2033
- Table 71: Rest of Middle East & Africa Neurosurgery Navigation Systems Revenue (billion) Forecast, by Application 2020 & 2033
- Table 72: Rest of Middle East & Africa Neurosurgery Navigation Systems Volume (K) Forecast, by Application 2020 & 2033
- Table 73: Global Neurosurgery Navigation Systems Revenue billion Forecast, by Application 2020 & 2033
- Table 74: Global Neurosurgery Navigation Systems Volume K Forecast, by Application 2020 & 2033
- Table 75: Global Neurosurgery Navigation Systems Revenue billion Forecast, by Types 2020 & 2033
- Table 76: Global Neurosurgery Navigation Systems Volume K Forecast, by Types 2020 & 2033
- Table 77: Global Neurosurgery Navigation Systems Revenue billion Forecast, by Country 2020 & 2033
- Table 78: Global Neurosurgery Navigation Systems Volume K Forecast, by Country 2020 & 2033
- Table 79: China Neurosurgery Navigation Systems Revenue (billion) Forecast, by Application 2020 & 2033
- Table 80: China Neurosurgery Navigation Systems Volume (K) Forecast, by Application 2020 & 2033
- Table 81: India Neurosurgery Navigation Systems Revenue (billion) Forecast, by Application 2020 & 2033
- Table 82: India Neurosurgery Navigation Systems Volume (K) Forecast, by Application 2020 & 2033
- Table 83: Japan Neurosurgery Navigation Systems Revenue (billion) Forecast, by Application 2020 & 2033
- Table 84: Japan Neurosurgery Navigation Systems Volume (K) Forecast, by Application 2020 & 2033
- Table 85: South Korea Neurosurgery Navigation Systems Revenue (billion) Forecast, by Application 2020 & 2033
- Table 86: South Korea Neurosurgery Navigation Systems Volume (K) Forecast, by Application 2020 & 2033
- Table 87: ASEAN Neurosurgery Navigation Systems Revenue (billion) Forecast, by Application 2020 & 2033
- Table 88: ASEAN Neurosurgery Navigation Systems Volume (K) Forecast, by Application 2020 & 2033
- Table 89: Oceania Neurosurgery Navigation Systems Revenue (billion) Forecast, by Application 2020 & 2033
- Table 90: Oceania Neurosurgery Navigation Systems Volume (K) Forecast, by Application 2020 & 2033
- Table 91: Rest of Asia Pacific Neurosurgery Navigation Systems Revenue (billion) Forecast, by Application 2020 & 2033
- Table 92: Rest of Asia Pacific Neurosurgery Navigation Systems Volume (K) Forecast, by Application 2020 & 2033
Frequently Asked Questions
1. What is the projected Compound Annual Growth Rate (CAGR) of the Neurosurgery Navigation Systems?
The projected CAGR is approximately 7.7%.
2. Which companies are prominent players in the Neurosurgery Navigation Systems?
Key companies in the market include Medtronic, Brainlab, Stryker, GE Healthcare, Zimmer Biomet Holdings, Braun Melsungen, Fiagon, Siemens Healthineers, Amplitude Surgical, Karl Storz, Synaptive Medical, Soterix Medical, Nexstim, ClaroNav, Northern Digital.
3. What are the main segments of the Neurosurgery Navigation Systems?
The market segments include Application, Types.
4. Can you provide details about the market size?
The market size is estimated to be USD 2.6 billion as of 2022.
5. What are some drivers contributing to market growth?
N/A
6. What are the notable trends driving market growth?
N/A
7. Are there any restraints impacting market growth?
N/A
8. Can you provide examples of recent developments in the market?
N/A
9. What pricing options are available for accessing the report?
Pricing options include single-user, multi-user, and enterprise licenses priced at USD 3950.00, USD 5925.00, and USD 7900.00 respectively.
10. Is the market size provided in terms of value or volume?
The market size is provided in terms of value, measured in billion and volume, measured in K.
11. Are there any specific market keywords associated with the report?
Yes, the market keyword associated with the report is "Neurosurgery Navigation Systems," which aids in identifying and referencing the specific market segment covered.
12. How do I determine which pricing option suits my needs best?
The pricing options vary based on user requirements and access needs. Individual users may opt for single-user licenses, while businesses requiring broader access may choose multi-user or enterprise licenses for cost-effective access to the report.
13. Are there any additional resources or data provided in the Neurosurgery Navigation Systems report?
While the report offers comprehensive insights, it's advisable to review the specific contents or supplementary materials provided to ascertain if additional resources or data are available.
14. How can I stay updated on further developments or reports in the Neurosurgery Navigation Systems?
To stay informed about further developments, trends, and reports in the Neurosurgery Navigation Systems, consider subscribing to industry newsletters, following relevant companies and organizations, or regularly checking reputable industry news sources and publications.
Methodology
Step 1 - Identification of Relevant Samples Size from Population Database


Step 2 - Approaches for Defining Global Market Size (Value, Volume* & Price*)

Note*: In applicable scenarios
Step 3 - Data Sources
Primary Research
- Web Analytics
- Survey Reports
- Research Institute
- Latest Research Reports
- Opinion Leaders
Secondary Research
- Annual Reports
- White Paper
- Latest Press Release
- Industry Association
- Paid Database
- Investor Presentations

Step 4 - Data Triangulation
Involves using different sources of information in order to increase the validity of a study
These sources are likely to be stakeholders in a program - participants, other researchers, program staff, other community members, and so on.
Then we put all data in single framework & apply various statistical tools to find out the dynamic on the market.
During the analysis stage, feedback from the stakeholder groups would be compared to determine areas of agreement as well as areas of divergence