

Key Insights
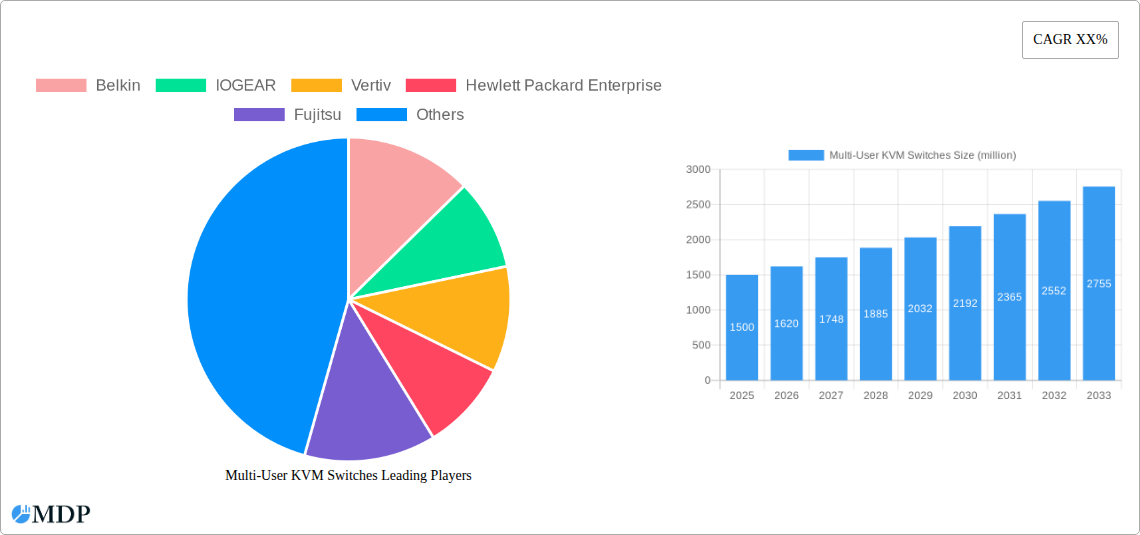
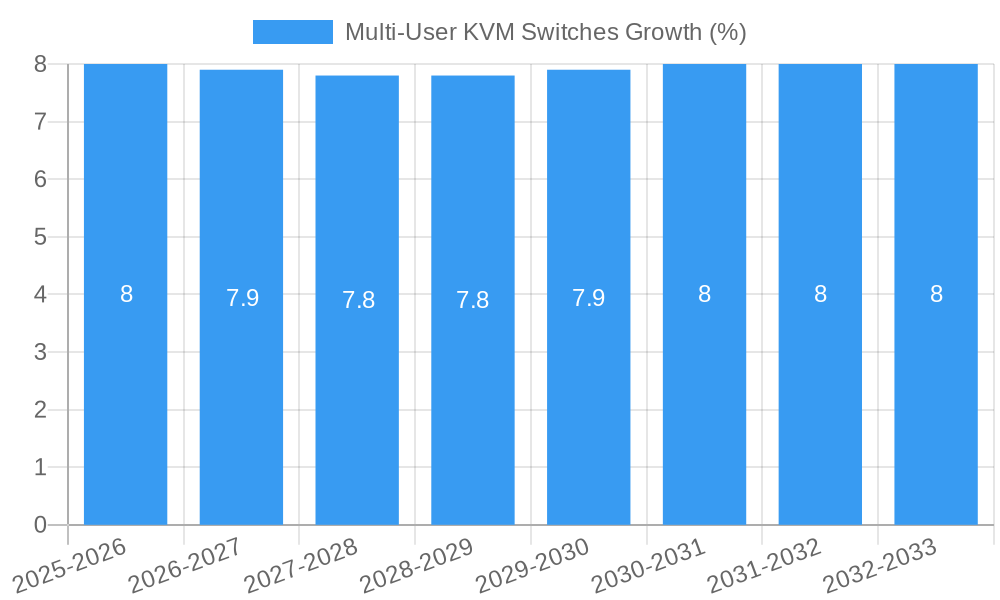
The Multi-User KVM Switch market is poised for significant expansion, projected to reach approximately $1,500 million by 2025, and is expected to grow at a Compound Annual Growth Rate (CAGR) of roughly 8% through 2033. This robust growth is primarily fueled by the increasing demand for centralized control and efficient management of multiple servers and workstations, particularly within IT infrastructure of both small and large enterprises. The burgeoning adoption of advanced IT solutions, the proliferation of data centers, and the critical need for secure access to sensitive information are key drivers propelling this market forward. Furthermore, the continuous evolution of KVM technology, including the introduction of high-performance and secure switch variants, is enhancing functionality and driving adoption across diverse applications. As businesses increasingly rely on complex IT ecosystems, the imperative for streamlined hardware management and enhanced operational efficiency makes multi-user KVM switches an indispensable component.
The market is segmented by application into Small and Medium Enterprises (SMEs) and Large Enterprises, with Large Enterprises representing the dominant segment due to their extensive server farms and complex IT environments. By type, KVM Desktop Switches, KVM IP Switches, KVM Secure Switches, and KVM High-Performance Switches cater to a spectrum of needs, from basic desktop control to advanced, secure remote access. Key trends include the growing demand for IP-based KVM solutions enabling remote access and management, and the increasing emphasis on secure KVM switches to protect against cyber threats. However, the market faces restraints such as the initial cost of deployment for some advanced solutions and the requirement for technical expertise in managing complex KVM systems. Prominent companies like Belkin, IOGEAR, Vertiv, Hewlett Packard Enterprise, and Schneider Electric are actively innovating and competing, shaping the market landscape with their diverse product portfolios.
Multi-User KVM Switches Market: Comprehensive Growth Analysis & Strategic Insights (2019–2033)
Unlock unparalleled access to the burgeoning Multi-User KVM Switches market with this in-depth report. Explore critical industry dynamics, cutting-edge product developments, and future growth trajectories from 2019 to 2033. This comprehensive analysis, with a base year of 2025, provides actionable insights for Small and Medium Enterprises (SMEs), Large Enterprises, and key stakeholders navigating the evolving landscape of KVM Desktop Switches, KVM IP Switches, KVM Secure Switches, and KVM High-Performance Switches. Dive deep into market concentration, innovation drivers, regulatory frameworks, and the competitive strategies of industry giants like Belkin, IOGEAR, Vertiv, Hewlett Packard Enterprise, Fujitsu, Schneider Electric, Thinklogical, Tripp Lite, Legrand, Lenovo, and Aten.
Multi-User KVM Switches Market Dynamics & Concentration
The Multi-User KVM Switches market is characterized by a moderate to high concentration, with a few key players holding significant market share. Innovation drivers are primarily centered around enhanced security features, increased bandwidth support for high-resolution video (4K, 8K), and seamless integration with cloud-based management solutions. Regulatory frameworks, particularly in government and defense sectors, impose stringent requirements on KVM Secure Switches, influencing product design and adoption. Product substitutes, while existing, often lack the centralized control and efficiency offered by multi-user KVM solutions. End-user trends show a growing demand for remote access capabilities, driven by hybrid work models and the need for efficient IT infrastructure management in data centers and control rooms. Mergers and Acquisition (M&A) activities are sporadic but significant, often aimed at consolidating market presence or acquiring specialized technological capabilities. For instance, the historical period saw an estimated 15 M&A deals impacting the competitive landscape, with a projected 20 M&A deals anticipated during the forecast period, indicative of ongoing consolidation.
Multi-User KVM Switches Industry Trends & Analysis
The Multi-User KVM Switches industry is poised for robust expansion, driven by an escalating need for centralized control and efficient management of multiple servers and devices across diverse applications. The projected Compound Annual Growth Rate (CAGR) for the forecast period (2025–2033) is estimated at XX%, reflecting sustained market momentum. Key growth drivers include the proliferation of data centers, the increasing complexity of IT infrastructures in Large Enterprises, and the growing adoption of advanced technologies such as IoT and AI, which necessitate sophisticated device management. Technological disruptions are at the forefront, with the evolution of KVM IP Switches offering enhanced remote access and virtualized environments, and the continuous refinement of KVM High-Performance Switches to support higher resolutions and faster data transfer rates. Consumer preferences are shifting towards user-friendly interfaces, greater scalability, and robust security protocols, especially for sensitive applications within government and finance. The competitive dynamics are intensifying, with established players investing heavily in research and development to offer differentiated products and solutions, while new entrants focus on niche markets and disruptive technologies. Market penetration is expected to deepen, particularly in emerging economies, as the benefits of centralized KVM solutions become more widely recognized. The overall market size is projected to reach XX billion USD by 2033, a significant increase from the estimated XX billion USD in the base year of 2025.
Leading Markets & Segments in Multi-User KVM Switches
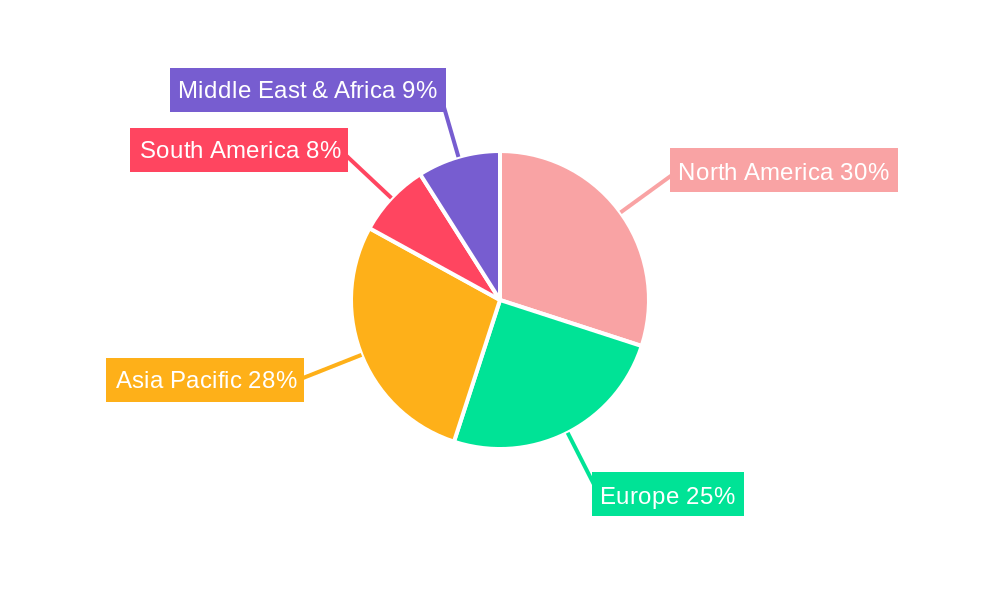
The North America region currently dominates the Multi-User KVM Switches market, driven by a mature IT infrastructure, a high concentration of Large Enterprises, and significant investments in data centers and critical infrastructure. Within this region, the United States leads in terms of market size and adoption.
Application Segments Dominance:
- Large Enterprises: These organizations represent the largest segment due to their extensive IT deployments, critical operational requirements, and the need for robust, centralized control over numerous servers and workstations. Their investments in data centers, cybersecurity, and mission-critical control rooms fuel the demand for high-performance and secure KVM solutions.
- Small and Medium Enterprises (SMEs): While a smaller segment historically, SMEs are increasingly recognizing the cost and efficiency benefits of KVM solutions, particularly with the availability of more affordable and user-friendly options. Their growth is driven by the need to optimize IT resources and manage growing digital footprints.
Type Segments Dominance:
- KVM IP Switches: This segment is experiencing the most rapid growth due to the increasing demand for remote access, virtual desktop infrastructure (VDI), and the flexibility offered by IP-based connectivity. They are crucial for modern IT management and support for hybrid work environments.
- KVM High-Performance Switches: Essential for demanding applications such as video editing, CAD/CAM, broadcasting, and command and control centers, these switches are vital for industries requiring uncompromised performance and high-resolution video support.
- KVM Secure Switches: Critical for government, military, and highly regulated industries, these switches offer advanced security features like physical isolation and Tamper-Evident seals to protect against cyber threats and unauthorized access.
- KVM Desktop Switches: While simpler in functionality, these remain popular for smaller setups and individual workstations where consolidated control of a few computers is needed, offering a cost-effective solution for localized management.
Key drivers for regional and segment dominance include government initiatives promoting digital transformation, robust cybersecurity mandates, and the presence of key end-user industries like finance, healthcare, and manufacturing.
Multi-User KVM Switches Product Developments
Recent product developments in the Multi-User KVM Switches market are heavily focused on enhancing user experience and operational efficiency. Innovations include higher bandwidth support for 4K and 8K video resolutions, enabling seamless management of high-fidelity visual content. The integration of advanced cybersecurity features, such as end-to-end encryption and multi-factor authentication, is a significant trend, particularly for KVM Secure Switches. Furthermore, the market is witnessing the rise of software-defined KVM solutions and cloud-based management platforms, offering greater flexibility, scalability, and remote accessibility. These advancements provide competitive advantages by simplifying IT administration, reducing downtime, and enhancing overall operational resilience.
Key Drivers of Multi-User KVM Switches Growth
The Multi-User KVM Switches market is propelled by several significant growth drivers. The escalating complexity and scale of IT infrastructures across industries necessitate efficient and centralized control solutions. The increasing adoption of remote work and hybrid models has amplified the demand for KVM IP Switches that facilitate secure remote access. Furthermore, stringent government regulations and the growing emphasis on cybersecurity are driving the adoption of advanced KVM Secure Switches. Technological advancements, such as higher resolution video support and faster data transfer rates, are also crucial, catering to the evolving needs of sectors like media, broadcasting, and design.
Challenges in the Multi-User KVM Switches Market
Despite its strong growth potential, the Multi-User KVM Switches market faces several challenges. High initial investment costs can be a barrier for some Small and Medium Enterprises. The intricate nature of integration with existing IT infrastructures requires specialized expertise, potentially leading to implementation complexities. Fierce competition among numerous vendors, including established players and emerging ones, exerts downward pressure on pricing. Moreover, the rapid pace of technological evolution necessitates continuous R&D investment to stay competitive, posing a significant financial burden for some manufacturers. Supply chain disruptions, as experienced in recent years, can also impact product availability and lead times.
Emerging Opportunities in Multi-User KVM Switches
Emerging opportunities in the Multi-User KVM Switches market are substantial, fueled by several key catalysts. The burgeoning demand for edge computing solutions presents a significant avenue for growth, as these deployments often require localized, high-density KVM management. The increasing adoption of virtualization and software-defined networking (SDN) creates further opportunities for integrated KVM solutions. Strategic partnerships between KVM switch manufacturers and cloud service providers, as well as cybersecurity firms, can unlock new revenue streams and enhance product offerings. Market expansion into developing economies, where IT infrastructure is rapidly modernizing, represents another significant growth frontier.
Leading Players in the Multi-User KVM Switches Sector
- Belkin
- IOGEAR
- Vertiv
- Hewlett Packard Enterprise
- Fujitsu
- Schneider Electric
- Thinklogical
- Tripp Lite
- Legrand
- Lenovo
- Aten
Key Milestones in Multi-User KVM Switches Industry
- 2019: Introduction of 4K resolution support in mainstream KVM switches, expanding capabilities for professional applications.
- 2020: Increased focus on secure KVM solutions driven by heightened global cybersecurity concerns, leading to the launch of enhanced security features.
- 2021: Rise in demand for IP-based KVM solutions due to the acceleration of remote work trends, impacting product development priorities.
- 2022: Emergence of hybrid KVM solutions combining direct and IP access, offering greater flexibility for diverse IT environments.
- 2023: Significant advancements in software-defined KVM, enabling greater programmability and cloud integration.
- 2024: Growing adoption of KVM switches in emerging industries like AI and IoT for device management.
Strategic Outlook for Multi-User KVM Switches Market
The strategic outlook for the Multi-User KVM Switches market is highly positive, characterized by sustained growth and innovation. Key accelerators include the continued digital transformation initiatives across all enterprise sizes, driving demand for efficient IT management tools. The increasing integration of AI and IoT in industrial and enterprise settings will necessitate more sophisticated control and monitoring capabilities, directly benefiting KVM solutions. Furthermore, the ongoing evolution of cybersecurity threats will continue to fuel the market for advanced KVM Secure Switches. Companies focusing on seamless integration, enhanced remote access capabilities through KVM IP Switches, and delivering high-performance solutions for demanding applications are well-positioned for significant future market share gains.
Multi-User KVM Switches Segmentation
-
1. Application
- 1.1. Small and Medium Enterprises
- 1.2. Large Enterprises
-
2. Types
- 2.1. KVM Desktop Switch
- 2.2. KVM IP Switch
- 2.3. KVM Secure Switch
- 2.4. KVM High-Performance Switch
Multi-User KVM Switches Segmentation By Geography
-
1. North America
- 1.1. United States
- 1.2. Canada
- 1.3. Mexico
-
2. South America
- 2.1. Brazil
- 2.2. Argentina
- 2.3. Rest of South America
-
3. Europe
- 3.1. United Kingdom
- 3.2. Germany
- 3.3. France
- 3.4. Italy
- 3.5. Spain
- 3.6. Russia
- 3.7. Benelux
- 3.8. Nordics
- 3.9. Rest of Europe
-
4. Middle East & Africa
- 4.1. Turkey
- 4.2. Israel
- 4.3. GCC
- 4.4. North Africa
- 4.5. South Africa
- 4.6. Rest of Middle East & Africa
-
5. Asia Pacific
- 5.1. China
- 5.2. India
- 5.3. Japan
- 5.4. South Korea
- 5.5. ASEAN
- 5.6. Oceania
- 5.7. Rest of Asia Pacific
Multi-User KVM Switches REPORT HIGHLIGHTS
| Aspects | Details |
|---|---|
| Study Period | 2019-2033 |
| Base Year | 2024 |
| Estimated Year | 2025 |
| Forecast Period | 2025-2033 |
| Historical Period | 2019-2024 |
| Growth Rate | CAGR of XX% from 2019-2033 |
| Segmentation |
|
Table of Contents
- 1. Introduction
- 1.1. Research Scope
- 1.2. Market Segmentation
- 1.3. Research Methodology
- 1.4. Definitions and Assumptions
- 2. Executive Summary
- 2.1. Introduction
- 3. Market Dynamics
- 3.1. Introduction
- 3.2. Market Drivers
- 3.3. Market Restrains
- 3.4. Market Trends
- 4. Market Factor Analysis
- 4.1. Porters Five Forces
- 4.2. Supply/Value Chain
- 4.3. PESTEL analysis
- 4.4. Market Entropy
- 4.5. Patent/Trademark Analysis
- 5. Global Multi-User KVM Switches Analysis, Insights and Forecast, 2019-2031
- 5.1. Market Analysis, Insights and Forecast - by Application
- 5.1.1. Small and Medium Enterprises
- 5.1.2. Large Enterprises
- 5.2. Market Analysis, Insights and Forecast - by Types
- 5.2.1. KVM Desktop Switch
- 5.2.2. KVM IP Switch
- 5.2.3. KVM Secure Switch
- 5.2.4. KVM High-Performance Switch
- 5.3. Market Analysis, Insights and Forecast - by Region
- 5.3.1. North America
- 5.3.2. South America
- 5.3.3. Europe
- 5.3.4. Middle East & Africa
- 5.3.5. Asia Pacific
- 5.1. Market Analysis, Insights and Forecast - by Application
- 6. North America Multi-User KVM Switches Analysis, Insights and Forecast, 2019-2031
- 6.1. Market Analysis, Insights and Forecast - by Application
- 6.1.1. Small and Medium Enterprises
- 6.1.2. Large Enterprises
- 6.2. Market Analysis, Insights and Forecast - by Types
- 6.2.1. KVM Desktop Switch
- 6.2.2. KVM IP Switch
- 6.2.3. KVM Secure Switch
- 6.2.4. KVM High-Performance Switch
- 6.1. Market Analysis, Insights and Forecast - by Application
- 7. South America Multi-User KVM Switches Analysis, Insights and Forecast, 2019-2031
- 7.1. Market Analysis, Insights and Forecast - by Application
- 7.1.1. Small and Medium Enterprises
- 7.1.2. Large Enterprises
- 7.2. Market Analysis, Insights and Forecast - by Types
- 7.2.1. KVM Desktop Switch
- 7.2.2. KVM IP Switch
- 7.2.3. KVM Secure Switch
- 7.2.4. KVM High-Performance Switch
- 7.1. Market Analysis, Insights and Forecast - by Application
- 8. Europe Multi-User KVM Switches Analysis, Insights and Forecast, 2019-2031
- 8.1. Market Analysis, Insights and Forecast - by Application
- 8.1.1. Small and Medium Enterprises
- 8.1.2. Large Enterprises
- 8.2. Market Analysis, Insights and Forecast - by Types
- 8.2.1. KVM Desktop Switch
- 8.2.2. KVM IP Switch
- 8.2.3. KVM Secure Switch
- 8.2.4. KVM High-Performance Switch
- 8.1. Market Analysis, Insights and Forecast - by Application
- 9. Middle East & Africa Multi-User KVM Switches Analysis, Insights and Forecast, 2019-2031
- 9.1. Market Analysis, Insights and Forecast - by Application
- 9.1.1. Small and Medium Enterprises
- 9.1.2. Large Enterprises
- 9.2. Market Analysis, Insights and Forecast - by Types
- 9.2.1. KVM Desktop Switch
- 9.2.2. KVM IP Switch
- 9.2.3. KVM Secure Switch
- 9.2.4. KVM High-Performance Switch
- 9.1. Market Analysis, Insights and Forecast - by Application
- 10. Asia Pacific Multi-User KVM Switches Analysis, Insights and Forecast, 2019-2031
- 10.1. Market Analysis, Insights and Forecast - by Application
- 10.1.1. Small and Medium Enterprises
- 10.1.2. Large Enterprises
- 10.2. Market Analysis, Insights and Forecast - by Types
- 10.2.1. KVM Desktop Switch
- 10.2.2. KVM IP Switch
- 10.2.3. KVM Secure Switch
- 10.2.4. KVM High-Performance Switch
- 10.1. Market Analysis, Insights and Forecast - by Application
- 11. Competitive Analysis
- 11.1. Global Market Share Analysis 2024
- 11.2. Company Profiles
- 11.2.1 Belkin
- 11.2.1.1. Overview
- 11.2.1.2. Products
- 11.2.1.3. SWOT Analysis
- 11.2.1.4. Recent Developments
- 11.2.1.5. Financials (Based on Availability)
- 11.2.2 IOGEAR
- 11.2.2.1. Overview
- 11.2.2.2. Products
- 11.2.2.3. SWOT Analysis
- 11.2.2.4. Recent Developments
- 11.2.2.5. Financials (Based on Availability)
- 11.2.3 Vertiv
- 11.2.3.1. Overview
- 11.2.3.2. Products
- 11.2.3.3. SWOT Analysis
- 11.2.3.4. Recent Developments
- 11.2.3.5. Financials (Based on Availability)
- 11.2.4 Hewlett Packard Enterprise
- 11.2.4.1. Overview
- 11.2.4.2. Products
- 11.2.4.3. SWOT Analysis
- 11.2.4.4. Recent Developments
- 11.2.4.5. Financials (Based on Availability)
- 11.2.5 Fujitsu
- 11.2.5.1. Overview
- 11.2.5.2. Products
- 11.2.5.3. SWOT Analysis
- 11.2.5.4. Recent Developments
- 11.2.5.5. Financials (Based on Availability)
- 11.2.6 Schneider Electric
- 11.2.6.1. Overview
- 11.2.6.2. Products
- 11.2.6.3. SWOT Analysis
- 11.2.6.4. Recent Developments
- 11.2.6.5. Financials (Based on Availability)
- 11.2.7 Thinklogical
- 11.2.7.1. Overview
- 11.2.7.2. Products
- 11.2.7.3. SWOT Analysis
- 11.2.7.4. Recent Developments
- 11.2.7.5. Financials (Based on Availability)
- 11.2.8 Tripp Lite
- 11.2.8.1. Overview
- 11.2.8.2. Products
- 11.2.8.3. SWOT Analysis
- 11.2.8.4. Recent Developments
- 11.2.8.5. Financials (Based on Availability)
- 11.2.9 Legrand
- 11.2.9.1. Overview
- 11.2.9.2. Products
- 11.2.9.3. SWOT Analysis
- 11.2.9.4. Recent Developments
- 11.2.9.5. Financials (Based on Availability)
- 11.2.10 Lenovo
- 11.2.10.1. Overview
- 11.2.10.2. Products
- 11.2.10.3. SWOT Analysis
- 11.2.10.4. Recent Developments
- 11.2.10.5. Financials (Based on Availability)
- 11.2.11 Aten
- 11.2.11.1. Overview
- 11.2.11.2. Products
- 11.2.11.3. SWOT Analysis
- 11.2.11.4. Recent Developments
- 11.2.11.5. Financials (Based on Availability)
- 11.2.1 Belkin
List of Figures
- Figure 1: Global Multi-User KVM Switches Revenue Breakdown (million, %) by Region 2024 & 2032
- Figure 2: Global Multi-User KVM Switches Volume Breakdown (K, %) by Region 2024 & 2032
- Figure 3: North America Multi-User KVM Switches Revenue (million), by Application 2024 & 2032
- Figure 4: North America Multi-User KVM Switches Volume (K), by Application 2024 & 2032
- Figure 5: North America Multi-User KVM Switches Revenue Share (%), by Application 2024 & 2032
- Figure 6: North America Multi-User KVM Switches Volume Share (%), by Application 2024 & 2032
- Figure 7: North America Multi-User KVM Switches Revenue (million), by Types 2024 & 2032
- Figure 8: North America Multi-User KVM Switches Volume (K), by Types 2024 & 2032
- Figure 9: North America Multi-User KVM Switches Revenue Share (%), by Types 2024 & 2032
- Figure 10: North America Multi-User KVM Switches Volume Share (%), by Types 2024 & 2032
- Figure 11: North America Multi-User KVM Switches Revenue (million), by Country 2024 & 2032
- Figure 12: North America Multi-User KVM Switches Volume (K), by Country 2024 & 2032
- Figure 13: North America Multi-User KVM Switches Revenue Share (%), by Country 2024 & 2032
- Figure 14: North America Multi-User KVM Switches Volume Share (%), by Country 2024 & 2032
- Figure 15: South America Multi-User KVM Switches Revenue (million), by Application 2024 & 2032
- Figure 16: South America Multi-User KVM Switches Volume (K), by Application 2024 & 2032
- Figure 17: South America Multi-User KVM Switches Revenue Share (%), by Application 2024 & 2032
- Figure 18: South America Multi-User KVM Switches Volume Share (%), by Application 2024 & 2032
- Figure 19: South America Multi-User KVM Switches Revenue (million), by Types 2024 & 2032
- Figure 20: South America Multi-User KVM Switches Volume (K), by Types 2024 & 2032
- Figure 21: South America Multi-User KVM Switches Revenue Share (%), by Types 2024 & 2032
- Figure 22: South America Multi-User KVM Switches Volume Share (%), by Types 2024 & 2032
- Figure 23: South America Multi-User KVM Switches Revenue (million), by Country 2024 & 2032
- Figure 24: South America Multi-User KVM Switches Volume (K), by Country 2024 & 2032
- Figure 25: South America Multi-User KVM Switches Revenue Share (%), by Country 2024 & 2032
- Figure 26: South America Multi-User KVM Switches Volume Share (%), by Country 2024 & 2032
- Figure 27: Europe Multi-User KVM Switches Revenue (million), by Application 2024 & 2032
- Figure 28: Europe Multi-User KVM Switches Volume (K), by Application 2024 & 2032
- Figure 29: Europe Multi-User KVM Switches Revenue Share (%), by Application 2024 & 2032
- Figure 30: Europe Multi-User KVM Switches Volume Share (%), by Application 2024 & 2032
- Figure 31: Europe Multi-User KVM Switches Revenue (million), by Types 2024 & 2032
- Figure 32: Europe Multi-User KVM Switches Volume (K), by Types 2024 & 2032
- Figure 33: Europe Multi-User KVM Switches Revenue Share (%), by Types 2024 & 2032
- Figure 34: Europe Multi-User KVM Switches Volume Share (%), by Types 2024 & 2032
- Figure 35: Europe Multi-User KVM Switches Revenue (million), by Country 2024 & 2032
- Figure 36: Europe Multi-User KVM Switches Volume (K), by Country 2024 & 2032
- Figure 37: Europe Multi-User KVM Switches Revenue Share (%), by Country 2024 & 2032
- Figure 38: Europe Multi-User KVM Switches Volume Share (%), by Country 2024 & 2032
- Figure 39: Middle East & Africa Multi-User KVM Switches Revenue (million), by Application 2024 & 2032
- Figure 40: Middle East & Africa Multi-User KVM Switches Volume (K), by Application 2024 & 2032
- Figure 41: Middle East & Africa Multi-User KVM Switches Revenue Share (%), by Application 2024 & 2032
- Figure 42: Middle East & Africa Multi-User KVM Switches Volume Share (%), by Application 2024 & 2032
- Figure 43: Middle East & Africa Multi-User KVM Switches Revenue (million), by Types 2024 & 2032
- Figure 44: Middle East & Africa Multi-User KVM Switches Volume (K), by Types 2024 & 2032
- Figure 45: Middle East & Africa Multi-User KVM Switches Revenue Share (%), by Types 2024 & 2032
- Figure 46: Middle East & Africa Multi-User KVM Switches Volume Share (%), by Types 2024 & 2032
- Figure 47: Middle East & Africa Multi-User KVM Switches Revenue (million), by Country 2024 & 2032
- Figure 48: Middle East & Africa Multi-User KVM Switches Volume (K), by Country 2024 & 2032
- Figure 49: Middle East & Africa Multi-User KVM Switches Revenue Share (%), by Country 2024 & 2032
- Figure 50: Middle East & Africa Multi-User KVM Switches Volume Share (%), by Country 2024 & 2032
- Figure 51: Asia Pacific Multi-User KVM Switches Revenue (million), by Application 2024 & 2032
- Figure 52: Asia Pacific Multi-User KVM Switches Volume (K), by Application 2024 & 2032
- Figure 53: Asia Pacific Multi-User KVM Switches Revenue Share (%), by Application 2024 & 2032
- Figure 54: Asia Pacific Multi-User KVM Switches Volume Share (%), by Application 2024 & 2032
- Figure 55: Asia Pacific Multi-User KVM Switches Revenue (million), by Types 2024 & 2032
- Figure 56: Asia Pacific Multi-User KVM Switches Volume (K), by Types 2024 & 2032
- Figure 57: Asia Pacific Multi-User KVM Switches Revenue Share (%), by Types 2024 & 2032
- Figure 58: Asia Pacific Multi-User KVM Switches Volume Share (%), by Types 2024 & 2032
- Figure 59: Asia Pacific Multi-User KVM Switches Revenue (million), by Country 2024 & 2032
- Figure 60: Asia Pacific Multi-User KVM Switches Volume (K), by Country 2024 & 2032
- Figure 61: Asia Pacific Multi-User KVM Switches Revenue Share (%), by Country 2024 & 2032
- Figure 62: Asia Pacific Multi-User KVM Switches Volume Share (%), by Country 2024 & 2032
List of Tables
- Table 1: Global Multi-User KVM Switches Revenue million Forecast, by Region 2019 & 2032
- Table 2: Global Multi-User KVM Switches Volume K Forecast, by Region 2019 & 2032
- Table 3: Global Multi-User KVM Switches Revenue million Forecast, by Application 2019 & 2032
- Table 4: Global Multi-User KVM Switches Volume K Forecast, by Application 2019 & 2032
- Table 5: Global Multi-User KVM Switches Revenue million Forecast, by Types 2019 & 2032
- Table 6: Global Multi-User KVM Switches Volume K Forecast, by Types 2019 & 2032
- Table 7: Global Multi-User KVM Switches Revenue million Forecast, by Region 2019 & 2032
- Table 8: Global Multi-User KVM Switches Volume K Forecast, by Region 2019 & 2032
- Table 9: Global Multi-User KVM Switches Revenue million Forecast, by Application 2019 & 2032
- Table 10: Global Multi-User KVM Switches Volume K Forecast, by Application 2019 & 2032
- Table 11: Global Multi-User KVM Switches Revenue million Forecast, by Types 2019 & 2032
- Table 12: Global Multi-User KVM Switches Volume K Forecast, by Types 2019 & 2032
- Table 13: Global Multi-User KVM Switches Revenue million Forecast, by Country 2019 & 2032
- Table 14: Global Multi-User KVM Switches Volume K Forecast, by Country 2019 & 2032
- Table 15: United States Multi-User KVM Switches Revenue (million) Forecast, by Application 2019 & 2032
- Table 16: United States Multi-User KVM Switches Volume (K) Forecast, by Application 2019 & 2032
- Table 17: Canada Multi-User KVM Switches Revenue (million) Forecast, by Application 2019 & 2032
- Table 18: Canada Multi-User KVM Switches Volume (K) Forecast, by Application 2019 & 2032
- Table 19: Mexico Multi-User KVM Switches Revenue (million) Forecast, by Application 2019 & 2032
- Table 20: Mexico Multi-User KVM Switches Volume (K) Forecast, by Application 2019 & 2032
- Table 21: Global Multi-User KVM Switches Revenue million Forecast, by Application 2019 & 2032
- Table 22: Global Multi-User KVM Switches Volume K Forecast, by Application 2019 & 2032
- Table 23: Global Multi-User KVM Switches Revenue million Forecast, by Types 2019 & 2032
- Table 24: Global Multi-User KVM Switches Volume K Forecast, by Types 2019 & 2032
- Table 25: Global Multi-User KVM Switches Revenue million Forecast, by Country 2019 & 2032
- Table 26: Global Multi-User KVM Switches Volume K Forecast, by Country 2019 & 2032
- Table 27: Brazil Multi-User KVM Switches Revenue (million) Forecast, by Application 2019 & 2032
- Table 28: Brazil Multi-User KVM Switches Volume (K) Forecast, by Application 2019 & 2032
- Table 29: Argentina Multi-User KVM Switches Revenue (million) Forecast, by Application 2019 & 2032
- Table 30: Argentina Multi-User KVM Switches Volume (K) Forecast, by Application 2019 & 2032
- Table 31: Rest of South America Multi-User KVM Switches Revenue (million) Forecast, by Application 2019 & 2032
- Table 32: Rest of South America Multi-User KVM Switches Volume (K) Forecast, by Application 2019 & 2032
- Table 33: Global Multi-User KVM Switches Revenue million Forecast, by Application 2019 & 2032
- Table 34: Global Multi-User KVM Switches Volume K Forecast, by Application 2019 & 2032
- Table 35: Global Multi-User KVM Switches Revenue million Forecast, by Types 2019 & 2032
- Table 36: Global Multi-User KVM Switches Volume K Forecast, by Types 2019 & 2032
- Table 37: Global Multi-User KVM Switches Revenue million Forecast, by Country 2019 & 2032
- Table 38: Global Multi-User KVM Switches Volume K Forecast, by Country 2019 & 2032
- Table 39: United Kingdom Multi-User KVM Switches Revenue (million) Forecast, by Application 2019 & 2032
- Table 40: United Kingdom Multi-User KVM Switches Volume (K) Forecast, by Application 2019 & 2032
- Table 41: Germany Multi-User KVM Switches Revenue (million) Forecast, by Application 2019 & 2032
- Table 42: Germany Multi-User KVM Switches Volume (K) Forecast, by Application 2019 & 2032
- Table 43: France Multi-User KVM Switches Revenue (million) Forecast, by Application 2019 & 2032
- Table 44: France Multi-User KVM Switches Volume (K) Forecast, by Application 2019 & 2032
- Table 45: Italy Multi-User KVM Switches Revenue (million) Forecast, by Application 2019 & 2032
- Table 46: Italy Multi-User KVM Switches Volume (K) Forecast, by Application 2019 & 2032
- Table 47: Spain Multi-User KVM Switches Revenue (million) Forecast, by Application 2019 & 2032
- Table 48: Spain Multi-User KVM Switches Volume (K) Forecast, by Application 2019 & 2032
- Table 49: Russia Multi-User KVM Switches Revenue (million) Forecast, by Application 2019 & 2032
- Table 50: Russia Multi-User KVM Switches Volume (K) Forecast, by Application 2019 & 2032
- Table 51: Benelux Multi-User KVM Switches Revenue (million) Forecast, by Application 2019 & 2032
- Table 52: Benelux Multi-User KVM Switches Volume (K) Forecast, by Application 2019 & 2032
- Table 53: Nordics Multi-User KVM Switches Revenue (million) Forecast, by Application 2019 & 2032
- Table 54: Nordics Multi-User KVM Switches Volume (K) Forecast, by Application 2019 & 2032
- Table 55: Rest of Europe Multi-User KVM Switches Revenue (million) Forecast, by Application 2019 & 2032
- Table 56: Rest of Europe Multi-User KVM Switches Volume (K) Forecast, by Application 2019 & 2032
- Table 57: Global Multi-User KVM Switches Revenue million Forecast, by Application 2019 & 2032
- Table 58: Global Multi-User KVM Switches Volume K Forecast, by Application 2019 & 2032
- Table 59: Global Multi-User KVM Switches Revenue million Forecast, by Types 2019 & 2032
- Table 60: Global Multi-User KVM Switches Volume K Forecast, by Types 2019 & 2032
- Table 61: Global Multi-User KVM Switches Revenue million Forecast, by Country 2019 & 2032
- Table 62: Global Multi-User KVM Switches Volume K Forecast, by Country 2019 & 2032
- Table 63: Turkey Multi-User KVM Switches Revenue (million) Forecast, by Application 2019 & 2032
- Table 64: Turkey Multi-User KVM Switches Volume (K) Forecast, by Application 2019 & 2032
- Table 65: Israel Multi-User KVM Switches Revenue (million) Forecast, by Application 2019 & 2032
- Table 66: Israel Multi-User KVM Switches Volume (K) Forecast, by Application 2019 & 2032
- Table 67: GCC Multi-User KVM Switches Revenue (million) Forecast, by Application 2019 & 2032
- Table 68: GCC Multi-User KVM Switches Volume (K) Forecast, by Application 2019 & 2032
- Table 69: North Africa Multi-User KVM Switches Revenue (million) Forecast, by Application 2019 & 2032
- Table 70: North Africa Multi-User KVM Switches Volume (K) Forecast, by Application 2019 & 2032
- Table 71: South Africa Multi-User KVM Switches Revenue (million) Forecast, by Application 2019 & 2032
- Table 72: South Africa Multi-User KVM Switches Volume (K) Forecast, by Application 2019 & 2032
- Table 73: Rest of Middle East & Africa Multi-User KVM Switches Revenue (million) Forecast, by Application 2019 & 2032
- Table 74: Rest of Middle East & Africa Multi-User KVM Switches Volume (K) Forecast, by Application 2019 & 2032
- Table 75: Global Multi-User KVM Switches Revenue million Forecast, by Application 2019 & 2032
- Table 76: Global Multi-User KVM Switches Volume K Forecast, by Application 2019 & 2032
- Table 77: Global Multi-User KVM Switches Revenue million Forecast, by Types 2019 & 2032
- Table 78: Global Multi-User KVM Switches Volume K Forecast, by Types 2019 & 2032
- Table 79: Global Multi-User KVM Switches Revenue million Forecast, by Country 2019 & 2032
- Table 80: Global Multi-User KVM Switches Volume K Forecast, by Country 2019 & 2032
- Table 81: China Multi-User KVM Switches Revenue (million) Forecast, by Application 2019 & 2032
- Table 82: China Multi-User KVM Switches Volume (K) Forecast, by Application 2019 & 2032
- Table 83: India Multi-User KVM Switches Revenue (million) Forecast, by Application 2019 & 2032
- Table 84: India Multi-User KVM Switches Volume (K) Forecast, by Application 2019 & 2032
- Table 85: Japan Multi-User KVM Switches Revenue (million) Forecast, by Application 2019 & 2032
- Table 86: Japan Multi-User KVM Switches Volume (K) Forecast, by Application 2019 & 2032
- Table 87: South Korea Multi-User KVM Switches Revenue (million) Forecast, by Application 2019 & 2032
- Table 88: South Korea Multi-User KVM Switches Volume (K) Forecast, by Application 2019 & 2032
- Table 89: ASEAN Multi-User KVM Switches Revenue (million) Forecast, by Application 2019 & 2032
- Table 90: ASEAN Multi-User KVM Switches Volume (K) Forecast, by Application 2019 & 2032
- Table 91: Oceania Multi-User KVM Switches Revenue (million) Forecast, by Application 2019 & 2032
- Table 92: Oceania Multi-User KVM Switches Volume (K) Forecast, by Application 2019 & 2032
- Table 93: Rest of Asia Pacific Multi-User KVM Switches Revenue (million) Forecast, by Application 2019 & 2032
- Table 94: Rest of Asia Pacific Multi-User KVM Switches Volume (K) Forecast, by Application 2019 & 2032
Frequently Asked Questions
1. What is the projected Compound Annual Growth Rate (CAGR) of the Multi-User KVM Switches?
The projected CAGR is approximately XX%.
2. Which companies are prominent players in the Multi-User KVM Switches?
Key companies in the market include Belkin, IOGEAR, Vertiv, Hewlett Packard Enterprise, Fujitsu, Schneider Electric, Thinklogical, Tripp Lite, Legrand, Lenovo, Aten.
3. What are the main segments of the Multi-User KVM Switches?
The market segments include Application, Types.
4. Can you provide details about the market size?
The market size is estimated to be USD XXX million as of 2022.
5. What are some drivers contributing to market growth?
N/A
6. What are the notable trends driving market growth?
N/A
7. Are there any restraints impacting market growth?
N/A
8. Can you provide examples of recent developments in the market?
N/A
9. What pricing options are available for accessing the report?
Pricing options include single-user, multi-user, and enterprise licenses priced at USD 3350.00, USD 5025.00, and USD 6700.00 respectively.
10. Is the market size provided in terms of value or volume?
The market size is provided in terms of value, measured in million and volume, measured in K.
11. Are there any specific market keywords associated with the report?
Yes, the market keyword associated with the report is "Multi-User KVM Switches," which aids in identifying and referencing the specific market segment covered.
12. How do I determine which pricing option suits my needs best?
The pricing options vary based on user requirements and access needs. Individual users may opt for single-user licenses, while businesses requiring broader access may choose multi-user or enterprise licenses for cost-effective access to the report.
13. Are there any additional resources or data provided in the Multi-User KVM Switches report?
While the report offers comprehensive insights, it's advisable to review the specific contents or supplementary materials provided to ascertain if additional resources or data are available.
14. How can I stay updated on further developments or reports in the Multi-User KVM Switches?
To stay informed about further developments, trends, and reports in the Multi-User KVM Switches, consider subscribing to industry newsletters, following relevant companies and organizations, or regularly checking reputable industry news sources and publications.
Methodology
Step 1 - Identification of Relevant Samples Size from Population Database


Step 2 - Approaches for Defining Global Market Size (Value, Volume* & Price*)

Note*: In applicable scenarios
Step 3 - Data Sources
Primary Research
- Web Analytics
- Survey Reports
- Research Institute
- Latest Research Reports
- Opinion Leaders
Secondary Research
- Annual Reports
- White Paper
- Latest Press Release
- Industry Association
- Paid Database
- Investor Presentations

Step 4 - Data Triangulation
Involves using different sources of information in order to increase the validity of a study
These sources are likely to be stakeholders in a program - participants, other researchers, program staff, other community members, and so on.
Then we put all data in single framework & apply various statistical tools to find out the dynamic on the market.
During the analysis stage, feedback from the stakeholder groups would be compared to determine areas of agreement as well as areas of divergence
