

Key Insights
The Molten Salt Thermal Energy Storage (MSTES) market is experiencing robust growth, driven by the increasing demand for reliable and efficient energy storage solutions to support renewable energy integration. The market's Compound Annual Growth Rate (CAGR) of 9.8% signifies a consistent upward trajectory, projected to continue through 2033. Key drivers include the global push for decarbonization, the intermittent nature of solar and wind power necessitating effective energy storage, and advancements in MSTES technologies, particularly in parabolic troughs, Fresnel reflectors, and power tower systems. These technologies offer high-temperature storage capabilities, enabling extended operational hours for concentrated solar power (CSP) plants and enhancing grid stability. While high initial capital costs and potential material challenges represent restraints, ongoing technological innovations and supportive government policies are mitigating these factors. Geographic distribution reveals strong market presence in North America (particularly the United States), Europe (Germany and Spain leading), and the Asia-Pacific region (China and India showing significant growth potential). Leading companies like SCHOTT AG, SolarReserve LLC, and Engie SA are actively shaping the market landscape through technological advancements and project deployments. The market segmentation by technology highlights the competitive landscape and ongoing innovation within each specific approach to MSTES.
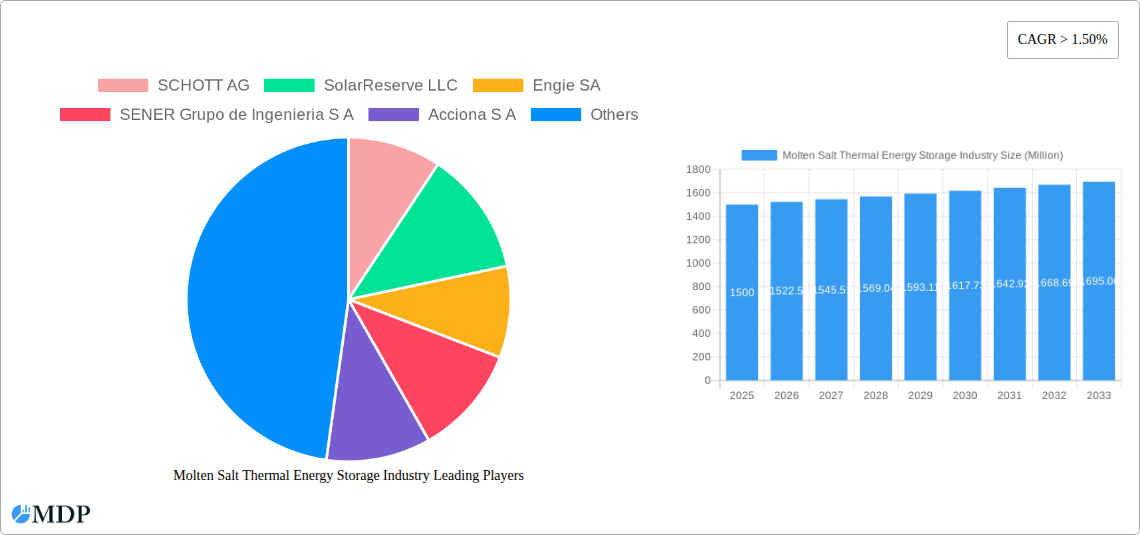
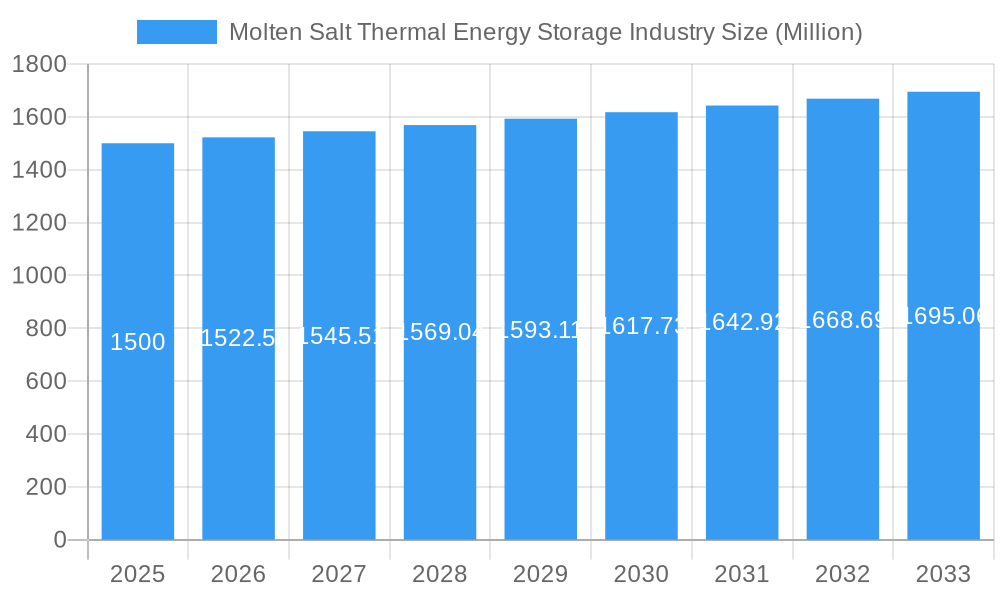
Molten Salt Thermal Energy Storage Industry Market Size (In Billion)
The forecast period (2025-2033) anticipates substantial market expansion, fueled by increasing investments in renewable energy infrastructure globally. The diverse range of applications for MSTES, encompassing not only CSP but also industrial process heat and grid-scale energy storage, is further contributing to its growth trajectory. The market size is projected to reach 2.22 billion by 2025. While regional variations exist, the overall market is poised for significant expansion, driven by a confluence of factors including favorable government regulations, declining costs of renewable energy, and growing awareness of the critical role of energy storage in achieving a sustainable energy future. The established players mentioned above, alongside emerging innovative companies, are expected to drive competition and technological advancement within this dynamic sector. Continued research and development, coupled with strategic partnerships and collaborations, will be instrumental in unlocking the full potential of MSTES in a rapidly evolving energy landscape.
Molten Salt Thermal Energy Storage Industry Company Market Share
Molten Salt Thermal Energy Storage Industry: A Comprehensive Market Report (2019-2033)
This comprehensive report provides an in-depth analysis of the Molten Salt Thermal Energy Storage (MSTS) industry, offering invaluable insights for stakeholders, investors, and industry professionals. With a study period spanning 2019-2033, a base year of 2025, and a forecast period of 2025-2033, this report delivers crucial data for informed decision-making. The report examines market dynamics, leading players, technological advancements, and future growth prospects, presenting a complete picture of this rapidly evolving sector. Expect detailed analysis across key segments, including Parabolic Troughs, Fresnel Reflector, and Power Tower technologies. The market is expected to reach xx Million by 2033, exhibiting a CAGR of xx% during the forecast period.
Molten Salt Thermal Energy Storage Industry Market Dynamics & Concentration
The Molten Salt Thermal Energy Storage (MSTS) industry is experiencing significant growth, driven by increasing demand for renewable energy storage solutions and government incentives for clean energy technologies. Market concentration is currently moderate, with several key players holding substantial market share, although a fragmented landscape exists amongst smaller specialized companies. The top five companies – SCHOTT AG, SolarReserve LLC, Engie SA, SENER Grupo de Ingenieria S A, and Acciona S A – collectively hold an estimated xx% market share as of 2025. Innovation drivers include advancements in materials science, improved thermal efficiency, and the development of more cost-effective storage systems. Stringent environmental regulations globally are pushing the adoption of cleaner energy sources, further boosting demand for MSTS. Product substitutes, such as pumped hydro storage, face challenges in terms of geographical limitations and environmental impact, offering a competitive edge to MSTS. End-user trends reflect a strong preference for reliable, long-duration energy storage, aligning perfectly with the capabilities of MSTS. The historical period (2019-2024) witnessed xx M&A deals, while the forecast period (2025-2033) is projected to see a significant increase, driven by strategic expansions and technological consolidation.
Molten Salt Thermal Energy Storage Industry Industry Trends & Analysis
The MSTS industry is characterized by robust growth, driven by several key factors. The increasing penetration of renewable energy sources, like solar and wind power, necessitates effective energy storage solutions to address intermittency issues. This is creating significant demand for MSTS systems, driving market expansion. Technological advancements, such as the development of advanced materials and improved thermal management systems, are enhancing the efficiency and reducing the cost of MSTS, making it a more competitive option. Consumer preferences are shifting toward sustainable and environmentally friendly energy solutions, aligning perfectly with the clean energy profile of MSTS. The competitive landscape is dynamic, with companies investing heavily in R&D to improve their offerings and gain a competitive edge. This includes strategic partnerships, focusing on technology integrations and market expansions. The market is expected to witness a Compound Annual Growth Rate (CAGR) of xx% from 2025 to 2033, with market penetration expected to reach xx% by 2033.
Leading Markets & Segments in Molten Salt Thermal Energy Storage Industry
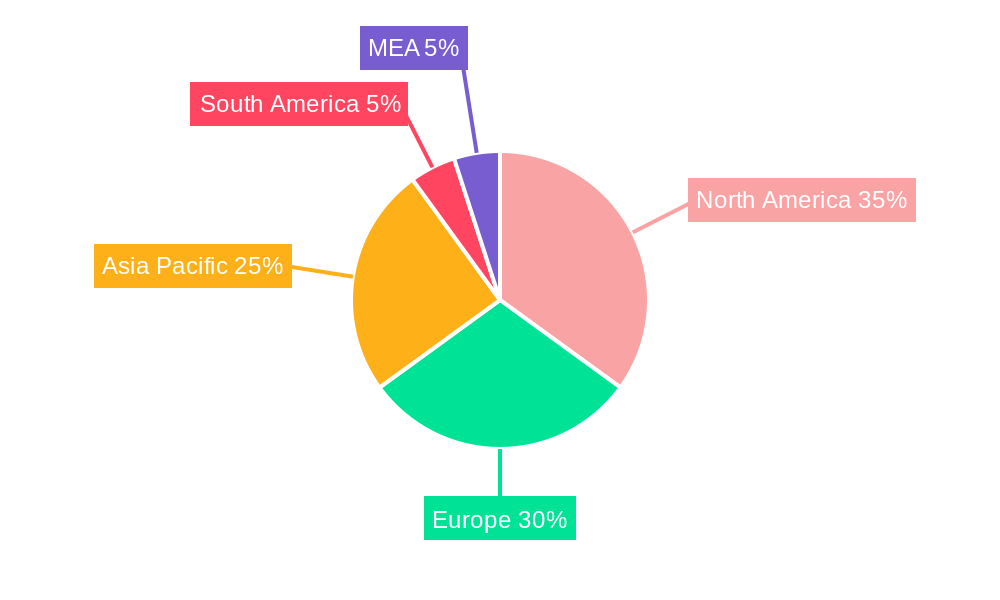
The MSTS market exhibits strong regional variations. Currently, North America and Europe are leading the way in terms of adoption and market size. However, the Asia-Pacific region is showing immense potential for future growth, fueled by massive investments in renewable energy infrastructure and supportive government policies.
Key Drivers for Dominant Regions:
- North America: Strong government support for renewable energy, coupled with a robust grid infrastructure, fuels market growth.
- Europe: Stringent environmental regulations and a commitment to carbon reduction goals are driving adoption.
- Asia-Pacific: Rapid economic growth and large-scale renewable energy projects are creating significant opportunities.
Segment Analysis:
- Parabolic Troughs: This technology holds a significant market share currently due to its maturity and relatively lower cost compared to other technologies. However, its land-intensive nature presents a limitation.
- Fresnel Reflector: This segment is showing steady growth, attracting interest due to its potential for higher efficiency and scalability.
- Power Tower: While this technology offers the highest potential for efficiency, high capital costs are hindering its widespread adoption. However, continuous technology advancements are gradually addressing this constraint.
Molten Salt Thermal Energy Storage Industry Product Developments
Recent product innovations in the MSTS industry focus on enhancing storage capacity, improving thermal efficiency, and reducing costs. Advancements in material science, including the development of new molten salt compositions and improved heat transfer fluids, are enhancing system performance. The integration of advanced control systems and intelligent algorithms is optimizing energy storage and retrieval processes. These innovations are expanding the applications of MSTS to include industrial process heat, district heating, and grid-scale energy storage. The improved efficiency and reduced costs make MSTS a increasingly attractive solution compared to other thermal storage options.
Key Drivers of Molten Salt Thermal Energy Storage Industry Growth
Several factors are fueling the growth of the MSTS industry. Firstly, the increasing deployment of intermittent renewable energy sources, such as solar and wind, necessitates reliable energy storage solutions. Secondly, government incentives and policies aimed at promoting clean energy adoption are boosting investments in MSTS technologies. Thirdly, technological advancements are continuously improving the efficiency, durability, and cost-effectiveness of MSTS systems, further driving market growth. Examples include improved molten salt formulations and better heat transfer designs.
Challenges in the Molten Salt Thermal Energy Storage Industry Market
Despite the growth potential, the MSTS industry faces several challenges. High initial capital costs remain a significant barrier to entry for many potential adopters. The availability of specialized materials and components can pose supply chain issues. Furthermore, the complex integration of MSTS systems into existing grids and infrastructure may require substantial investment and technical expertise. These factors can influence market penetration and adoption rates. Regulatory frameworks in several regions still require further clarity and harmonization to fully facilitate MSTS deployment.
Emerging Opportunities in Molten Salt Thermal Energy Storage Industry
The MSTS industry presents promising long-term growth opportunities. Technological breakthroughs, such as the development of advanced materials with improved thermal properties, are expected to enhance system efficiency and reduce costs. Strategic partnerships between energy companies, technology providers, and research institutions are crucial in advancing MSTS technology and expanding its market reach. The expansion of MSTS applications to new sectors, including industrial process heat and district heating, is creating further market expansion.
Leading Players in the Molten Salt Thermal Energy Storage Industry Sector
- SCHOTT AG
- SolarReserve LLC
- Engie SA
- SENER Grupo de Ingenieria S A
- Acciona S A
- Abengoa SA
- Yara International ASA
- BrightSource Energy Inc
Key Milestones in Molten Salt Thermal Energy Storage Industry Industry
- November 2022: Hyme Energy ApS partners with Bornholms Energi & Forsyning (BEOF) to build a 1 MW/20 MWh molten salt thermal energy storage demonstrator on Bornholm, Denmark. Completion is scheduled for 2024. This project showcases the growing interest in smaller-scale MSTS deployments and their application in providing multiple services (heat, power, ancillary services) within a local network. It represents a significant step towards proving the technology's versatility and potential for wider adoption.
Strategic Outlook for Molten Salt Thermal Energy Storage Industry Market
The future of the MSTS market looks bright, driven by increasing demand for renewable energy storage and continuous technological advancements. Strategic partnerships, focused R&D, and government support are paving the way for wider adoption and expansion into new markets. The cost reduction and increased efficiency expected from ongoing innovations will be key accelerators for growth. The development of standardized systems and simplified integration processes will help lower barriers to entry, encouraging greater participation and further strengthening the industry.
Molten Salt Thermal Energy Storage Industry Segmentation
-
1. Technology
- 1.1. Parabolic Troughs
- 1.2. Fresnel Reflector
- 1.3. Power Tower
Molten Salt Thermal Energy Storage Industry Segmentation By Geography
- 1. North America
- 2. Asia Pacific
- 3. Europe
- 4. South America
- 5. Middle East and Africa
Molten Salt Thermal Energy Storage Industry Regional Market Share
Geographic Coverage of Molten Salt Thermal Energy Storage Industry
Molten Salt Thermal Energy Storage Industry REPORT HIGHLIGHTS
| Aspects | Details |
|---|---|
| Study Period | 2020-2034 |
| Base Year | 2025 |
| Estimated Year | 2026 |
| Forecast Period | 2026-2034 |
| Historical Period | 2020-2025 |
| Growth Rate | CAGR of 9.8% from 2020-2034 |
| Segmentation |
|
Table of Contents
- 1. Introduction
- 1.1. Research Scope
- 1.2. Market Segmentation
- 1.3. Research Objective
- 1.4. Definitions and Assumptions
- 2. Executive Summary
- 2.1. Market Snapshot
- 3. Market Dynamics
- 3.1. Market Drivers
- 3.2. Market Restrains
- 3.3. Market Trends
- 3.4. Market Opportunities
- 4. Market Factor Analysis
- 4.1. Porters Five Forces
- 4.1.1. Bargaining Power of Suppliers
- 4.1.2. Bargaining Power of Buyers
- 4.1.3. Threat of New Entrants
- 4.1.4. Threat of Substitutes
- 4.1.5. Competitive Rivalry
- 4.2. PESTEL analysis
- 4.3. BCG Analysis
- 4.3.1. Stars (High Growth, High Market Share)
- 4.3.2. Cash Cows (Low Growth, High Market Share)
- 4.3.3. Question Mark (High Growth, Low Market Share)
- 4.3.4. Dogs (Low Growth, Low Market Share)
- 4.4. Ansoff Matrix Analysis
- 4.5. Supply Chain Analysis
- 4.6. Regulatory Landscape
- 4.7. Current Market Potential and Opportunity Assessment (TAM–SAM–SOM Framework)
- 4.8. MDP Analyst Note
- 4.1. Porters Five Forces
- 5. Market Analysis, Insights and Forecast 2021-2033
- 5.1. Market Analysis, Insights and Forecast - by Technology
- 5.1.1. Parabolic Troughs
- 5.1.2. Fresnel Reflector
- 5.1.3. Power Tower
- 5.2. Market Analysis, Insights and Forecast - by Region
- 5.2.1. North America
- 5.2.2. Asia Pacific
- 5.2.3. Europe
- 5.2.4. South America
- 5.2.5. Middle East and Africa
- 5.1. Market Analysis, Insights and Forecast - by Technology
- 6. Global Molten Salt Thermal Energy Storage Industry Analysis, Insights and Forecast, 2021-2033
- 6.1. Market Analysis, Insights and Forecast - by Technology
- 6.1.1. Parabolic Troughs
- 6.1.2. Fresnel Reflector
- 6.1.3. Power Tower
- 6.1. Market Analysis, Insights and Forecast - by Technology
- 7. North America Molten Salt Thermal Energy Storage Industry Analysis, Insights and Forecast, 2020-2032
- 7.1. Market Analysis, Insights and Forecast - by Technology
- 7.1.1. Parabolic Troughs
- 7.1.2. Fresnel Reflector
- 7.1.3. Power Tower
- 7.1. Market Analysis, Insights and Forecast - by Technology
- 8. Asia Pacific Molten Salt Thermal Energy Storage Industry Analysis, Insights and Forecast, 2020-2032
- 8.1. Market Analysis, Insights and Forecast - by Technology
- 8.1.1. Parabolic Troughs
- 8.1.2. Fresnel Reflector
- 8.1.3. Power Tower
- 8.1. Market Analysis, Insights and Forecast - by Technology
- 9. Europe Molten Salt Thermal Energy Storage Industry Analysis, Insights and Forecast, 2020-2032
- 9.1. Market Analysis, Insights and Forecast - by Technology
- 9.1.1. Parabolic Troughs
- 9.1.2. Fresnel Reflector
- 9.1.3. Power Tower
- 9.1. Market Analysis, Insights and Forecast - by Technology
- 10. South America Molten Salt Thermal Energy Storage Industry Analysis, Insights and Forecast, 2020-2032
- 10.1. Market Analysis, Insights and Forecast - by Technology
- 10.1.1. Parabolic Troughs
- 10.1.2. Fresnel Reflector
- 10.1.3. Power Tower
- 10.1. Market Analysis, Insights and Forecast - by Technology
- 11. Middle East and Africa Molten Salt Thermal Energy Storage Industry Analysis, Insights and Forecast, 2020-2032
- 11.1. Market Analysis, Insights and Forecast - by Technology
- 11.1.1. Parabolic Troughs
- 11.1.2. Fresnel Reflector
- 11.1.3. Power Tower
- 11.1. Market Analysis, Insights and Forecast - by Technology
- 12. Competitive Analysis
- 12.1. Company Profiles
- 12.1.1 SCHOTT AG
- 12.1.1.1. Company Overview
- 12.1.1.2. Products
- 12.1.1.3. Company Financials
- 12.1.1.4. SWOT Analysis
- 12.1.2 SolarReserve LLC
- 12.1.2.1. Company Overview
- 12.1.2.2. Products
- 12.1.2.3. Company Financials
- 12.1.2.4. SWOT Analysis
- 12.1.3 Engie SA
- 12.1.3.1. Company Overview
- 12.1.3.2. Products
- 12.1.3.3. Company Financials
- 12.1.3.4. SWOT Analysis
- 12.1.4 SENER Grupo de Ingenieria S A
- 12.1.4.1. Company Overview
- 12.1.4.2. Products
- 12.1.4.3. Company Financials
- 12.1.4.4. SWOT Analysis
- 12.1.5 Acciona S A
- 12.1.5.1. Company Overview
- 12.1.5.2. Products
- 12.1.5.3. Company Financials
- 12.1.5.4. SWOT Analysis
- 12.1.6 Abengoa SA
- 12.1.6.1. Company Overview
- 12.1.6.2. Products
- 12.1.6.3. Company Financials
- 12.1.6.4. SWOT Analysis
- 12.1.7 Yara International ASA
- 12.1.7.1. Company Overview
- 12.1.7.2. Products
- 12.1.7.3. Company Financials
- 12.1.7.4. SWOT Analysis
- 12.1.8 BrightSource Energy Inc
- 12.1.8.1. Company Overview
- 12.1.8.2. Products
- 12.1.8.3. Company Financials
- 12.1.8.4. SWOT Analysis
- 12.1.1 SCHOTT AG
- 12.2. Market Entropy
- 12.2.1 Company's Key Areas Served
- 12.2.2 Recent Developments
- 12.3. Company Market Share Analysis 2025
- 12.3.1 Top 5 Companies Market Share Analysis
- 12.3.2 Top 3 Companies Market Share Analysis
- 12.4. List of Potential Customers
- 13. Research Methodology
List of Figures
- Figure 1: Global Molten Salt Thermal Energy Storage Industry Revenue Breakdown (billion, %) by Region 2025 & 2033
- Figure 2: North America Molten Salt Thermal Energy Storage Industry Revenue (billion), by Technology 2025 & 2033
- Figure 3: North America Molten Salt Thermal Energy Storage Industry Revenue Share (%), by Technology 2025 & 2033
- Figure 4: North America Molten Salt Thermal Energy Storage Industry Revenue (billion), by Country 2025 & 2033
- Figure 5: North America Molten Salt Thermal Energy Storage Industry Revenue Share (%), by Country 2025 & 2033
- Figure 6: Asia Pacific Molten Salt Thermal Energy Storage Industry Revenue (billion), by Technology 2025 & 2033
- Figure 7: Asia Pacific Molten Salt Thermal Energy Storage Industry Revenue Share (%), by Technology 2025 & 2033
- Figure 8: Asia Pacific Molten Salt Thermal Energy Storage Industry Revenue (billion), by Country 2025 & 2033
- Figure 9: Asia Pacific Molten Salt Thermal Energy Storage Industry Revenue Share (%), by Country 2025 & 2033
- Figure 10: Europe Molten Salt Thermal Energy Storage Industry Revenue (billion), by Technology 2025 & 2033
- Figure 11: Europe Molten Salt Thermal Energy Storage Industry Revenue Share (%), by Technology 2025 & 2033
- Figure 12: Europe Molten Salt Thermal Energy Storage Industry Revenue (billion), by Country 2025 & 2033
- Figure 13: Europe Molten Salt Thermal Energy Storage Industry Revenue Share (%), by Country 2025 & 2033
- Figure 14: South America Molten Salt Thermal Energy Storage Industry Revenue (billion), by Technology 2025 & 2033
- Figure 15: South America Molten Salt Thermal Energy Storage Industry Revenue Share (%), by Technology 2025 & 2033
- Figure 16: South America Molten Salt Thermal Energy Storage Industry Revenue (billion), by Country 2025 & 2033
- Figure 17: South America Molten Salt Thermal Energy Storage Industry Revenue Share (%), by Country 2025 & 2033
- Figure 18: Middle East and Africa Molten Salt Thermal Energy Storage Industry Revenue (billion), by Technology 2025 & 2033
- Figure 19: Middle East and Africa Molten Salt Thermal Energy Storage Industry Revenue Share (%), by Technology 2025 & 2033
- Figure 20: Middle East and Africa Molten Salt Thermal Energy Storage Industry Revenue (billion), by Country 2025 & 2033
- Figure 21: Middle East and Africa Molten Salt Thermal Energy Storage Industry Revenue Share (%), by Country 2025 & 2033
List of Tables
- Table 1: Global Molten Salt Thermal Energy Storage Industry Revenue billion Forecast, by Technology 2020 & 2033
- Table 2: Global Molten Salt Thermal Energy Storage Industry Revenue billion Forecast, by Region 2020 & 2033
- Table 3: Global Molten Salt Thermal Energy Storage Industry Revenue billion Forecast, by Technology 2020 & 2033
- Table 4: Global Molten Salt Thermal Energy Storage Industry Revenue billion Forecast, by Country 2020 & 2033
- Table 5: Global Molten Salt Thermal Energy Storage Industry Revenue billion Forecast, by Technology 2020 & 2033
- Table 6: Global Molten Salt Thermal Energy Storage Industry Revenue billion Forecast, by Country 2020 & 2033
- Table 7: Global Molten Salt Thermal Energy Storage Industry Revenue billion Forecast, by Technology 2020 & 2033
- Table 8: Global Molten Salt Thermal Energy Storage Industry Revenue billion Forecast, by Country 2020 & 2033
- Table 9: Global Molten Salt Thermal Energy Storage Industry Revenue billion Forecast, by Technology 2020 & 2033
- Table 10: Global Molten Salt Thermal Energy Storage Industry Revenue billion Forecast, by Country 2020 & 2033
- Table 11: Global Molten Salt Thermal Energy Storage Industry Revenue billion Forecast, by Technology 2020 & 2033
- Table 12: Global Molten Salt Thermal Energy Storage Industry Revenue billion Forecast, by Country 2020 & 2033
Frequently Asked Questions
1. What is the projected Compound Annual Growth Rate (CAGR) of the Molten Salt Thermal Energy Storage Industry?
The projected CAGR is approximately 9.8%.
2. Which companies are prominent players in the Molten Salt Thermal Energy Storage Industry?
Key companies in the market include SCHOTT AG, SolarReserve LLC, Engie SA, SENER Grupo de Ingenieria S A, Acciona S A, Abengoa SA, Yara International ASA, BrightSource Energy Inc.
3. What are the main segments of the Molten Salt Thermal Energy Storage Industry?
The market segments include Technology.
4. Can you provide details about the market size?
The market size is estimated to be USD 2.22 billion as of 2022.
5. What are some drivers contributing to market growth?
4.; Increasing Investments in Offshore Wind Power Projects4.; Supportive Government Policies.
6. What are the notable trends driving market growth?
Parabolic Trough Segment to Dominate the Market.
7. Are there any restraints impacting market growth?
4.; Increasing Adopting of Alternative Clean Energy Sources (Ex: Solar. Hydro).
8. Can you provide examples of recent developments in the market?
November 2022: Hyme Energy ApS announced that the company is partnering with Bornholms Energi & Forsyning (BEOF) to build its first molten salt thermal energy storage demonstrator on the Danish island of Bornholm. The storage facility is scheduled for completion in 2024 and will have a capacity of 1 MW/20 MWh. It will provide heat, power, and ancillary services to the local network.
9. What pricing options are available for accessing the report?
Pricing options include single-user, multi-user, and enterprise licenses priced at USD 4750, USD 5250, and USD 8750 respectively.
10. Is the market size provided in terms of value or volume?
The market size is provided in terms of value, measured in billion.
11. Are there any specific market keywords associated with the report?
Yes, the market keyword associated with the report is "Molten Salt Thermal Energy Storage Industry," which aids in identifying and referencing the specific market segment covered.
12. How do I determine which pricing option suits my needs best?
The pricing options vary based on user requirements and access needs. Individual users may opt for single-user licenses, while businesses requiring broader access may choose multi-user or enterprise licenses for cost-effective access to the report.
13. Are there any additional resources or data provided in the Molten Salt Thermal Energy Storage Industry report?
While the report offers comprehensive insights, it's advisable to review the specific contents or supplementary materials provided to ascertain if additional resources or data are available.
14. How can I stay updated on further developments or reports in the Molten Salt Thermal Energy Storage Industry?
To stay informed about further developments, trends, and reports in the Molten Salt Thermal Energy Storage Industry, consider subscribing to industry newsletters, following relevant companies and organizations, or regularly checking reputable industry news sources and publications.
Methodology
Step 1 - Identification of Relevant Samples Size from Population Database


Step 2 - Approaches for Defining Global Market Size (Value, Volume* & Price*)

Note*: In applicable scenarios
Step 3 - Data Sources
Primary Research
- Web Analytics
- Survey Reports
- Research Institute
- Latest Research Reports
- Opinion Leaders
Secondary Research
- Annual Reports
- White Paper
- Latest Press Release
- Industry Association
- Paid Database
- Investor Presentations

Step 4 - Data Triangulation
Involves using different sources of information in order to increase the validity of a study
These sources are likely to be stakeholders in a program - participants, other researchers, program staff, other community members, and so on.
Then we put all data in single framework & apply various statistical tools to find out the dynamic on the market.
During the analysis stage, feedback from the stakeholder groups would be compared to determine areas of agreement as well as areas of divergence