

Key Insights
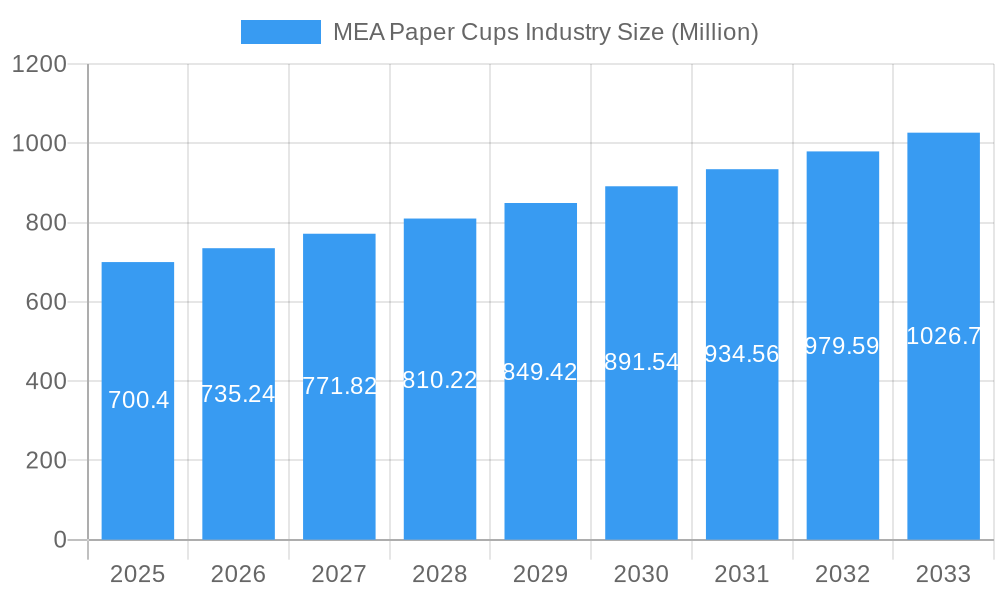
The Middle East and Africa (MEA) paper cups market, valued at $700.40 million in 2025, is projected to experience robust growth, driven by the expanding quick-service restaurant (QSR) sector and increasing consumer preference for convenient, disposable food packaging. The market's Compound Annual Growth Rate (CAGR) of 4.81% from 2025 to 2033 indicates a steady upward trajectory. Key growth drivers include rising urbanization, a burgeoning population, and the increasing adoption of takeaway and delivery services, particularly in major metropolitan areas across the MEA region. The hot paper cup segment currently dominates the market due to its widespread use in serving hot beverages like tea and coffee, a staple across many MEA cultures. However, the cold paper cup segment is poised for significant growth fueled by the rising popularity of iced beverages and cold drinks. Furthermore, the institutional segment, encompassing schools, offices, and hospitals, presents a substantial opportunity for market expansion. While challenges exist, such as fluctuating raw material prices and environmental concerns related to disposable packaging, the overall market outlook remains positive, supported by continued economic growth and evolving consumer lifestyles in the region. Major players like Huhtamaki Group and local manufacturers are actively shaping market dynamics through product innovation and strategic partnerships.
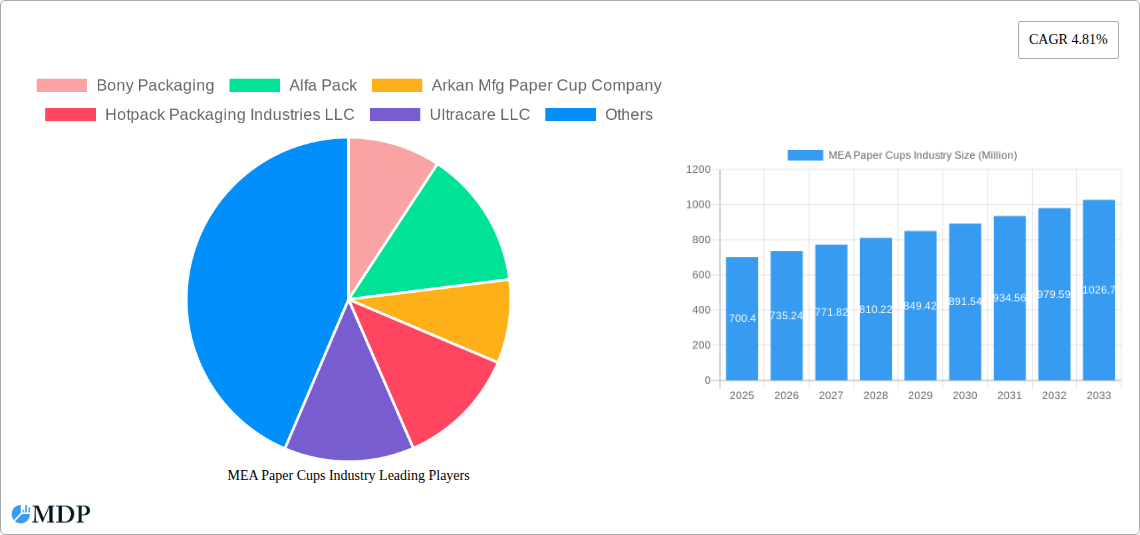
MEA Paper Cups Industry Market Size (In Million)
The competitive landscape within the MEA paper cups market is characterized by a mix of both multinational corporations and regional players. Established international players bring significant technological advancements and established distribution networks, while local manufacturers leverage their intimate knowledge of regional preferences and cost-effective production strategies. This creates a dynamic balance that fosters both innovation and competitive pricing. Future growth will likely hinge on factors such as sustainable packaging solutions (e.g., biodegradable or recyclable paper cups) gaining traction, aligning with growing environmental awareness. Furthermore, strategic collaborations between manufacturers and QSR chains could significantly influence market share and product development. Specific country markets such as the UAE and Saudi Arabia, with their large and rapidly developing economies, will continue to be major growth contributors. The ongoing diversification of the MEA economy and the rising disposable income levels will further fuel the market's expansion throughout the forecast period.
MEA Paper Cups Industry Company Market Share
MEA Paper Cups Industry: Market Report 2019-2033
This comprehensive report provides a detailed analysis of the Middle East and Africa (MEA) paper cups industry, offering invaluable insights for stakeholders seeking to navigate this dynamic market. With a study period spanning 2019-2033, a base year of 2025, and a forecast period of 2025-2033, this report delivers actionable intelligence to inform strategic decision-making. The report examines key market segments, leading players, and emerging trends, providing a complete picture of the MEA paper cups landscape. Expect detailed analysis of market size (in Millions), CAGR, and market share for major players and segments.
MEA Paper Cups Industry Market Dynamics & Concentration
The MEA paper cups market is characterized by a moderately concentrated landscape, with several key players vying for market share. Market concentration is influenced by factors such as economies of scale, brand recognition, and distribution networks. Innovation in materials, sustainable packaging solutions, and designs are key drivers. Stringent regulatory frameworks regarding food safety and environmental sustainability are shaping industry practices. The rise of eco-friendly alternatives like biodegradable cups presents a significant challenge, while the increasing demand from the quick-service restaurant (QSR) sector fuels market growth. Mergers and acquisitions (M&A) activity remains moderate, with a predicted xx number of deals in the last five years, leading to some consolidation within the industry. Market share for the top five players is estimated to be xx%, reflecting a competitive yet concentrated market.
- Key Players: Bony Packaging, Alfa Pack, Arkan Mfg Paper Cup Company, Hotpack Packaging Industries LLC, Ultracare LLC, Golden Paper Cups Manufacturing LLC, Falcon Pack, Detpak South Africa (Pty) Ltd, Huhtamaki Group, Pack-Zone, MAIMOON Papers Industry LLC, Saqr Pack, Enpi Group, Gulf East Paper & Plastic Group, Graphic Packaging International, Saham Group (List not exhaustive).
- Market Share Dynamics: The market share distribution varies significantly across countries and segments. Larger players tend to hold a larger share in established markets.
- M&A Activity: xx M&A deals recorded between 2019 and 2024.
MEA Paper Cups Industry Industry Trends & Analysis
The MEA paper cups market exhibits a robust growth trajectory, driven primarily by the burgeoning QSR sector and increasing disposable incomes across the region. The CAGR during the historical period (2019-2024) is estimated at xx%, while the projected CAGR for the forecast period (2025-2033) is xx%. Technological advancements in manufacturing processes, such as automation and high-speed printing, are enhancing efficiency and reducing production costs. Consumer preferences are shifting toward eco-friendly and aesthetically appealing cups, demanding innovation in materials and designs. Competitive intensity is high, with companies focusing on product differentiation, pricing strategies, and brand building to gain a competitive edge. Market penetration of paper cups remains high in urban areas and is steadily increasing in rural regions, fueled by rising disposable incomes and changing lifestyle patterns.
Leading Markets & Segments in MEA Paper Cups Industry
The UAE and Saudi Arabia are the leading markets within the MEA region, driven by high population density, strong economic growth, and a thriving QSR industry. South Africa and Nigeria also contribute significantly to the overall market size.
By Country:
- United Arab Emirates: High per capita consumption, sophisticated retail infrastructure, significant presence of international QSR chains.
- Saudi Arabia: Rapid population growth, expanding food service sector, and government initiatives supporting infrastructure development.
- South Africa: Established manufacturing base, growing middle class, and expanding QSR sector.
- Nigeria: Large and growing population, increasing urbanization, and a developing QSR industry.
- Rest of MEA: Market growth is driven by expanding food service sectors and rising disposable incomes.
By Cup Type:
- Hot Paper Cups: Dominate the market due to extensive use in cafes, restaurants, and offices.
- Cold Paper Cups: Significant market share due to increasing demand from beverage outlets.
By Application:
- Quick Service Restaurants: This segment constitutes the largest share, reflecting the dominance of QSR chains across the region.
- Institutional: Growth potential is driven by increasing demand from schools, hospitals, and corporate offices.
- Other Applications: Includes various other applications, such as home use, special events, and vending machines.
MEA Paper Cups Industry Product Developments
Recent product innovations focus on enhancing functionality and sustainability. The introduction of biodegradable and compostable cups is gaining traction, driven by increasing environmental awareness. Improved coatings are enhancing the cups' heat and liquid resistance. Companies are also focusing on customization options, including unique designs and branding, to cater to the diverse needs of various clients. These innovations significantly contribute to improved market fit and competitive advantage.
Key Drivers of MEA Paper Cups Industry Growth
The MEA paper cups industry's growth is driven by several key factors:
- Growing QSR Sector: The rapid expansion of quick-service restaurants and cafes significantly fuels demand.
- Rising Disposable Incomes: Increased purchasing power is leading to higher consumption of disposable food and beverage products.
- Urbanization: Population shifts towards urban areas further boost demand for convenience-focused products.
- Government Initiatives: Investments in infrastructure and supportive economic policies contribute to growth.
Challenges in the MEA Paper Cups Industry Market
The industry faces several challenges including:
- Fluctuating Raw Material Prices: Price volatility affects profitability and production costs.
- Environmental Concerns: Growing concerns over plastic waste necessitate a transition to sustainable materials.
- Intense Competition: The market is highly competitive, requiring continuous innovation and differentiation.
- Supply Chain Disruptions: Global supply chain issues can affect raw material availability and production.
Emerging Opportunities in MEA Paper Cups Industry
Significant opportunities exist in:
- Sustainable Packaging: The adoption of biodegradable and compostable materials presents a major opportunity for growth.
- Customization and Branding: Tailored designs and branding options cater to diverse client needs.
- Market Expansion: Untapped markets in rural areas offer considerable growth potential.
- Strategic Partnerships: Collaborations with QSR chains and distributors create market access.
Leading Players in the MEA Paper Cups Industry Sector
- Bony Packaging
- Alfa Pack
- Arkan Mfg Paper Cup Company
- Hotpack Packaging Industries LLC
- Ultracare LLC
- Golden Paper Cups Manufacturing LLC
- Falcon Pack
- Detpak South Africa (Pty) Ltd
- Huhtamaki Group
- Pack-Zone
- MAIMOON Papers Industry LLC
- Saqr Pack
- Enpi Group
- Gulf East Paper & Plastic Group
- Graphic Packaging International
- Saham Group
Key Milestones in MEA Paper Cups Industry Industry
- November 2022: HotpackGlobal launched a new manufacturing plant in Qatar, expanding its global footprint and production capacity for paper cups and other packaging products.
- September 2022: Huhtamaki and StoraEnso launched "The Cup Collective," a paper cup recycling initiative aimed at promoting sustainability within the industry.
Strategic Outlook for MEA Paper Cups Industry Market
The MEA paper cups industry presents a promising outlook. Sustained growth is anticipated, driven by population growth, rising disposable incomes, and the continued expansion of the food service sector. Strategic opportunities lie in embracing sustainability, focusing on product innovation, and expanding into new markets. Companies that successfully adapt to changing consumer preferences and regulatory landscapes are poised for significant growth in the coming years.
MEA Paper Cups Industry Segmentation
-
1. Cup Type
- 1.1. Hot Paper Cup
- 1.2. Cold Paper Cup
-
2. Application
- 2.1. Quick Service Restaurants
- 2.2. Institutional
- 2.3. Other Applications
MEA Paper Cups Industry Segmentation By Geography
-
1. North America
- 1.1. United States
- 1.2. Canada
- 1.3. Mexico
-
2. South America
- 2.1. Brazil
- 2.2. Argentina
- 2.3. Rest of South America
-
3. Europe
- 3.1. United Kingdom
- 3.2. Germany
- 3.3. France
- 3.4. Italy
- 3.5. Spain
- 3.6. Russia
- 3.7. Benelux
- 3.8. Nordics
- 3.9. Rest of Europe
-
4. Middle East & Africa
- 4.1. Turkey
- 4.2. Israel
- 4.3. GCC
- 4.4. North Africa
- 4.5. South Africa
- 4.6. Rest of Middle East & Africa
-
5. Asia Pacific
- 5.1. China
- 5.2. India
- 5.3. Japan
- 5.4. South Korea
- 5.5. ASEAN
- 5.6. Oceania
- 5.7. Rest of Asia Pacific
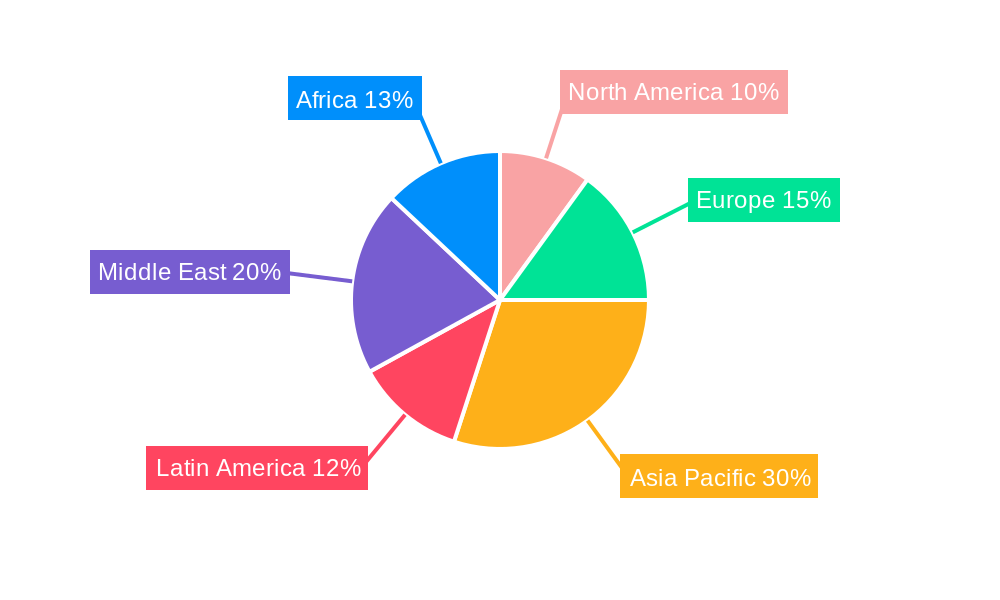
MEA Paper Cups Industry Regional Market Share
Geographic Coverage of MEA Paper Cups Industry
MEA Paper Cups Industry REPORT HIGHLIGHTS
| Aspects | Details |
|---|---|
| Study Period | 2020-2034 |
| Base Year | 2025 |
| Estimated Year | 2026 |
| Forecast Period | 2026-2034 |
| Historical Period | 2020-2025 |
| Growth Rate | CAGR of 4.81% from 2020-2034 |
| Segmentation |
|
Table of Contents
- 1. Introduction
- 1.1. Research Scope
- 1.2. Market Segmentation
- 1.3. Research Objective
- 1.4. Definitions and Assumptions
- 2. Executive Summary
- 2.1. Market Snapshot
- 3. Market Dynamics
- 3.1. Market Drivers
- 3.2. Market Restrains
- 3.3. Market Trends
- 3.4. Market Opportunities
- 4. Market Factor Analysis
- 4.1. Porters Five Forces
- 4.1.1. Bargaining Power of Suppliers
- 4.1.2. Bargaining Power of Buyers
- 4.1.3. Threat of New Entrants
- 4.1.4. Threat of Substitutes
- 4.1.5. Competitive Rivalry
- 4.2. PESTEL analysis
- 4.3. BCG Analysis
- 4.3.1. Stars (High Growth, High Market Share)
- 4.3.2. Cash Cows (Low Growth, High Market Share)
- 4.3.3. Question Mark (High Growth, Low Market Share)
- 4.3.4. Dogs (Low Growth, Low Market Share)
- 4.4. Ansoff Matrix Analysis
- 4.5. Supply Chain Analysis
- 4.6. Regulatory Landscape
- 4.7. Current Market Potential and Opportunity Assessment (TAM–SAM–SOM Framework)
- 4.8. MDP Analyst Note
- 4.1. Porters Five Forces
- 5. Market Analysis, Insights and Forecast 2021-2033
- 5.1. Market Analysis, Insights and Forecast - by Cup Type
- 5.1.1. Hot Paper Cup
- 5.1.2. Cold Paper Cup
- 5.2. Market Analysis, Insights and Forecast - by Application
- 5.2.1. Quick Service Restaurants
- 5.2.2. Institutional
- 5.2.3. Other Applications
- 5.3. Market Analysis, Insights and Forecast - by Region
- 5.3.1. North America
- 5.3.2. South America
- 5.3.3. Europe
- 5.3.4. Middle East & Africa
- 5.3.5. Asia Pacific
- 5.1. Market Analysis, Insights and Forecast - by Cup Type
- 6. Global MEA Paper Cups Industry Analysis, Insights and Forecast, 2021-2033
- 6.1. Market Analysis, Insights and Forecast - by Cup Type
- 6.1.1. Hot Paper Cup
- 6.1.2. Cold Paper Cup
- 6.2. Market Analysis, Insights and Forecast - by Application
- 6.2.1. Quick Service Restaurants
- 6.2.2. Institutional
- 6.2.3. Other Applications
- 6.1. Market Analysis, Insights and Forecast - by Cup Type
- 7. North America MEA Paper Cups Industry Analysis, Insights and Forecast, 2020-2032
- 7.1. Market Analysis, Insights and Forecast - by Cup Type
- 7.1.1. Hot Paper Cup
- 7.1.2. Cold Paper Cup
- 7.2. Market Analysis, Insights and Forecast - by Application
- 7.2.1. Quick Service Restaurants
- 7.2.2. Institutional
- 7.2.3. Other Applications
- 7.1. Market Analysis, Insights and Forecast - by Cup Type
- 8. South America MEA Paper Cups Industry Analysis, Insights and Forecast, 2020-2032
- 8.1. Market Analysis, Insights and Forecast - by Cup Type
- 8.1.1. Hot Paper Cup
- 8.1.2. Cold Paper Cup
- 8.2. Market Analysis, Insights and Forecast - by Application
- 8.2.1. Quick Service Restaurants
- 8.2.2. Institutional
- 8.2.3. Other Applications
- 8.1. Market Analysis, Insights and Forecast - by Cup Type
- 9. Europe MEA Paper Cups Industry Analysis, Insights and Forecast, 2020-2032
- 9.1. Market Analysis, Insights and Forecast - by Cup Type
- 9.1.1. Hot Paper Cup
- 9.1.2. Cold Paper Cup
- 9.2. Market Analysis, Insights and Forecast - by Application
- 9.2.1. Quick Service Restaurants
- 9.2.2. Institutional
- 9.2.3. Other Applications
- 9.1. Market Analysis, Insights and Forecast - by Cup Type
- 10. Middle East & Africa MEA Paper Cups Industry Analysis, Insights and Forecast, 2020-2032
- 10.1. Market Analysis, Insights and Forecast - by Cup Type
- 10.1.1. Hot Paper Cup
- 10.1.2. Cold Paper Cup
- 10.2. Market Analysis, Insights and Forecast - by Application
- 10.2.1. Quick Service Restaurants
- 10.2.2. Institutional
- 10.2.3. Other Applications
- 10.1. Market Analysis, Insights and Forecast - by Cup Type
- 11. Asia Pacific MEA Paper Cups Industry Analysis, Insights and Forecast, 2020-2032
- 11.1. Market Analysis, Insights and Forecast - by Cup Type
- 11.1.1. Hot Paper Cup
- 11.1.2. Cold Paper Cup
- 11.2. Market Analysis, Insights and Forecast - by Application
- 11.2.1. Quick Service Restaurants
- 11.2.2. Institutional
- 11.2.3. Other Applications
- 11.1. Market Analysis, Insights and Forecast - by Cup Type
- 12. Competitive Analysis
- 12.1. Company Profiles
- 12.1.1 Bony Packaging
- 12.1.1.1. Company Overview
- 12.1.1.2. Products
- 12.1.1.3. Company Financials
- 12.1.1.4. SWOT Analysis
- 12.1.2 Alfa Pack
- 12.1.2.1. Company Overview
- 12.1.2.2. Products
- 12.1.2.3. Company Financials
- 12.1.2.4. SWOT Analysis
- 12.1.3 Arkan Mfg Paper Cup Company
- 12.1.3.1. Company Overview
- 12.1.3.2. Products
- 12.1.3.3. Company Financials
- 12.1.3.4. SWOT Analysis
- 12.1.4 Hotpack Packaging Industries LLC
- 12.1.4.1. Company Overview
- 12.1.4.2. Products
- 12.1.4.3. Company Financials
- 12.1.4.4. SWOT Analysis
- 12.1.5 Ultracare LLC
- 12.1.5.1. Company Overview
- 12.1.5.2. Products
- 12.1.5.3. Company Financials
- 12.1.5.4. SWOT Analysis
- 12.1.6 Golden Paper Cups Manufacturing LLC
- 12.1.6.1. Company Overview
- 12.1.6.2. Products
- 12.1.6.3. Company Financials
- 12.1.6.4. SWOT Analysis
- 12.1.7 Falcon Pack*List Not Exhaustive
- 12.1.7.1. Company Overview
- 12.1.7.2. Products
- 12.1.7.3. Company Financials
- 12.1.7.4. SWOT Analysis
- 12.1.8 Detpak South Africa (Pty) Ltd
- 12.1.8.1. Company Overview
- 12.1.8.2. Products
- 12.1.8.3. Company Financials
- 12.1.8.4. SWOT Analysis
- 12.1.9 Huhtamaki Group
- 12.1.9.1. Company Overview
- 12.1.9.2. Products
- 12.1.9.3. Company Financials
- 12.1.9.4. SWOT Analysis
- 12.1.10 Pack- Zone
- 12.1.10.1. Company Overview
- 12.1.10.2. Products
- 12.1.10.3. Company Financials
- 12.1.10.4. SWOT Analysis
- 12.1.11 MAIMOON Papers Industry LLC
- 12.1.11.1. Company Overview
- 12.1.11.2. Products
- 12.1.11.3. Company Financials
- 12.1.11.4. SWOT Analysis
- 12.1.12 Saqr Pack
- 12.1.12.1. Company Overview
- 12.1.12.2. Products
- 12.1.12.3. Company Financials
- 12.1.12.4. SWOT Analysis
- 12.1.13 Enpi Group
- 12.1.13.1. Company Overview
- 12.1.13.2. Products
- 12.1.13.3. Company Financials
- 12.1.13.4. SWOT Analysis
- 12.1.14 Gulf East Paper & Plastic Group
- 12.1.14.1. Company Overview
- 12.1.14.2. Products
- 12.1.14.3. Company Financials
- 12.1.14.4. SWOT Analysis
- 12.1.15 Graphic Packaging International
- 12.1.15.1. Company Overview
- 12.1.15.2. Products
- 12.1.15.3. Company Financials
- 12.1.15.4. SWOT Analysis
- 12.1.16 Saham Group
- 12.1.16.1. Company Overview
- 12.1.16.2. Products
- 12.1.16.3. Company Financials
- 12.1.16.4. SWOT Analysis
- 12.1.1 Bony Packaging
- 12.2. Market Entropy
- 12.2.1 Company's Key Areas Served
- 12.2.2 Recent Developments
- 12.3. Company Market Share Analysis 2025
- 12.3.1 Top 5 Companies Market Share Analysis
- 12.3.2 Top 3 Companies Market Share Analysis
- 12.4. List of Potential Customers
- 13. Research Methodology
List of Figures
- Figure 1: Global MEA Paper Cups Industry Revenue Breakdown (Million, %) by Region 2025 & 2033
- Figure 2: North America MEA Paper Cups Industry Revenue (Million), by Cup Type 2025 & 2033
- Figure 3: North America MEA Paper Cups Industry Revenue Share (%), by Cup Type 2025 & 2033
- Figure 4: North America MEA Paper Cups Industry Revenue (Million), by Application 2025 & 2033
- Figure 5: North America MEA Paper Cups Industry Revenue Share (%), by Application 2025 & 2033
- Figure 6: North America MEA Paper Cups Industry Revenue (Million), by Country 2025 & 2033
- Figure 7: North America MEA Paper Cups Industry Revenue Share (%), by Country 2025 & 2033
- Figure 8: South America MEA Paper Cups Industry Revenue (Million), by Cup Type 2025 & 2033
- Figure 9: South America MEA Paper Cups Industry Revenue Share (%), by Cup Type 2025 & 2033
- Figure 10: South America MEA Paper Cups Industry Revenue (Million), by Application 2025 & 2033
- Figure 11: South America MEA Paper Cups Industry Revenue Share (%), by Application 2025 & 2033
- Figure 12: South America MEA Paper Cups Industry Revenue (Million), by Country 2025 & 2033
- Figure 13: South America MEA Paper Cups Industry Revenue Share (%), by Country 2025 & 2033
- Figure 14: Europe MEA Paper Cups Industry Revenue (Million), by Cup Type 2025 & 2033
- Figure 15: Europe MEA Paper Cups Industry Revenue Share (%), by Cup Type 2025 & 2033
- Figure 16: Europe MEA Paper Cups Industry Revenue (Million), by Application 2025 & 2033
- Figure 17: Europe MEA Paper Cups Industry Revenue Share (%), by Application 2025 & 2033
- Figure 18: Europe MEA Paper Cups Industry Revenue (Million), by Country 2025 & 2033
- Figure 19: Europe MEA Paper Cups Industry Revenue Share (%), by Country 2025 & 2033
- Figure 20: Middle East & Africa MEA Paper Cups Industry Revenue (Million), by Cup Type 2025 & 2033
- Figure 21: Middle East & Africa MEA Paper Cups Industry Revenue Share (%), by Cup Type 2025 & 2033
- Figure 22: Middle East & Africa MEA Paper Cups Industry Revenue (Million), by Application 2025 & 2033
- Figure 23: Middle East & Africa MEA Paper Cups Industry Revenue Share (%), by Application 2025 & 2033
- Figure 24: Middle East & Africa MEA Paper Cups Industry Revenue (Million), by Country 2025 & 2033
- Figure 25: Middle East & Africa MEA Paper Cups Industry Revenue Share (%), by Country 2025 & 2033
- Figure 26: Asia Pacific MEA Paper Cups Industry Revenue (Million), by Cup Type 2025 & 2033
- Figure 27: Asia Pacific MEA Paper Cups Industry Revenue Share (%), by Cup Type 2025 & 2033
- Figure 28: Asia Pacific MEA Paper Cups Industry Revenue (Million), by Application 2025 & 2033
- Figure 29: Asia Pacific MEA Paper Cups Industry Revenue Share (%), by Application 2025 & 2033
- Figure 30: Asia Pacific MEA Paper Cups Industry Revenue (Million), by Country 2025 & 2033
- Figure 31: Asia Pacific MEA Paper Cups Industry Revenue Share (%), by Country 2025 & 2033
List of Tables
- Table 1: Global MEA Paper Cups Industry Revenue Million Forecast, by Cup Type 2020 & 2033
- Table 2: Global MEA Paper Cups Industry Revenue Million Forecast, by Application 2020 & 2033
- Table 3: Global MEA Paper Cups Industry Revenue Million Forecast, by Region 2020 & 2033
- Table 4: Global MEA Paper Cups Industry Revenue Million Forecast, by Cup Type 2020 & 2033
- Table 5: Global MEA Paper Cups Industry Revenue Million Forecast, by Application 2020 & 2033
- Table 6: Global MEA Paper Cups Industry Revenue Million Forecast, by Country 2020 & 2033
- Table 7: United States MEA Paper Cups Industry Revenue (Million) Forecast, by Application 2020 & 2033
- Table 8: Canada MEA Paper Cups Industry Revenue (Million) Forecast, by Application 2020 & 2033
- Table 9: Mexico MEA Paper Cups Industry Revenue (Million) Forecast, by Application 2020 & 2033
- Table 10: Global MEA Paper Cups Industry Revenue Million Forecast, by Cup Type 2020 & 2033
- Table 11: Global MEA Paper Cups Industry Revenue Million Forecast, by Application 2020 & 2033
- Table 12: Global MEA Paper Cups Industry Revenue Million Forecast, by Country 2020 & 2033
- Table 13: Brazil MEA Paper Cups Industry Revenue (Million) Forecast, by Application 2020 & 2033
- Table 14: Argentina MEA Paper Cups Industry Revenue (Million) Forecast, by Application 2020 & 2033
- Table 15: Rest of South America MEA Paper Cups Industry Revenue (Million) Forecast, by Application 2020 & 2033
- Table 16: Global MEA Paper Cups Industry Revenue Million Forecast, by Cup Type 2020 & 2033
- Table 17: Global MEA Paper Cups Industry Revenue Million Forecast, by Application 2020 & 2033
- Table 18: Global MEA Paper Cups Industry Revenue Million Forecast, by Country 2020 & 2033
- Table 19: United Kingdom MEA Paper Cups Industry Revenue (Million) Forecast, by Application 2020 & 2033
- Table 20: Germany MEA Paper Cups Industry Revenue (Million) Forecast, by Application 2020 & 2033
- Table 21: France MEA Paper Cups Industry Revenue (Million) Forecast, by Application 2020 & 2033
- Table 22: Italy MEA Paper Cups Industry Revenue (Million) Forecast, by Application 2020 & 2033
- Table 23: Spain MEA Paper Cups Industry Revenue (Million) Forecast, by Application 2020 & 2033
- Table 24: Russia MEA Paper Cups Industry Revenue (Million) Forecast, by Application 2020 & 2033
- Table 25: Benelux MEA Paper Cups Industry Revenue (Million) Forecast, by Application 2020 & 2033
- Table 26: Nordics MEA Paper Cups Industry Revenue (Million) Forecast, by Application 2020 & 2033
- Table 27: Rest of Europe MEA Paper Cups Industry Revenue (Million) Forecast, by Application 2020 & 2033
- Table 28: Global MEA Paper Cups Industry Revenue Million Forecast, by Cup Type 2020 & 2033
- Table 29: Global MEA Paper Cups Industry Revenue Million Forecast, by Application 2020 & 2033
- Table 30: Global MEA Paper Cups Industry Revenue Million Forecast, by Country 2020 & 2033
- Table 31: Turkey MEA Paper Cups Industry Revenue (Million) Forecast, by Application 2020 & 2033
- Table 32: Israel MEA Paper Cups Industry Revenue (Million) Forecast, by Application 2020 & 2033
- Table 33: GCC MEA Paper Cups Industry Revenue (Million) Forecast, by Application 2020 & 2033
- Table 34: North Africa MEA Paper Cups Industry Revenue (Million) Forecast, by Application 2020 & 2033
- Table 35: South Africa MEA Paper Cups Industry Revenue (Million) Forecast, by Application 2020 & 2033
- Table 36: Rest of Middle East & Africa MEA Paper Cups Industry Revenue (Million) Forecast, by Application 2020 & 2033
- Table 37: Global MEA Paper Cups Industry Revenue Million Forecast, by Cup Type 2020 & 2033
- Table 38: Global MEA Paper Cups Industry Revenue Million Forecast, by Application 2020 & 2033
- Table 39: Global MEA Paper Cups Industry Revenue Million Forecast, by Country 2020 & 2033
- Table 40: China MEA Paper Cups Industry Revenue (Million) Forecast, by Application 2020 & 2033
- Table 41: India MEA Paper Cups Industry Revenue (Million) Forecast, by Application 2020 & 2033
- Table 42: Japan MEA Paper Cups Industry Revenue (Million) Forecast, by Application 2020 & 2033
- Table 43: South Korea MEA Paper Cups Industry Revenue (Million) Forecast, by Application 2020 & 2033
- Table 44: ASEAN MEA Paper Cups Industry Revenue (Million) Forecast, by Application 2020 & 2033
- Table 45: Oceania MEA Paper Cups Industry Revenue (Million) Forecast, by Application 2020 & 2033
- Table 46: Rest of Asia Pacific MEA Paper Cups Industry Revenue (Million) Forecast, by Application 2020 & 2033
Frequently Asked Questions
1. What is the projected Compound Annual Growth Rate (CAGR) of the MEA Paper Cups Industry?
The projected CAGR is approximately 4.81%.
2. Which companies are prominent players in the MEA Paper Cups Industry?
Key companies in the market include Bony Packaging, Alfa Pack, Arkan Mfg Paper Cup Company, Hotpack Packaging Industries LLC, Ultracare LLC, Golden Paper Cups Manufacturing LLC, Falcon Pack*List Not Exhaustive, Detpak South Africa (Pty) Ltd, Huhtamaki Group, Pack- Zone, MAIMOON Papers Industry LLC, Saqr Pack, Enpi Group, Gulf East Paper & Plastic Group, Graphic Packaging International, Saham Group.
3. What are the main segments of the MEA Paper Cups Industry?
The market segments include Cup Type, Application.
4. Can you provide details about the market size?
The market size is estimated to be USD 700.40 Million as of 2022.
5. What are some drivers contributing to market growth?
Rising Demand For on-the-go Consumption of Beverages; Sustainability Measures Coupled with Recent Innovations have Played a Role in Shelf Life of Products.
6. What are the notable trends driving market growth?
Quick Service Restaurants to Witness the Growth.
7. Are there any restraints impacting market growth?
Ongoing Market Fragmentation and the Dependence on Materials Expected to Affect Margins.
8. Can you provide examples of recent developments in the market?
November 2022: HotpackGlobal, the UAE-based global leader in disposable food packaging products, launched its manufacturing plant in Qatar. The plant is the 15th Hotpack-owned and operated factory worldwide, reflecting the company's global vision to become a global food packaging brand leader by 2030. The manufacturing plant is located in Doha's new industrial area, specializing in various Hotpackpaper products ranging from folding and corrugated cartons to paper bags and cups.
9. What pricing options are available for accessing the report?
Pricing options include single-user, multi-user, and enterprise licenses priced at USD 4750, USD 5250, and USD 8750 respectively.
10. Is the market size provided in terms of value or volume?
The market size is provided in terms of value, measured in Million.
11. Are there any specific market keywords associated with the report?
Yes, the market keyword associated with the report is "MEA Paper Cups Industry," which aids in identifying and referencing the specific market segment covered.
12. How do I determine which pricing option suits my needs best?
The pricing options vary based on user requirements and access needs. Individual users may opt for single-user licenses, while businesses requiring broader access may choose multi-user or enterprise licenses for cost-effective access to the report.
13. Are there any additional resources or data provided in the MEA Paper Cups Industry report?
While the report offers comprehensive insights, it's advisable to review the specific contents or supplementary materials provided to ascertain if additional resources or data are available.
14. How can I stay updated on further developments or reports in the MEA Paper Cups Industry?
To stay informed about further developments, trends, and reports in the MEA Paper Cups Industry, consider subscribing to industry newsletters, following relevant companies and organizations, or regularly checking reputable industry news sources and publications.
Methodology
Step 1 - Identification of Relevant Samples Size from Population Database


Step 2 - Approaches for Defining Global Market Size (Value, Volume* & Price*)

Note*: In applicable scenarios
Step 3 - Data Sources
Primary Research
- Web Analytics
- Survey Reports
- Research Institute
- Latest Research Reports
- Opinion Leaders
Secondary Research
- Annual Reports
- White Paper
- Latest Press Release
- Industry Association
- Paid Database
- Investor Presentations

Step 4 - Data Triangulation
Involves using different sources of information in order to increase the validity of a study
These sources are likely to be stakeholders in a program - participants, other researchers, program staff, other community members, and so on.
Then we put all data in single framework & apply various statistical tools to find out the dynamic on the market.
During the analysis stage, feedback from the stakeholder groups would be compared to determine areas of agreement as well as areas of divergence