

Key Insights
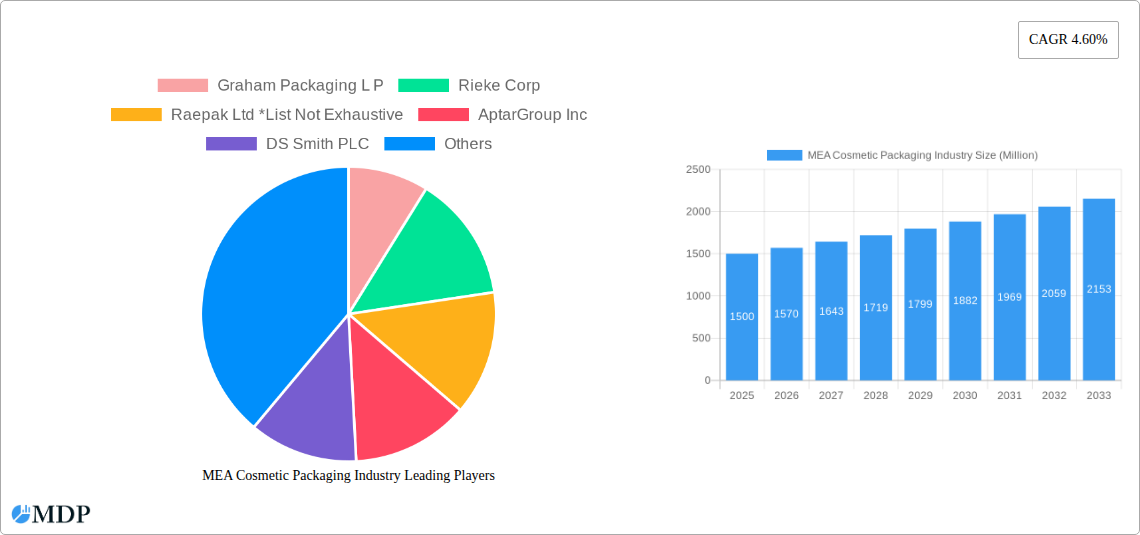
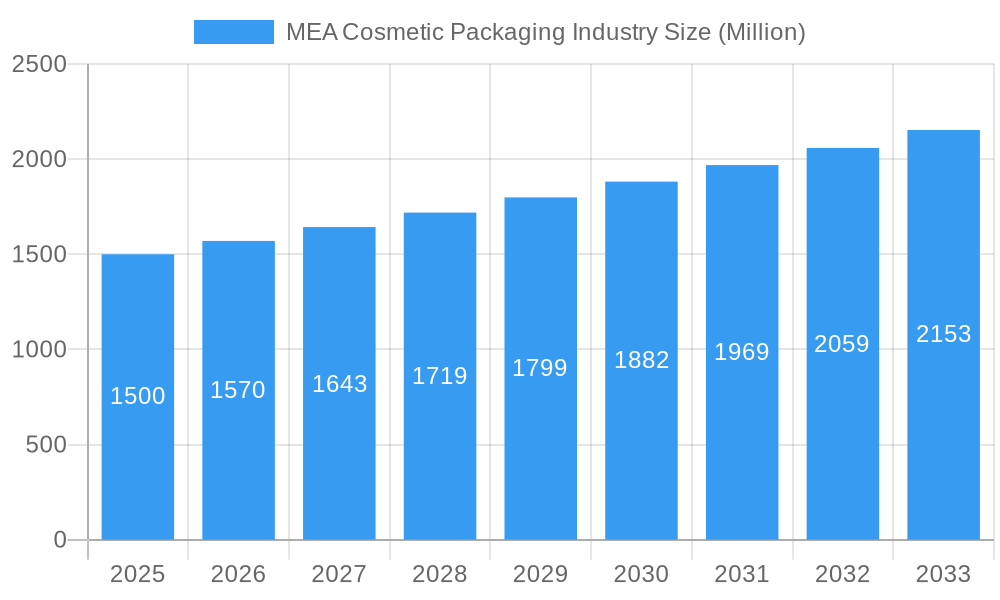
The Middle East and Africa (MEA) cosmetic packaging market is poised for significant expansion, propelled by a thriving cosmetics sector and escalating consumer expenditure on beauty and personal care. The market size is projected to reach $2.1 billion by 2025, with a projected Compound Annual Growth Rate (CAGR) of 5.05%. Key growth catalysts include the increasing demand for premium and luxury cosmetic offerings, a growing middle class with enhanced disposable income, and the expanding e-commerce landscape that broadens product accessibility. Dominant trends encompass a strong preference for sustainable and eco-friendly packaging solutions, a rising demand for innovative and convenient packaging formats such as pump dispensers and droppers, and a notable shift towards personalized and customized packaging options. Despite challenges like volatile raw material costs and stringent regulatory compliance, the market exhibits a robust positive outlook. Plastics remain the leading material, followed by glass and metal, due to their cost-effectiveness and versatility. Plastic bottles and containers command the largest market share within product types, while skincare and haircare segments are primary drivers of packaging demand. The competitive environment features both global industry leaders and regional manufacturers, vying on quality, innovation, and pricing. Although fragmented, the market is anticipated to undergo consolidation as larger entities acquire smaller companies to broaden their market reach.
MEA Cosmetic Packaging Industry Market Size (In Billion)
The forecast period from 2025 to 2033 anticipates sustained market growth, potentially at a slightly tempered CAGR compared to historical trends, influenced by possible market saturation in specific segments and economic fluctuations. Nevertheless, emerging markets within the MEA region, coupled with continuous product innovation and the widespread adoption of sustainable packaging practices, will continue to foster market expansion. Regional market share is expected to remain concentrated in the UAE and Saudi Arabia, owing to their established economies and higher per capita incomes, with South Africa and other developing economies gradually increasing their contributions. Future success for companies will depend on their agility in adapting to evolving consumer preferences, regulatory mandates, and technological advancements in the packaging industry. The persistent development of innovative packaging solutions that integrate sustainability principles will be vital for establishing a competitive advantage and capitalizing on the long-term growth opportunities within the MEA cosmetic packaging market.
MEA Cosmetic Packaging Industry Company Market Share
MEA Cosmetic Packaging Industry: A Comprehensive Market Report (2019-2033)
This comprehensive report provides an in-depth analysis of the Middle East and Africa (MEA) cosmetic packaging industry, offering invaluable insights for stakeholders seeking to navigate this dynamic market. Covering the period 2019-2033, with a focus year of 2025, this report unveils key trends, growth drivers, challenges, and opportunities shaping the future of cosmetic packaging in the MEA region. The market is projected to reach xx Million by 2033, showcasing substantial growth potential.
MEA Cosmetic Packaging Industry Market Dynamics & Concentration
The MEA cosmetic packaging market exhibits a moderately concentrated landscape, with key players like AptarGroup Inc, DS Smith PLC, and Amcor PLC holding significant market share. However, the presence of numerous smaller regional players indicates opportunities for both consolidation and niche market penetration. Market concentration is estimated at xx% in 2025, with a projected xx% change by 2033.
- Innovation Drivers: Sustainable packaging solutions (e.g., biodegradable materials), personalized packaging, and advanced dispensing technologies are key innovation drivers.
- Regulatory Frameworks: Stringent regulations regarding material safety and environmental compliance are shaping packaging choices. The impact of these regulations is estimated to influence xx Million in packaging costs annually.
- Product Substitutes: The emergence of refillable and reusable packaging presents a significant challenge to traditional single-use packaging. This is predicted to reduce demand for single-use plastic packaging by xx% by 2033.
- End-User Trends: Increasing demand for premium and luxury cosmetics drives the adoption of high-quality packaging materials like glass and metal. E-commerce growth is also fuelling demand for protective and convenient packaging solutions.
- M&A Activities: The number of M&A deals in the MEA cosmetic packaging sector has increased in recent years, with xx deals recorded between 2019 and 2024, indicating a trend towards industry consolidation.
MEA Cosmetic Packaging Industry Industry Trends & Analysis
The MEA cosmetic packaging market is experiencing robust growth, driven by factors like rising disposable incomes, increasing urbanization, and a growing preference for personal care products. The market recorded a CAGR of xx% during 2019-2024 and is projected to maintain a CAGR of xx% between 2025 and 2033. Technological advancements, particularly in sustainable and smart packaging, are significantly influencing market dynamics. Consumer preferences towards eco-friendly and convenient packaging are pushing manufacturers to adopt innovative and sustainable solutions. Competitive dynamics are intensifying, with players focusing on differentiation through product innovation, branding, and strategic partnerships. Market penetration of sustainable packaging is expected to reach xx% by 2033.
Leading Markets & Segments in MEA Cosmetic Packaging Industry
The United Arab Emirates (UAE) and Saudi Arabia represent the leading markets in the MEA region, driven by high per capita consumption of cosmetic products and a strong focus on luxury brands. South Africa also presents a significant market opportunity due to its large population and growing middle class.
Key Drivers:
- UAE & Saudi Arabia: High disposable incomes, burgeoning tourism sector, and significant investments in the beauty and personal care industry.
- South Africa: Large population base, rising disposable incomes among the middle class, and growing awareness of personal care products.
- Rest of MEA: Expanding middle class, increasing urbanization, and growing consumer demand for cosmetics drive growth in this segment.
Dominant Segments:
- Material Type: Plastic remains the dominant material type due to its cost-effectiveness and versatility, followed by glass for premium products.
- Product Type: Plastic bottles and containers hold the largest market share, followed by glass bottles and containers and folding cartons.
- Cosmetic Type: Skin care and color cosmetics constitute the leading segments due to their higher consumption rates.
MEA Cosmetic Packaging Industry Product Developments
Recent product innovations focus on sustainable materials like recycled plastics and bioplastics, along with smart packaging incorporating features such as QR codes for product information and authentication. These innovations cater to the rising consumer demand for eco-friendly and convenient packaging solutions, enhancing brand image and improving consumer experience. The market is also witnessing increasing adoption of lightweight packaging for reducing transport costs and carbon footprint.
Key Drivers of MEA Cosmetic Packaging Industry Growth
Several factors contribute to the growth of the MEA cosmetic packaging industry. These include the rising disposable incomes in the region driving increased consumer spending on cosmetics. Additionally, the increasing popularity of e-commerce further boosts demand for protective and visually appealing packaging. Government initiatives to promote sustainable practices within the industry also play a critical role. Technological advancements in materials science and packaging technologies continue to push innovation and efficiency.
Challenges in the MEA Cosmetic Packaging Industry Market
Significant challenges include fluctuating raw material prices, impacting production costs and profitability. The increasing regulatory pressure on material safety and environmental sustainability can also lead to compliance costs. Moreover, intense competition among established players and new entrants puts pressure on profit margins and requires constant innovation. Supply chain disruptions due to geopolitical factors also pose considerable risks.
Emerging Opportunities in MEA Cosmetic Packaging Industry
The MEA cosmetic packaging market presents exciting opportunities for long-term growth. The increasing adoption of e-commerce is creating a demand for innovative and protective packaging solutions. The growing demand for sustainable and eco-friendly packaging provides opportunities for companies offering innovative and sustainable solutions. Further expansion into untapped markets within the MEA region will also boost growth.
Leading Players in the MEA Cosmetic Packaging Industry Sector
- Graham Packaging L P
- Rieke Corp
- Raepak Ltd
- AptarGroup Inc
- DS Smith PLC
- Amcor PLC
- Cosmopak Ltd
- Albea SA
- RPC Group PLC (Berry Global Group)
- Silgan Holdings Inc
- Gerresheimer AG
Key Milestones in MEA Cosmetic Packaging Industry Industry
- 2020: Introduction of stricter regulations on plastic usage in several MEA countries.
- 2021: Launch of several eco-friendly packaging solutions by major players in the market.
- 2022: Significant increase in M&A activity within the industry.
- 2023: Growing adoption of sustainable packaging materials across different cosmetic segments.
Strategic Outlook for MEA Cosmetic Packaging Industry Market
The future of the MEA cosmetic packaging market is bright, fueled by consistent economic growth, rising consumer demand, and increasing investments in the beauty and personal care sector. Strategic partnerships, focusing on innovation and sustainability, will be key to success. Companies that embrace environmentally friendly solutions and adapt to evolving consumer preferences will gain a competitive advantage in this rapidly expanding market. The market is expected to show strong growth in the forecast period due to favorable demographic factors and increased focus on personal care and beauty in the MEA region.
MEA Cosmetic Packaging Industry Segmentation
-
1. Material type
- 1.1. Plastic
- 1.2. Glass
- 1.3. Metal
- 1.4. Paper
-
2. Product Type
- 2.1. Plastic Bottles and Containers
- 2.2. Glass Bottles and Containers
- 2.3. Metal Containers
- 2.4. Folding Cartons
- 2.5. Corrugated Boxes
- 2.6. Tubes and Sticks
- 2.7. Caps and Closures
- 2.8. Pump and Dispenser
- 2.9. Droppers
- 2.10. Ampoules
- 2.11. Flexible Plastic Packaging
-
3. Cosmetic Type
- 3.1. Hair Care
- 3.2. Color Cosmetics
- 3.3. Skin Care
- 3.4. Men's Grooming
- 3.5. Deodorants
- 3.6. Other Co
MEA Cosmetic Packaging Industry Segmentation By Geography
-
1. North America
- 1.1. United States
- 1.2. Canada
- 1.3. Mexico
-
2. South America
- 2.1. Brazil
- 2.2. Argentina
- 2.3. Rest of South America
-
3. Europe
- 3.1. United Kingdom
- 3.2. Germany
- 3.3. France
- 3.4. Italy
- 3.5. Spain
- 3.6. Russia
- 3.7. Benelux
- 3.8. Nordics
- 3.9. Rest of Europe
-
4. Middle East & Africa
- 4.1. Turkey
- 4.2. Israel
- 4.3. GCC
- 4.4. North Africa
- 4.5. South Africa
- 4.6. Rest of Middle East & Africa
-
5. Asia Pacific
- 5.1. China
- 5.2. India
- 5.3. Japan
- 5.4. South Korea
- 5.5. ASEAN
- 5.6. Oceania
- 5.7. Rest of Asia Pacific
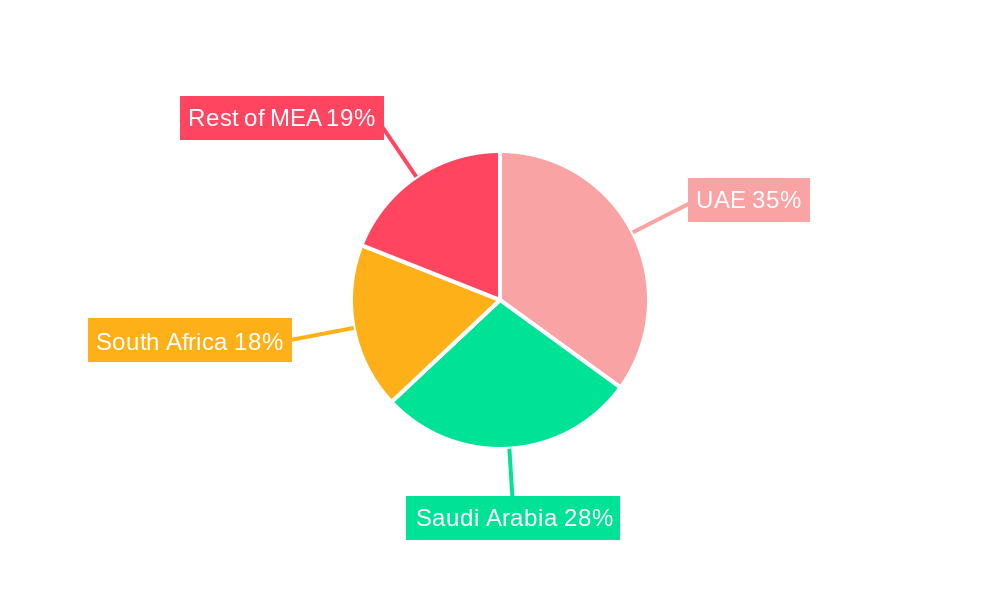
MEA Cosmetic Packaging Industry Regional Market Share
Geographic Coverage of MEA Cosmetic Packaging Industry
MEA Cosmetic Packaging Industry REPORT HIGHLIGHTS
| Aspects | Details |
|---|---|
| Study Period | 2020-2034 |
| Base Year | 2025 |
| Estimated Year | 2026 |
| Forecast Period | 2026-2034 |
| Historical Period | 2020-2025 |
| Growth Rate | CAGR of 5.05% from 2020-2034 |
| Segmentation |
|
Table of Contents
- 1. Introduction
- 1.1. Research Scope
- 1.2. Market Segmentation
- 1.3. Research Objective
- 1.4. Definitions and Assumptions
- 2. Executive Summary
- 2.1. Market Snapshot
- 3. Market Dynamics
- 3.1. Market Drivers
- 3.2. Market Restrains
- 3.3. Market Trends
- 3.4. Market Opportunities
- 4. Market Factor Analysis
- 4.1. Porters Five Forces
- 4.1.1. Bargaining Power of Suppliers
- 4.1.2. Bargaining Power of Buyers
- 4.1.3. Threat of New Entrants
- 4.1.4. Threat of Substitutes
- 4.1.5. Competitive Rivalry
- 4.2. PESTEL analysis
- 4.3. BCG Analysis
- 4.3.1. Stars (High Growth, High Market Share)
- 4.3.2. Cash Cows (Low Growth, High Market Share)
- 4.3.3. Question Mark (High Growth, Low Market Share)
- 4.3.4. Dogs (Low Growth, Low Market Share)
- 4.4. Ansoff Matrix Analysis
- 4.5. Supply Chain Analysis
- 4.6. Regulatory Landscape
- 4.7. Current Market Potential and Opportunity Assessment (TAM–SAM–SOM Framework)
- 4.8. MDP Analyst Note
- 4.1. Porters Five Forces
- 5. Market Analysis, Insights and Forecast 2021-2033
- 5.1. Market Analysis, Insights and Forecast - by Material type
- 5.1.1. Plastic
- 5.1.2. Glass
- 5.1.3. Metal
- 5.1.4. Paper
- 5.2. Market Analysis, Insights and Forecast - by Product Type
- 5.2.1. Plastic Bottles and Containers
- 5.2.2. Glass Bottles and Containers
- 5.2.3. Metal Containers
- 5.2.4. Folding Cartons
- 5.2.5. Corrugated Boxes
- 5.2.6. Tubes and Sticks
- 5.2.7. Caps and Closures
- 5.2.8. Pump and Dispenser
- 5.2.9. Droppers
- 5.2.10. Ampoules
- 5.2.11. Flexible Plastic Packaging
- 5.3. Market Analysis, Insights and Forecast - by Cosmetic Type
- 5.3.1. Hair Care
- 5.3.2. Color Cosmetics
- 5.3.3. Skin Care
- 5.3.4. Men's Grooming
- 5.3.5. Deodorants
- 5.3.6. Other Co
- 5.4. Market Analysis, Insights and Forecast - by Region
- 5.4.1. North America
- 5.4.2. South America
- 5.4.3. Europe
- 5.4.4. Middle East & Africa
- 5.4.5. Asia Pacific
- 5.1. Market Analysis, Insights and Forecast - by Material type
- 6. Global MEA Cosmetic Packaging Industry Analysis, Insights and Forecast, 2021-2033
- 6.1. Market Analysis, Insights and Forecast - by Material type
- 6.1.1. Plastic
- 6.1.2. Glass
- 6.1.3. Metal
- 6.1.4. Paper
- 6.2. Market Analysis, Insights and Forecast - by Product Type
- 6.2.1. Plastic Bottles and Containers
- 6.2.2. Glass Bottles and Containers
- 6.2.3. Metal Containers
- 6.2.4. Folding Cartons
- 6.2.5. Corrugated Boxes
- 6.2.6. Tubes and Sticks
- 6.2.7. Caps and Closures
- 6.2.8. Pump and Dispenser
- 6.2.9. Droppers
- 6.2.10. Ampoules
- 6.2.11. Flexible Plastic Packaging
- 6.3. Market Analysis, Insights and Forecast - by Cosmetic Type
- 6.3.1. Hair Care
- 6.3.2. Color Cosmetics
- 6.3.3. Skin Care
- 6.3.4. Men's Grooming
- 6.3.5. Deodorants
- 6.3.6. Other Co
- 6.1. Market Analysis, Insights and Forecast - by Material type
- 7. North America MEA Cosmetic Packaging Industry Analysis, Insights and Forecast, 2020-2032
- 7.1. Market Analysis, Insights and Forecast - by Material type
- 7.1.1. Plastic
- 7.1.2. Glass
- 7.1.3. Metal
- 7.1.4. Paper
- 7.2. Market Analysis, Insights and Forecast - by Product Type
- 7.2.1. Plastic Bottles and Containers
- 7.2.2. Glass Bottles and Containers
- 7.2.3. Metal Containers
- 7.2.4. Folding Cartons
- 7.2.5. Corrugated Boxes
- 7.2.6. Tubes and Sticks
- 7.2.7. Caps and Closures
- 7.2.8. Pump and Dispenser
- 7.2.9. Droppers
- 7.2.10. Ampoules
- 7.2.11. Flexible Plastic Packaging
- 7.3. Market Analysis, Insights and Forecast - by Cosmetic Type
- 7.3.1. Hair Care
- 7.3.2. Color Cosmetics
- 7.3.3. Skin Care
- 7.3.4. Men's Grooming
- 7.3.5. Deodorants
- 7.3.6. Other Co
- 7.1. Market Analysis, Insights and Forecast - by Material type
- 8. South America MEA Cosmetic Packaging Industry Analysis, Insights and Forecast, 2020-2032
- 8.1. Market Analysis, Insights and Forecast - by Material type
- 8.1.1. Plastic
- 8.1.2. Glass
- 8.1.3. Metal
- 8.1.4. Paper
- 8.2. Market Analysis, Insights and Forecast - by Product Type
- 8.2.1. Plastic Bottles and Containers
- 8.2.2. Glass Bottles and Containers
- 8.2.3. Metal Containers
- 8.2.4. Folding Cartons
- 8.2.5. Corrugated Boxes
- 8.2.6. Tubes and Sticks
- 8.2.7. Caps and Closures
- 8.2.8. Pump and Dispenser
- 8.2.9. Droppers
- 8.2.10. Ampoules
- 8.2.11. Flexible Plastic Packaging
- 8.3. Market Analysis, Insights and Forecast - by Cosmetic Type
- 8.3.1. Hair Care
- 8.3.2. Color Cosmetics
- 8.3.3. Skin Care
- 8.3.4. Men's Grooming
- 8.3.5. Deodorants
- 8.3.6. Other Co
- 8.1. Market Analysis, Insights and Forecast - by Material type
- 9. Europe MEA Cosmetic Packaging Industry Analysis, Insights and Forecast, 2020-2032
- 9.1. Market Analysis, Insights and Forecast - by Material type
- 9.1.1. Plastic
- 9.1.2. Glass
- 9.1.3. Metal
- 9.1.4. Paper
- 9.2. Market Analysis, Insights and Forecast - by Product Type
- 9.2.1. Plastic Bottles and Containers
- 9.2.2. Glass Bottles and Containers
- 9.2.3. Metal Containers
- 9.2.4. Folding Cartons
- 9.2.5. Corrugated Boxes
- 9.2.6. Tubes and Sticks
- 9.2.7. Caps and Closures
- 9.2.8. Pump and Dispenser
- 9.2.9. Droppers
- 9.2.10. Ampoules
- 9.2.11. Flexible Plastic Packaging
- 9.3. Market Analysis, Insights and Forecast - by Cosmetic Type
- 9.3.1. Hair Care
- 9.3.2. Color Cosmetics
- 9.3.3. Skin Care
- 9.3.4. Men's Grooming
- 9.3.5. Deodorants
- 9.3.6. Other Co
- 9.1. Market Analysis, Insights and Forecast - by Material type
- 10. Middle East & Africa MEA Cosmetic Packaging Industry Analysis, Insights and Forecast, 2020-2032
- 10.1. Market Analysis, Insights and Forecast - by Material type
- 10.1.1. Plastic
- 10.1.2. Glass
- 10.1.3. Metal
- 10.1.4. Paper
- 10.2. Market Analysis, Insights and Forecast - by Product Type
- 10.2.1. Plastic Bottles and Containers
- 10.2.2. Glass Bottles and Containers
- 10.2.3. Metal Containers
- 10.2.4. Folding Cartons
- 10.2.5. Corrugated Boxes
- 10.2.6. Tubes and Sticks
- 10.2.7. Caps and Closures
- 10.2.8. Pump and Dispenser
- 10.2.9. Droppers
- 10.2.10. Ampoules
- 10.2.11. Flexible Plastic Packaging
- 10.3. Market Analysis, Insights and Forecast - by Cosmetic Type
- 10.3.1. Hair Care
- 10.3.2. Color Cosmetics
- 10.3.3. Skin Care
- 10.3.4. Men's Grooming
- 10.3.5. Deodorants
- 10.3.6. Other Co
- 10.1. Market Analysis, Insights and Forecast - by Material type
- 11. Asia Pacific MEA Cosmetic Packaging Industry Analysis, Insights and Forecast, 2020-2032
- 11.1. Market Analysis, Insights and Forecast - by Material type
- 11.1.1. Plastic
- 11.1.2. Glass
- 11.1.3. Metal
- 11.1.4. Paper
- 11.2. Market Analysis, Insights and Forecast - by Product Type
- 11.2.1. Plastic Bottles and Containers
- 11.2.2. Glass Bottles and Containers
- 11.2.3. Metal Containers
- 11.2.4. Folding Cartons
- 11.2.5. Corrugated Boxes
- 11.2.6. Tubes and Sticks
- 11.2.7. Caps and Closures
- 11.2.8. Pump and Dispenser
- 11.2.9. Droppers
- 11.2.10. Ampoules
- 11.2.11. Flexible Plastic Packaging
- 11.3. Market Analysis, Insights and Forecast - by Cosmetic Type
- 11.3.1. Hair Care
- 11.3.2. Color Cosmetics
- 11.3.3. Skin Care
- 11.3.4. Men's Grooming
- 11.3.5. Deodorants
- 11.3.6. Other Co
- 11.1. Market Analysis, Insights and Forecast - by Material type
- 12. Competitive Analysis
- 12.1. Company Profiles
- 12.1.1 Graham Packaging L P
- 12.1.1.1. Company Overview
- 12.1.1.2. Products
- 12.1.1.3. Company Financials
- 12.1.1.4. SWOT Analysis
- 12.1.2 Rieke Corp
- 12.1.2.1. Company Overview
- 12.1.2.2. Products
- 12.1.2.3. Company Financials
- 12.1.2.4. SWOT Analysis
- 12.1.3 Raepak Ltd *List Not Exhaustive
- 12.1.3.1. Company Overview
- 12.1.3.2. Products
- 12.1.3.3. Company Financials
- 12.1.3.4. SWOT Analysis
- 12.1.4 AptarGroup Inc
- 12.1.4.1. Company Overview
- 12.1.4.2. Products
- 12.1.4.3. Company Financials
- 12.1.4.4. SWOT Analysis
- 12.1.5 DS Smith PLC
- 12.1.5.1. Company Overview
- 12.1.5.2. Products
- 12.1.5.3. Company Financials
- 12.1.5.4. SWOT Analysis
- 12.1.6 Amcor PLC
- 12.1.6.1. Company Overview
- 12.1.6.2. Products
- 12.1.6.3. Company Financials
- 12.1.6.4. SWOT Analysis
- 12.1.7 Cosmopak Ltd
- 12.1.7.1. Company Overview
- 12.1.7.2. Products
- 12.1.7.3. Company Financials
- 12.1.7.4. SWOT Analysis
- 12.1.8 Albea SA
- 12.1.8.1. Company Overview
- 12.1.8.2. Products
- 12.1.8.3. Company Financials
- 12.1.8.4. SWOT Analysis
- 12.1.9 RPC Group PLC (Berry Global Group)
- 12.1.9.1. Company Overview
- 12.1.9.2. Products
- 12.1.9.3. Company Financials
- 12.1.9.4. SWOT Analysis
- 12.1.10 Silgan Holdings Inc
- 12.1.10.1. Company Overview
- 12.1.10.2. Products
- 12.1.10.3. Company Financials
- 12.1.10.4. SWOT Analysis
- 12.1.11 Gerresheimer AG
- 12.1.11.1. Company Overview
- 12.1.11.2. Products
- 12.1.11.3. Company Financials
- 12.1.11.4. SWOT Analysis
- 12.1.1 Graham Packaging L P
- 12.2. Market Entropy
- 12.2.1 Company's Key Areas Served
- 12.2.2 Recent Developments
- 12.3. Company Market Share Analysis 2025
- 12.3.1 Top 5 Companies Market Share Analysis
- 12.3.2 Top 3 Companies Market Share Analysis
- 12.4. List of Potential Customers
- 13. Research Methodology
List of Figures
- Figure 1: Global MEA Cosmetic Packaging Industry Revenue Breakdown (billion, %) by Region 2025 & 2033
- Figure 2: North America MEA Cosmetic Packaging Industry Revenue (billion), by Material type 2025 & 2033
- Figure 3: North America MEA Cosmetic Packaging Industry Revenue Share (%), by Material type 2025 & 2033
- Figure 4: North America MEA Cosmetic Packaging Industry Revenue (billion), by Product Type 2025 & 2033
- Figure 5: North America MEA Cosmetic Packaging Industry Revenue Share (%), by Product Type 2025 & 2033
- Figure 6: North America MEA Cosmetic Packaging Industry Revenue (billion), by Cosmetic Type 2025 & 2033
- Figure 7: North America MEA Cosmetic Packaging Industry Revenue Share (%), by Cosmetic Type 2025 & 2033
- Figure 8: North America MEA Cosmetic Packaging Industry Revenue (billion), by Country 2025 & 2033
- Figure 9: North America MEA Cosmetic Packaging Industry Revenue Share (%), by Country 2025 & 2033
- Figure 10: South America MEA Cosmetic Packaging Industry Revenue (billion), by Material type 2025 & 2033
- Figure 11: South America MEA Cosmetic Packaging Industry Revenue Share (%), by Material type 2025 & 2033
- Figure 12: South America MEA Cosmetic Packaging Industry Revenue (billion), by Product Type 2025 & 2033
- Figure 13: South America MEA Cosmetic Packaging Industry Revenue Share (%), by Product Type 2025 & 2033
- Figure 14: South America MEA Cosmetic Packaging Industry Revenue (billion), by Cosmetic Type 2025 & 2033
- Figure 15: South America MEA Cosmetic Packaging Industry Revenue Share (%), by Cosmetic Type 2025 & 2033
- Figure 16: South America MEA Cosmetic Packaging Industry Revenue (billion), by Country 2025 & 2033
- Figure 17: South America MEA Cosmetic Packaging Industry Revenue Share (%), by Country 2025 & 2033
- Figure 18: Europe MEA Cosmetic Packaging Industry Revenue (billion), by Material type 2025 & 2033
- Figure 19: Europe MEA Cosmetic Packaging Industry Revenue Share (%), by Material type 2025 & 2033
- Figure 20: Europe MEA Cosmetic Packaging Industry Revenue (billion), by Product Type 2025 & 2033
- Figure 21: Europe MEA Cosmetic Packaging Industry Revenue Share (%), by Product Type 2025 & 2033
- Figure 22: Europe MEA Cosmetic Packaging Industry Revenue (billion), by Cosmetic Type 2025 & 2033
- Figure 23: Europe MEA Cosmetic Packaging Industry Revenue Share (%), by Cosmetic Type 2025 & 2033
- Figure 24: Europe MEA Cosmetic Packaging Industry Revenue (billion), by Country 2025 & 2033
- Figure 25: Europe MEA Cosmetic Packaging Industry Revenue Share (%), by Country 2025 & 2033
- Figure 26: Middle East & Africa MEA Cosmetic Packaging Industry Revenue (billion), by Material type 2025 & 2033
- Figure 27: Middle East & Africa MEA Cosmetic Packaging Industry Revenue Share (%), by Material type 2025 & 2033
- Figure 28: Middle East & Africa MEA Cosmetic Packaging Industry Revenue (billion), by Product Type 2025 & 2033
- Figure 29: Middle East & Africa MEA Cosmetic Packaging Industry Revenue Share (%), by Product Type 2025 & 2033
- Figure 30: Middle East & Africa MEA Cosmetic Packaging Industry Revenue (billion), by Cosmetic Type 2025 & 2033
- Figure 31: Middle East & Africa MEA Cosmetic Packaging Industry Revenue Share (%), by Cosmetic Type 2025 & 2033
- Figure 32: Middle East & Africa MEA Cosmetic Packaging Industry Revenue (billion), by Country 2025 & 2033
- Figure 33: Middle East & Africa MEA Cosmetic Packaging Industry Revenue Share (%), by Country 2025 & 2033
- Figure 34: Asia Pacific MEA Cosmetic Packaging Industry Revenue (billion), by Material type 2025 & 2033
- Figure 35: Asia Pacific MEA Cosmetic Packaging Industry Revenue Share (%), by Material type 2025 & 2033
- Figure 36: Asia Pacific MEA Cosmetic Packaging Industry Revenue (billion), by Product Type 2025 & 2033
- Figure 37: Asia Pacific MEA Cosmetic Packaging Industry Revenue Share (%), by Product Type 2025 & 2033
- Figure 38: Asia Pacific MEA Cosmetic Packaging Industry Revenue (billion), by Cosmetic Type 2025 & 2033
- Figure 39: Asia Pacific MEA Cosmetic Packaging Industry Revenue Share (%), by Cosmetic Type 2025 & 2033
- Figure 40: Asia Pacific MEA Cosmetic Packaging Industry Revenue (billion), by Country 2025 & 2033
- Figure 41: Asia Pacific MEA Cosmetic Packaging Industry Revenue Share (%), by Country 2025 & 2033
List of Tables
- Table 1: Global MEA Cosmetic Packaging Industry Revenue billion Forecast, by Material type 2020 & 2033
- Table 2: Global MEA Cosmetic Packaging Industry Revenue billion Forecast, by Product Type 2020 & 2033
- Table 3: Global MEA Cosmetic Packaging Industry Revenue billion Forecast, by Cosmetic Type 2020 & 2033
- Table 4: Global MEA Cosmetic Packaging Industry Revenue billion Forecast, by Region 2020 & 2033
- Table 5: Global MEA Cosmetic Packaging Industry Revenue billion Forecast, by Material type 2020 & 2033
- Table 6: Global MEA Cosmetic Packaging Industry Revenue billion Forecast, by Product Type 2020 & 2033
- Table 7: Global MEA Cosmetic Packaging Industry Revenue billion Forecast, by Cosmetic Type 2020 & 2033
- Table 8: Global MEA Cosmetic Packaging Industry Revenue billion Forecast, by Country 2020 & 2033
- Table 9: United States MEA Cosmetic Packaging Industry Revenue (billion) Forecast, by Application 2020 & 2033
- Table 10: Canada MEA Cosmetic Packaging Industry Revenue (billion) Forecast, by Application 2020 & 2033
- Table 11: Mexico MEA Cosmetic Packaging Industry Revenue (billion) Forecast, by Application 2020 & 2033
- Table 12: Global MEA Cosmetic Packaging Industry Revenue billion Forecast, by Material type 2020 & 2033
- Table 13: Global MEA Cosmetic Packaging Industry Revenue billion Forecast, by Product Type 2020 & 2033
- Table 14: Global MEA Cosmetic Packaging Industry Revenue billion Forecast, by Cosmetic Type 2020 & 2033
- Table 15: Global MEA Cosmetic Packaging Industry Revenue billion Forecast, by Country 2020 & 2033
- Table 16: Brazil MEA Cosmetic Packaging Industry Revenue (billion) Forecast, by Application 2020 & 2033
- Table 17: Argentina MEA Cosmetic Packaging Industry Revenue (billion) Forecast, by Application 2020 & 2033
- Table 18: Rest of South America MEA Cosmetic Packaging Industry Revenue (billion) Forecast, by Application 2020 & 2033
- Table 19: Global MEA Cosmetic Packaging Industry Revenue billion Forecast, by Material type 2020 & 2033
- Table 20: Global MEA Cosmetic Packaging Industry Revenue billion Forecast, by Product Type 2020 & 2033
- Table 21: Global MEA Cosmetic Packaging Industry Revenue billion Forecast, by Cosmetic Type 2020 & 2033
- Table 22: Global MEA Cosmetic Packaging Industry Revenue billion Forecast, by Country 2020 & 2033
- Table 23: United Kingdom MEA Cosmetic Packaging Industry Revenue (billion) Forecast, by Application 2020 & 2033
- Table 24: Germany MEA Cosmetic Packaging Industry Revenue (billion) Forecast, by Application 2020 & 2033
- Table 25: France MEA Cosmetic Packaging Industry Revenue (billion) Forecast, by Application 2020 & 2033
- Table 26: Italy MEA Cosmetic Packaging Industry Revenue (billion) Forecast, by Application 2020 & 2033
- Table 27: Spain MEA Cosmetic Packaging Industry Revenue (billion) Forecast, by Application 2020 & 2033
- Table 28: Russia MEA Cosmetic Packaging Industry Revenue (billion) Forecast, by Application 2020 & 2033
- Table 29: Benelux MEA Cosmetic Packaging Industry Revenue (billion) Forecast, by Application 2020 & 2033
- Table 30: Nordics MEA Cosmetic Packaging Industry Revenue (billion) Forecast, by Application 2020 & 2033
- Table 31: Rest of Europe MEA Cosmetic Packaging Industry Revenue (billion) Forecast, by Application 2020 & 2033
- Table 32: Global MEA Cosmetic Packaging Industry Revenue billion Forecast, by Material type 2020 & 2033
- Table 33: Global MEA Cosmetic Packaging Industry Revenue billion Forecast, by Product Type 2020 & 2033
- Table 34: Global MEA Cosmetic Packaging Industry Revenue billion Forecast, by Cosmetic Type 2020 & 2033
- Table 35: Global MEA Cosmetic Packaging Industry Revenue billion Forecast, by Country 2020 & 2033
- Table 36: Turkey MEA Cosmetic Packaging Industry Revenue (billion) Forecast, by Application 2020 & 2033
- Table 37: Israel MEA Cosmetic Packaging Industry Revenue (billion) Forecast, by Application 2020 & 2033
- Table 38: GCC MEA Cosmetic Packaging Industry Revenue (billion) Forecast, by Application 2020 & 2033
- Table 39: North Africa MEA Cosmetic Packaging Industry Revenue (billion) Forecast, by Application 2020 & 2033
- Table 40: South Africa MEA Cosmetic Packaging Industry Revenue (billion) Forecast, by Application 2020 & 2033
- Table 41: Rest of Middle East & Africa MEA Cosmetic Packaging Industry Revenue (billion) Forecast, by Application 2020 & 2033
- Table 42: Global MEA Cosmetic Packaging Industry Revenue billion Forecast, by Material type 2020 & 2033
- Table 43: Global MEA Cosmetic Packaging Industry Revenue billion Forecast, by Product Type 2020 & 2033
- Table 44: Global MEA Cosmetic Packaging Industry Revenue billion Forecast, by Cosmetic Type 2020 & 2033
- Table 45: Global MEA Cosmetic Packaging Industry Revenue billion Forecast, by Country 2020 & 2033
- Table 46: China MEA Cosmetic Packaging Industry Revenue (billion) Forecast, by Application 2020 & 2033
- Table 47: India MEA Cosmetic Packaging Industry Revenue (billion) Forecast, by Application 2020 & 2033
- Table 48: Japan MEA Cosmetic Packaging Industry Revenue (billion) Forecast, by Application 2020 & 2033
- Table 49: South Korea MEA Cosmetic Packaging Industry Revenue (billion) Forecast, by Application 2020 & 2033
- Table 50: ASEAN MEA Cosmetic Packaging Industry Revenue (billion) Forecast, by Application 2020 & 2033
- Table 51: Oceania MEA Cosmetic Packaging Industry Revenue (billion) Forecast, by Application 2020 & 2033
- Table 52: Rest of Asia Pacific MEA Cosmetic Packaging Industry Revenue (billion) Forecast, by Application 2020 & 2033
Frequently Asked Questions
1. What is the projected Compound Annual Growth Rate (CAGR) of the MEA Cosmetic Packaging Industry?
The projected CAGR is approximately 5.05%.
2. Which companies are prominent players in the MEA Cosmetic Packaging Industry?
Key companies in the market include Graham Packaging L P, Rieke Corp, Raepak Ltd *List Not Exhaustive, AptarGroup Inc, DS Smith PLC, Amcor PLC, Cosmopak Ltd, Albea SA, RPC Group PLC (Berry Global Group), Silgan Holdings Inc, Gerresheimer AG.
3. What are the main segments of the MEA Cosmetic Packaging Industry?
The market segments include Material type, Product Type, Cosmetic Type.
4. Can you provide details about the market size?
The market size is estimated to be USD 2.1 billion as of 2022.
5. What are some drivers contributing to market growth?
; Increasing Focus on Innovation and Attractive Packaging.
6. What are the notable trends driving market growth?
Sustainable Packaging to Drive the Market Growth.
7. Are there any restraints impacting market growth?
; Growing Sustainability Concerns.
8. Can you provide examples of recent developments in the market?
N/A
9. What pricing options are available for accessing the report?
Pricing options include single-user, multi-user, and enterprise licenses priced at USD 3800, USD 4500, and USD 5800 respectively.
10. Is the market size provided in terms of value or volume?
The market size is provided in terms of value, measured in billion.
11. Are there any specific market keywords associated with the report?
Yes, the market keyword associated with the report is "MEA Cosmetic Packaging Industry," which aids in identifying and referencing the specific market segment covered.
12. How do I determine which pricing option suits my needs best?
The pricing options vary based on user requirements and access needs. Individual users may opt for single-user licenses, while businesses requiring broader access may choose multi-user or enterprise licenses for cost-effective access to the report.
13. Are there any additional resources or data provided in the MEA Cosmetic Packaging Industry report?
While the report offers comprehensive insights, it's advisable to review the specific contents or supplementary materials provided to ascertain if additional resources or data are available.
14. How can I stay updated on further developments or reports in the MEA Cosmetic Packaging Industry?
To stay informed about further developments, trends, and reports in the MEA Cosmetic Packaging Industry, consider subscribing to industry newsletters, following relevant companies and organizations, or regularly checking reputable industry news sources and publications.
Methodology
Step 1 - Identification of Relevant Samples Size from Population Database


Step 2 - Approaches for Defining Global Market Size (Value, Volume* & Price*)

Note*: In applicable scenarios
Step 3 - Data Sources
Primary Research
- Web Analytics
- Survey Reports
- Research Institute
- Latest Research Reports
- Opinion Leaders
Secondary Research
- Annual Reports
- White Paper
- Latest Press Release
- Industry Association
- Paid Database
- Investor Presentations

Step 4 - Data Triangulation
Involves using different sources of information in order to increase the validity of a study
These sources are likely to be stakeholders in a program - participants, other researchers, program staff, other community members, and so on.
Then we put all data in single framework & apply various statistical tools to find out the dynamic on the market.
During the analysis stage, feedback from the stakeholder groups would be compared to determine areas of agreement as well as areas of divergence