

Key Insights
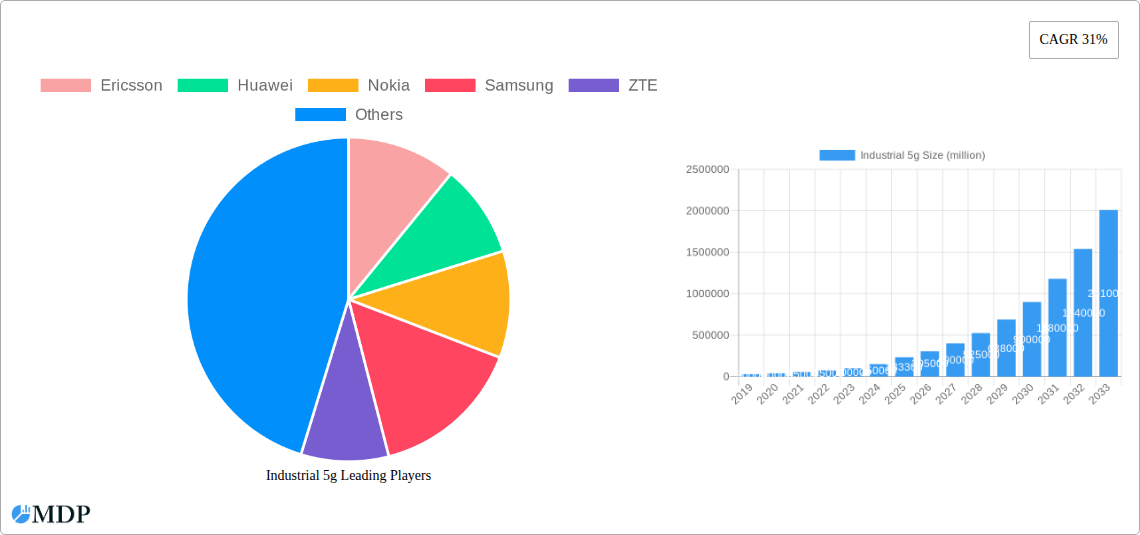
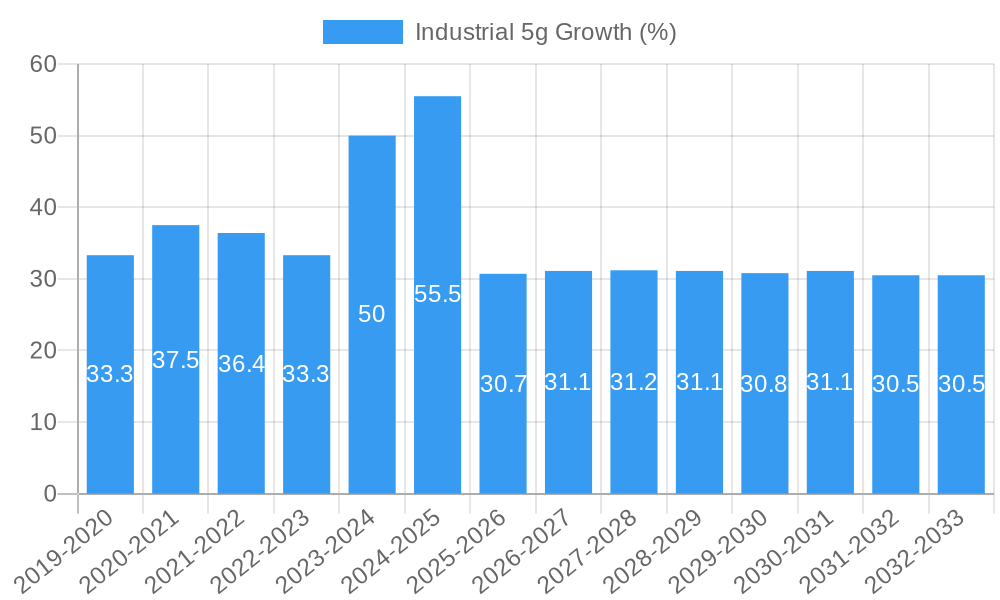
The Industrial 5G market is poised for explosive growth, projected to reach an estimated USD 233,300 million by 2025 and expand at a remarkable Compound Annual Growth Rate (CAGR) of 31% throughout the forecast period of 2025-2033. This significant expansion is primarily driven by the burgeoning demand for enhanced connectivity, ultra-low latency, and massive device support essential for Industry 4.0 transformations. Key drivers include the increasing adoption of smart manufacturing, the proliferation of Industrial Internet of Things (IIoT) devices, and the critical need for real-time data processing and automation in sectors like manufacturing, logistics, and energy. The transition from traditional wired networks to flexible and robust wireless solutions, coupled with the inherent security and reliability offered by 5G technology, further accelerates its integration into industrial environments.
The market's segmentation reveals a strong demand across both Process and Discrete Industries, with a balanced growth trajectory for Hardware, Software, and Service segments. Hardware components, including 5G modems, antennas, and base stations, will see robust demand to build the foundational infrastructure. Simultaneously, the market for specialized 5G software solutions, such as network management platforms, edge computing capabilities, and cybersecurity applications, is set to surge. The Service segment, encompassing deployment, integration, and maintenance, will also experience substantial growth as businesses increasingly rely on expert support to harness the full potential of Industrial 5G. Major global players like Ericsson, Huawei, Nokia, Samsung, and Verizon are at the forefront of this innovation, investing heavily in R&D and strategic partnerships to capture market share across key regions including Asia Pacific, North America, and Europe.
Industrial 5G: Transforming Industries with Next-Generation Connectivity
This comprehensive report delves into the burgeoning Industrial 5G market, offering in-depth analysis, actionable insights, and future projections. Explore the transformative power of 5G technology across various industrial sectors, from manufacturing to logistics, and understand the key players, trends, and opportunities shaping this dynamic landscape. The study covers the period from 2019 to 2033, with a base and estimated year of 2025, and a forecast period from 2025 to 2033, referencing historical data from 2019 to 2024.
Industrial 5G Market Dynamics & Concentration
The Industrial 5G market is characterized by a moderate to high concentration, driven by significant investments and technological advancements from leading telecommunications and technology giants. Innovation is a primary driver, with companies continuously developing new applications and solutions to meet the evolving needs of industries. Key innovation drivers include the demand for real-time data processing, enhanced automation, and the deployment of sophisticated IoT devices. Regulatory frameworks are also playing a crucial role, with governments worldwide establishing policies to facilitate 5G spectrum allocation and deployment, thereby fostering market growth. Product substitutes, while present in the form of existing wired networks and earlier wireless technologies, are increasingly being outpaced by the superior performance and capabilities of 5G. End-user trends indicate a strong adoption rate across both the Process Industry and Discrete Industry sectors, driven by the promise of increased efficiency, reduced downtime, and improved safety. Mergers and acquisitions (M&A) activities are moderately prevalent, with approximately 20-30 major M&A deals recorded globally during the historical period, as companies strategically consolidate to expand their offerings and market reach. Key market share players are emerging, with major vendors like Ericsson, Huawei, and Nokia holding significant portions of the early market, estimated to be between 15-25% each.
Industrial 5G Industry Trends & Analysis
The Industrial 5G industry is witnessing a period of rapid expansion and technological evolution, driven by several key growth catalysts. The escalating demand for enhanced operational efficiency and productivity across manufacturing, logistics, and energy sectors is a primary growth driver. Companies are investing heavily in 5G solutions to enable advanced automation, predictive maintenance, and real-time monitoring, leading to significant cost savings and improved output. Technological disruptions are at the forefront, with 5G’s ultra-low latency, massive bandwidth, and device connectivity capabilities unlocking new possibilities for Industry 4.0 applications such as augmented reality (AR) for remote assistance, autonomous guided vehicles (AGVs), and digital twins. Consumer preferences are indirectly influencing industrial adoption as well; the demand for more personalized and efficiently produced goods pushes industries to adopt more sophisticated technologies. The competitive landscape is intensifying, with a blend of established telecommunications giants and specialized industrial technology providers vying for market dominance. Market penetration is still in its nascent stages, with an estimated global penetration rate of approximately 5-10% in 2025, projected to grow at a Compound Annual Growth Rate (CAGR) of 25-30% during the forecast period of 2025-2033. This robust growth is fueled by pilot projects transitioning into full-scale deployments and the increasing availability of 5G-enabled industrial equipment and services. The focus on data-driven decision-making and the need for seamless connectivity for vast networks of sensors and machines are further propelling the adoption of Industrial 5G.
Leading Markets & Segments in Industrial 5G
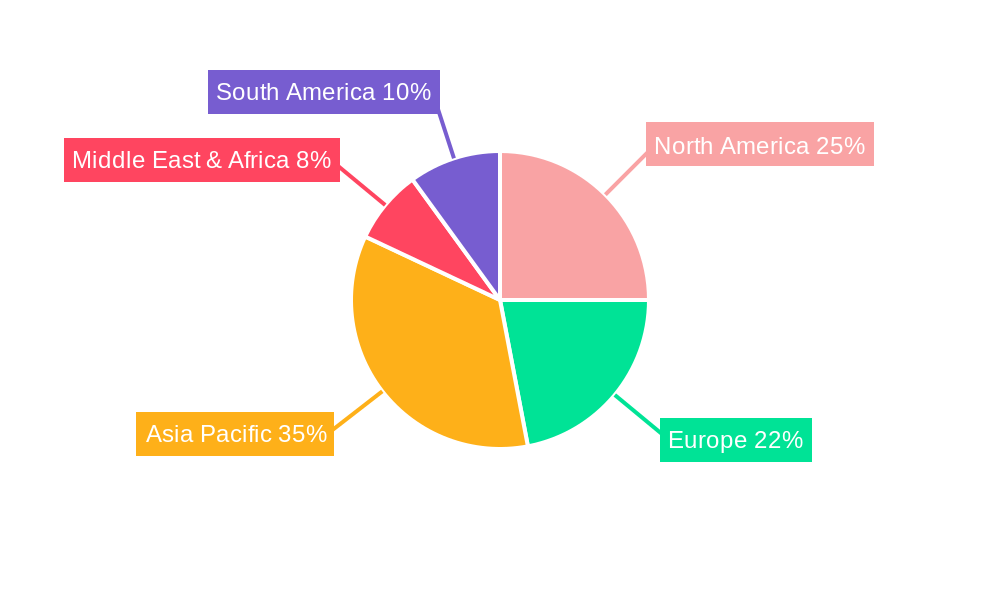
The dominance in the Industrial 5G market is currently observed in the Discrete Industry segment, particularly within the automotive and electronics manufacturing sub-sectors. The rapid adoption of smart factories, robotics, and automated production lines in these areas necessitates the high-speed, low-latency, and massive connectivity that 5G provides. Key drivers for this dominance include substantial economic policies promoting digital transformation and significant government investments in smart manufacturing infrastructure. Geographically, Asia-Pacific, led by China, stands out as a leading market, driven by its strong manufacturing base and aggressive deployment of 5G networks by companies like China Mobile, China Telecom, and China Unicom.
- Application Dominance:
- Discrete Industry: This segment is leading due to its inherent need for high-bandwidth, real-time communication for robotics, AGVs, and sophisticated automation.
- Process Industry: While currently trailing Discrete Industry, the Process Industry (e.g., oil & gas, chemicals) is rapidly embracing 5G for remote monitoring, predictive maintenance, and enhanced safety protocols.
- Type Dominance:
- Hardware: The demand for 5G-enabled devices, sensors, and network infrastructure components is currently the highest, driving initial market growth.
- Software: As deployments mature, the demand for AI-powered analytics platforms, edge computing solutions, and network management software is expected to surge.
- Service: Consulting, integration, and managed services are becoming increasingly critical as companies navigate the complexities of 5G deployment and operation.
- Regional Dominance:
- Asia-Pacific: Fueled by government initiatives and a robust manufacturing ecosystem, this region is at the forefront of Industrial 5G adoption. Countries like China and South Korea are leading the charge.
- North America: Driven by innovation in manufacturing and the presence of major telecommunication providers like Verizon and AT&T, this region is a significant growth market.
- Europe: With a strong industrial base and supportive regulatory frameworks, Europe is steadily increasing its Industrial 5G footprint, with companies like Vodafone Group and BT playing key roles.
Industrial 5G Product Developments
Recent product developments in Industrial 5G are focused on delivering specialized solutions that cater to the unique demands of industrial environments. Innovations include ruggedized 5G modems for harsh conditions, low-latency edge computing platforms for real-time data processing, and integrated software solutions that enable seamless device management and data analytics. Companies are also developing private 5G network solutions, offering dedicated and secure connectivity for industrial campuses. These advancements provide significant competitive advantages by enhancing operational efficiency, enabling greater automation, and improving data security and reliability. The market fit for these products is strong, addressing critical needs for real-time control, predictive maintenance, and the efficient operation of large-scale IoT deployments.
Key Drivers of Industrial 5G Growth
The growth of the Industrial 5G market is propelled by a confluence of technological advancements, economic imperatives, and supportive regulatory environments. The increasing need for enhanced operational efficiency and productivity across various industrial sectors is a paramount driver, as businesses seek to optimize processes and reduce costs. Technologically, the inherent capabilities of 5G, such as ultra-low latency, massive bandwidth, and enhanced reliability, are critical enablers for Industry 4.0 applications, including advanced robotics, autonomous systems, and the Internet of Things (IoT). Economically, the pursuit of digital transformation and the drive for competitive advantage in global markets are compelling industries to invest in next-generation connectivity. Furthermore, government initiatives and spectrum availability are crucial for facilitating widespread adoption and deployment.
Challenges in the Industrial 5G Market
Despite its immense potential, the Industrial 5G market faces several significant challenges that can impede widespread adoption. Regulatory hurdles, including spectrum allocation complexities and varying national policies, can create fragmentation and delays in deployment. The high cost of infrastructure deployment and the need for specialized 5G equipment present a substantial financial barrier for many businesses. Supply chain issues for critical 5G components can also lead to extended lead times and increased project costs. Furthermore, the integration of new 5G networks with existing legacy systems often requires complex and costly upgrades, posing a significant technical challenge. Competitive pressures from established wired and wireless solutions also demand continuous innovation and compelling value propositions.
Emerging Opportunities in Industrial 5G
Several catalysts are driving long-term growth and unlocking new opportunities within the Industrial 5G market. Technological breakthroughs in areas like AI-driven analytics, advanced robotics, and the development of more sophisticated IoT devices are creating new use cases for 5G connectivity. Strategic partnerships between telecommunications providers, technology companies, and industrial firms are crucial for co-creating tailored solutions and accelerating market penetration. The expansion of 5G into underserved industrial sectors, such as agriculture and smart city infrastructure, presents a significant untapped market potential. The development of specialized industrial 5G applications for niche markets, like remote healthcare monitoring in industrial settings or precision agriculture, will also foster sustained growth.
Leading Players in the Industrial 5G Sector
- Ericsson
- Huawei
- Nokia
- Samsung
- ZTE
- China Mobile
- China Telecom
- China Unicom
- Verizon
- AT&T
- Vodafone Group
- SK Telecom
- NTT
- KT Corporation
- Cisco
- Siemens
- BT
- Microsoft
- Fujitsu
- NEC
Key Milestones in Industrial 5G Industry
- 2019/Q4: Early pilot deployments of private 5G networks for industrial use cases begin to surface, showcasing potential.
- 2020/Q2: First commercial 5G-enabled industrial solutions for automation and robotics are launched by key vendors.
- 2021/Q1: Regulatory bodies begin prioritizing spectrum allocation for industrial 5G applications.
- 2022/Q3: Major telecommunication operators announce dedicated industrial 5G strategies and partnerships.
- 2023/Q4: Increased adoption of 5G in smart factory initiatives and IIoT (Industrial Internet of Things) deployments.
- 2024/Q2: Significant investments in edge computing infrastructure to support real-time 5G applications in industries.
Strategic Outlook for Industrial 5G Market
The strategic outlook for the Industrial 5G market is exceptionally positive, with growth accelerators pointing towards widespread adoption and transformative impact. The increasing demand for hyper-connectivity, real-time data, and advanced automation will continue to drive investment in 5G infrastructure and applications. Strategic opportunities lie in developing integrated solutions that combine 5G with AI, edge computing, and IoT to create truly intelligent industrial environments. Companies focusing on niche industrial segments and offering customized private 5G network solutions are poised for significant growth. The ongoing evolution of 5G technology, with advancements like 5G-Advanced, will unlock even more sophisticated use cases, further solidifying its position as the backbone of future industrial operations.
Industrial 5g Segmentation
-
1. Application
- 1.1. Process Industry
- 1.2. Discrete Industry
-
2. Type
- 2.1. Hardware
- 2.2. Software
- 2.3. Service
Industrial 5g Segmentation By Geography
-
1. North America
- 1.1. United States
- 1.2. Canada
- 1.3. Mexico
-
2. South America
- 2.1. Brazil
- 2.2. Argentina
- 2.3. Rest of South America
-
3. Europe
- 3.1. United Kingdom
- 3.2. Germany
- 3.3. France
- 3.4. Italy
- 3.5. Spain
- 3.6. Russia
- 3.7. Benelux
- 3.8. Nordics
- 3.9. Rest of Europe
-
4. Middle East & Africa
- 4.1. Turkey
- 4.2. Israel
- 4.3. GCC
- 4.4. North Africa
- 4.5. South Africa
- 4.6. Rest of Middle East & Africa
-
5. Asia Pacific
- 5.1. China
- 5.2. India
- 5.3. Japan
- 5.4. South Korea
- 5.5. ASEAN
- 5.6. Oceania
- 5.7. Rest of Asia Pacific
Industrial 5g REPORT HIGHLIGHTS
| Aspects | Details |
|---|---|
| Study Period | 2019-2033 |
| Base Year | 2024 |
| Estimated Year | 2025 |
| Forecast Period | 2025-2033 |
| Historical Period | 2019-2024 |
| Growth Rate | CAGR of 31% from 2019-2033 |
| Segmentation |
|
Table of Contents
- 1. Introduction
- 1.1. Research Scope
- 1.2. Market Segmentation
- 1.3. Research Methodology
- 1.4. Definitions and Assumptions
- 2. Executive Summary
- 2.1. Introduction
- 3. Market Dynamics
- 3.1. Introduction
- 3.2. Market Drivers
- 3.3. Market Restrains
- 3.4. Market Trends
- 4. Market Factor Analysis
- 4.1. Porters Five Forces
- 4.2. Supply/Value Chain
- 4.3. PESTEL analysis
- 4.4. Market Entropy
- 4.5. Patent/Trademark Analysis
- 5. Global Industrial 5g Analysis, Insights and Forecast, 2019-2031
- 5.1. Market Analysis, Insights and Forecast - by Application
- 5.1.1. Process Industry
- 5.1.2. Discrete Industry
- 5.2. Market Analysis, Insights and Forecast - by Type
- 5.2.1. Hardware
- 5.2.2. Software
- 5.2.3. Service
- 5.3. Market Analysis, Insights and Forecast - by Region
- 5.3.1. North America
- 5.3.2. South America
- 5.3.3. Europe
- 5.3.4. Middle East & Africa
- 5.3.5. Asia Pacific
- 5.1. Market Analysis, Insights and Forecast - by Application
- 6. North America Industrial 5g Analysis, Insights and Forecast, 2019-2031
- 6.1. Market Analysis, Insights and Forecast - by Application
- 6.1.1. Process Industry
- 6.1.2. Discrete Industry
- 6.2. Market Analysis, Insights and Forecast - by Type
- 6.2.1. Hardware
- 6.2.2. Software
- 6.2.3. Service
- 6.1. Market Analysis, Insights and Forecast - by Application
- 7. South America Industrial 5g Analysis, Insights and Forecast, 2019-2031
- 7.1. Market Analysis, Insights and Forecast - by Application
- 7.1.1. Process Industry
- 7.1.2. Discrete Industry
- 7.2. Market Analysis, Insights and Forecast - by Type
- 7.2.1. Hardware
- 7.2.2. Software
- 7.2.3. Service
- 7.1. Market Analysis, Insights and Forecast - by Application
- 8. Europe Industrial 5g Analysis, Insights and Forecast, 2019-2031
- 8.1. Market Analysis, Insights and Forecast - by Application
- 8.1.1. Process Industry
- 8.1.2. Discrete Industry
- 8.2. Market Analysis, Insights and Forecast - by Type
- 8.2.1. Hardware
- 8.2.2. Software
- 8.2.3. Service
- 8.1. Market Analysis, Insights and Forecast - by Application
- 9. Middle East & Africa Industrial 5g Analysis, Insights and Forecast, 2019-2031
- 9.1. Market Analysis, Insights and Forecast - by Application
- 9.1.1. Process Industry
- 9.1.2. Discrete Industry
- 9.2. Market Analysis, Insights and Forecast - by Type
- 9.2.1. Hardware
- 9.2.2. Software
- 9.2.3. Service
- 9.1. Market Analysis, Insights and Forecast - by Application
- 10. Asia Pacific Industrial 5g Analysis, Insights and Forecast, 2019-2031
- 10.1. Market Analysis, Insights and Forecast - by Application
- 10.1.1. Process Industry
- 10.1.2. Discrete Industry
- 10.2. Market Analysis, Insights and Forecast - by Type
- 10.2.1. Hardware
- 10.2.2. Software
- 10.2.3. Service
- 10.1. Market Analysis, Insights and Forecast - by Application
- 11. Competitive Analysis
- 11.1. Global Market Share Analysis 2024
- 11.2. Company Profiles
- 11.2.1 Ericsson
- 11.2.1.1. Overview
- 11.2.1.2. Products
- 11.2.1.3. SWOT Analysis
- 11.2.1.4. Recent Developments
- 11.2.1.5. Financials (Based on Availability)
- 11.2.2 Huawei
- 11.2.2.1. Overview
- 11.2.2.2. Products
- 11.2.2.3. SWOT Analysis
- 11.2.2.4. Recent Developments
- 11.2.2.5. Financials (Based on Availability)
- 11.2.3 Nokia
- 11.2.3.1. Overview
- 11.2.3.2. Products
- 11.2.3.3. SWOT Analysis
- 11.2.3.4. Recent Developments
- 11.2.3.5. Financials (Based on Availability)
- 11.2.4 Samsung
- 11.2.4.1. Overview
- 11.2.4.2. Products
- 11.2.4.3. SWOT Analysis
- 11.2.4.4. Recent Developments
- 11.2.4.5. Financials (Based on Availability)
- 11.2.5 ZTE
- 11.2.5.1. Overview
- 11.2.5.2. Products
- 11.2.5.3. SWOT Analysis
- 11.2.5.4. Recent Developments
- 11.2.5.5. Financials (Based on Availability)
- 11.2.6 China Mobile
- 11.2.6.1. Overview
- 11.2.6.2. Products
- 11.2.6.3. SWOT Analysis
- 11.2.6.4. Recent Developments
- 11.2.6.5. Financials (Based on Availability)
- 11.2.7 China Telecom
- 11.2.7.1. Overview
- 11.2.7.2. Products
- 11.2.7.3. SWOT Analysis
- 11.2.7.4. Recent Developments
- 11.2.7.5. Financials (Based on Availability)
- 11.2.8 China Unicom
- 11.2.8.1. Overview
- 11.2.8.2. Products
- 11.2.8.3. SWOT Analysis
- 11.2.8.4. Recent Developments
- 11.2.8.5. Financials (Based on Availability)
- 11.2.9 Verizon
- 11.2.9.1. Overview
- 11.2.9.2. Products
- 11.2.9.3. SWOT Analysis
- 11.2.9.4. Recent Developments
- 11.2.9.5. Financials (Based on Availability)
- 11.2.10 AT&T
- 11.2.10.1. Overview
- 11.2.10.2. Products
- 11.2.10.3. SWOT Analysis
- 11.2.10.4. Recent Developments
- 11.2.10.5. Financials (Based on Availability)
- 11.2.11 Vodafone Group
- 11.2.11.1. Overview
- 11.2.11.2. Products
- 11.2.11.3. SWOT Analysis
- 11.2.11.4. Recent Developments
- 11.2.11.5. Financials (Based on Availability)
- 11.2.12 SK Telecom
- 11.2.12.1. Overview
- 11.2.12.2. Products
- 11.2.12.3. SWOT Analysis
- 11.2.12.4. Recent Developments
- 11.2.12.5. Financials (Based on Availability)
- 11.2.13 NTT
- 11.2.13.1. Overview
- 11.2.13.2. Products
- 11.2.13.3. SWOT Analysis
- 11.2.13.4. Recent Developments
- 11.2.13.5. Financials (Based on Availability)
- 11.2.14 KT Corporation
- 11.2.14.1. Overview
- 11.2.14.2. Products
- 11.2.14.3. SWOT Analysis
- 11.2.14.4. Recent Developments
- 11.2.14.5. Financials (Based on Availability)
- 11.2.15 Cisco
- 11.2.15.1. Overview
- 11.2.15.2. Products
- 11.2.15.3. SWOT Analysis
- 11.2.15.4. Recent Developments
- 11.2.15.5. Financials (Based on Availability)
- 11.2.16 Siemens
- 11.2.16.1. Overview
- 11.2.16.2. Products
- 11.2.16.3. SWOT Analysis
- 11.2.16.4. Recent Developments
- 11.2.16.5. Financials (Based on Availability)
- 11.2.17 BT
- 11.2.17.1. Overview
- 11.2.17.2. Products
- 11.2.17.3. SWOT Analysis
- 11.2.17.4. Recent Developments
- 11.2.17.5. Financials (Based on Availability)
- 11.2.18 Microsoft
- 11.2.18.1. Overview
- 11.2.18.2. Products
- 11.2.18.3. SWOT Analysis
- 11.2.18.4. Recent Developments
- 11.2.18.5. Financials (Based on Availability)
- 11.2.19 Fujitsu
- 11.2.19.1. Overview
- 11.2.19.2. Products
- 11.2.19.3. SWOT Analysis
- 11.2.19.4. Recent Developments
- 11.2.19.5. Financials (Based on Availability)
- 11.2.20 NEC
- 11.2.20.1. Overview
- 11.2.20.2. Products
- 11.2.20.3. SWOT Analysis
- 11.2.20.4. Recent Developments
- 11.2.20.5. Financials (Based on Availability)
- 11.2.1 Ericsson
List of Figures
- Figure 1: Global Industrial 5g Revenue Breakdown (million, %) by Region 2024 & 2032
- Figure 2: North America Industrial 5g Revenue (million), by Application 2024 & 2032
- Figure 3: North America Industrial 5g Revenue Share (%), by Application 2024 & 2032
- Figure 4: North America Industrial 5g Revenue (million), by Type 2024 & 2032
- Figure 5: North America Industrial 5g Revenue Share (%), by Type 2024 & 2032
- Figure 6: North America Industrial 5g Revenue (million), by Country 2024 & 2032
- Figure 7: North America Industrial 5g Revenue Share (%), by Country 2024 & 2032
- Figure 8: South America Industrial 5g Revenue (million), by Application 2024 & 2032
- Figure 9: South America Industrial 5g Revenue Share (%), by Application 2024 & 2032
- Figure 10: South America Industrial 5g Revenue (million), by Type 2024 & 2032
- Figure 11: South America Industrial 5g Revenue Share (%), by Type 2024 & 2032
- Figure 12: South America Industrial 5g Revenue (million), by Country 2024 & 2032
- Figure 13: South America Industrial 5g Revenue Share (%), by Country 2024 & 2032
- Figure 14: Europe Industrial 5g Revenue (million), by Application 2024 & 2032
- Figure 15: Europe Industrial 5g Revenue Share (%), by Application 2024 & 2032
- Figure 16: Europe Industrial 5g Revenue (million), by Type 2024 & 2032
- Figure 17: Europe Industrial 5g Revenue Share (%), by Type 2024 & 2032
- Figure 18: Europe Industrial 5g Revenue (million), by Country 2024 & 2032
- Figure 19: Europe Industrial 5g Revenue Share (%), by Country 2024 & 2032
- Figure 20: Middle East & Africa Industrial 5g Revenue (million), by Application 2024 & 2032
- Figure 21: Middle East & Africa Industrial 5g Revenue Share (%), by Application 2024 & 2032
- Figure 22: Middle East & Africa Industrial 5g Revenue (million), by Type 2024 & 2032
- Figure 23: Middle East & Africa Industrial 5g Revenue Share (%), by Type 2024 & 2032
- Figure 24: Middle East & Africa Industrial 5g Revenue (million), by Country 2024 & 2032
- Figure 25: Middle East & Africa Industrial 5g Revenue Share (%), by Country 2024 & 2032
- Figure 26: Asia Pacific Industrial 5g Revenue (million), by Application 2024 & 2032
- Figure 27: Asia Pacific Industrial 5g Revenue Share (%), by Application 2024 & 2032
- Figure 28: Asia Pacific Industrial 5g Revenue (million), by Type 2024 & 2032
- Figure 29: Asia Pacific Industrial 5g Revenue Share (%), by Type 2024 & 2032
- Figure 30: Asia Pacific Industrial 5g Revenue (million), by Country 2024 & 2032
- Figure 31: Asia Pacific Industrial 5g Revenue Share (%), by Country 2024 & 2032
List of Tables
- Table 1: Global Industrial 5g Revenue million Forecast, by Region 2019 & 2032
- Table 2: Global Industrial 5g Revenue million Forecast, by Application 2019 & 2032
- Table 3: Global Industrial 5g Revenue million Forecast, by Type 2019 & 2032
- Table 4: Global Industrial 5g Revenue million Forecast, by Region 2019 & 2032
- Table 5: Global Industrial 5g Revenue million Forecast, by Application 2019 & 2032
- Table 6: Global Industrial 5g Revenue million Forecast, by Type 2019 & 2032
- Table 7: Global Industrial 5g Revenue million Forecast, by Country 2019 & 2032
- Table 8: United States Industrial 5g Revenue (million) Forecast, by Application 2019 & 2032
- Table 9: Canada Industrial 5g Revenue (million) Forecast, by Application 2019 & 2032
- Table 10: Mexico Industrial 5g Revenue (million) Forecast, by Application 2019 & 2032
- Table 11: Global Industrial 5g Revenue million Forecast, by Application 2019 & 2032
- Table 12: Global Industrial 5g Revenue million Forecast, by Type 2019 & 2032
- Table 13: Global Industrial 5g Revenue million Forecast, by Country 2019 & 2032
- Table 14: Brazil Industrial 5g Revenue (million) Forecast, by Application 2019 & 2032
- Table 15: Argentina Industrial 5g Revenue (million) Forecast, by Application 2019 & 2032
- Table 16: Rest of South America Industrial 5g Revenue (million) Forecast, by Application 2019 & 2032
- Table 17: Global Industrial 5g Revenue million Forecast, by Application 2019 & 2032
- Table 18: Global Industrial 5g Revenue million Forecast, by Type 2019 & 2032
- Table 19: Global Industrial 5g Revenue million Forecast, by Country 2019 & 2032
- Table 20: United Kingdom Industrial 5g Revenue (million) Forecast, by Application 2019 & 2032
- Table 21: Germany Industrial 5g Revenue (million) Forecast, by Application 2019 & 2032
- Table 22: France Industrial 5g Revenue (million) Forecast, by Application 2019 & 2032
- Table 23: Italy Industrial 5g Revenue (million) Forecast, by Application 2019 & 2032
- Table 24: Spain Industrial 5g Revenue (million) Forecast, by Application 2019 & 2032
- Table 25: Russia Industrial 5g Revenue (million) Forecast, by Application 2019 & 2032
- Table 26: Benelux Industrial 5g Revenue (million) Forecast, by Application 2019 & 2032
- Table 27: Nordics Industrial 5g Revenue (million) Forecast, by Application 2019 & 2032
- Table 28: Rest of Europe Industrial 5g Revenue (million) Forecast, by Application 2019 & 2032
- Table 29: Global Industrial 5g Revenue million Forecast, by Application 2019 & 2032
- Table 30: Global Industrial 5g Revenue million Forecast, by Type 2019 & 2032
- Table 31: Global Industrial 5g Revenue million Forecast, by Country 2019 & 2032
- Table 32: Turkey Industrial 5g Revenue (million) Forecast, by Application 2019 & 2032
- Table 33: Israel Industrial 5g Revenue (million) Forecast, by Application 2019 & 2032
- Table 34: GCC Industrial 5g Revenue (million) Forecast, by Application 2019 & 2032
- Table 35: North Africa Industrial 5g Revenue (million) Forecast, by Application 2019 & 2032
- Table 36: South Africa Industrial 5g Revenue (million) Forecast, by Application 2019 & 2032
- Table 37: Rest of Middle East & Africa Industrial 5g Revenue (million) Forecast, by Application 2019 & 2032
- Table 38: Global Industrial 5g Revenue million Forecast, by Application 2019 & 2032
- Table 39: Global Industrial 5g Revenue million Forecast, by Type 2019 & 2032
- Table 40: Global Industrial 5g Revenue million Forecast, by Country 2019 & 2032
- Table 41: China Industrial 5g Revenue (million) Forecast, by Application 2019 & 2032
- Table 42: India Industrial 5g Revenue (million) Forecast, by Application 2019 & 2032
- Table 43: Japan Industrial 5g Revenue (million) Forecast, by Application 2019 & 2032
- Table 44: South Korea Industrial 5g Revenue (million) Forecast, by Application 2019 & 2032
- Table 45: ASEAN Industrial 5g Revenue (million) Forecast, by Application 2019 & 2032
- Table 46: Oceania Industrial 5g Revenue (million) Forecast, by Application 2019 & 2032
- Table 47: Rest of Asia Pacific Industrial 5g Revenue (million) Forecast, by Application 2019 & 2032
Frequently Asked Questions
1. What is the projected Compound Annual Growth Rate (CAGR) of the Industrial 5g?
The projected CAGR is approximately 31%.
2. Which companies are prominent players in the Industrial 5g?
Key companies in the market include Ericsson, Huawei, Nokia, Samsung, ZTE, China Mobile, China Telecom, China Unicom, Verizon, AT&T, Vodafone Group, SK Telecom, NTT, KT Corporation, Cisco, Siemens, BT, Microsoft, Fujitsu, NEC.
3. What are the main segments of the Industrial 5g?
The market segments include Application, Type.
4. Can you provide details about the market size?
The market size is estimated to be USD 233300 million as of 2022.
5. What are some drivers contributing to market growth?
N/A
6. What are the notable trends driving market growth?
N/A
7. Are there any restraints impacting market growth?
N/A
8. Can you provide examples of recent developments in the market?
N/A
9. What pricing options are available for accessing the report?
Pricing options include single-user, multi-user, and enterprise licenses priced at USD 2900.00, USD 4350.00, and USD 5800.00 respectively.
10. Is the market size provided in terms of value or volume?
The market size is provided in terms of value, measured in million.
11. Are there any specific market keywords associated with the report?
Yes, the market keyword associated with the report is "Industrial 5g," which aids in identifying and referencing the specific market segment covered.
12. How do I determine which pricing option suits my needs best?
The pricing options vary based on user requirements and access needs. Individual users may opt for single-user licenses, while businesses requiring broader access may choose multi-user or enterprise licenses for cost-effective access to the report.
13. Are there any additional resources or data provided in the Industrial 5g report?
While the report offers comprehensive insights, it's advisable to review the specific contents or supplementary materials provided to ascertain if additional resources or data are available.
14. How can I stay updated on further developments or reports in the Industrial 5g?
To stay informed about further developments, trends, and reports in the Industrial 5g, consider subscribing to industry newsletters, following relevant companies and organizations, or regularly checking reputable industry news sources and publications.
Methodology
Step 1 - Identification of Relevant Samples Size from Population Database


Step 2 - Approaches for Defining Global Market Size (Value, Volume* & Price*)

Note*: In applicable scenarios
Step 3 - Data Sources
Primary Research
- Web Analytics
- Survey Reports
- Research Institute
- Latest Research Reports
- Opinion Leaders
Secondary Research
- Annual Reports
- White Paper
- Latest Press Release
- Industry Association
- Paid Database
- Investor Presentations

Step 4 - Data Triangulation
Involves using different sources of information in order to increase the validity of a study
These sources are likely to be stakeholders in a program - participants, other researchers, program staff, other community members, and so on.
Then we put all data in single framework & apply various statistical tools to find out the dynamic on the market.
During the analysis stage, feedback from the stakeholder groups would be compared to determine areas of agreement as well as areas of divergence
