

Key Insights
The home energy storage (HES) market is experiencing significant expansion, driven by escalating electricity costs, heightened concerns regarding grid reliability, and the increasing integration of renewable energy sources such as solar power. A projected 18.3% CAGR indicates substantial market growth, with the market size anticipated to reach $61.5 billion by 2033. Key growth drivers include government incentives supporting renewable energy adoption, advancements in battery technologies like Lithium-ion offering improved energy density and longevity, and growing consumer awareness of the environmental and economic advantages of energy independence. Technological innovations, particularly in battery chemistry and energy management systems, further fuel market expansion. While initial investment costs can be a barrier, declining battery prices and long-term cost savings from reduced grid reliance are mitigating this challenge. The market predominantly favors Lithium-ion batteries due to their superior performance, though Lead-acid batteries retain a notable share for less demanding applications.
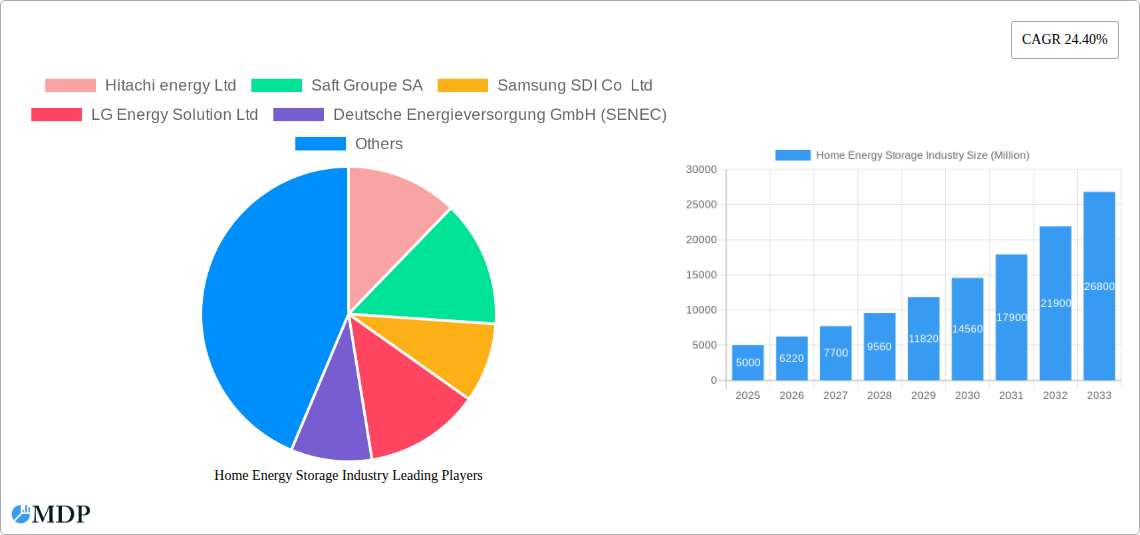
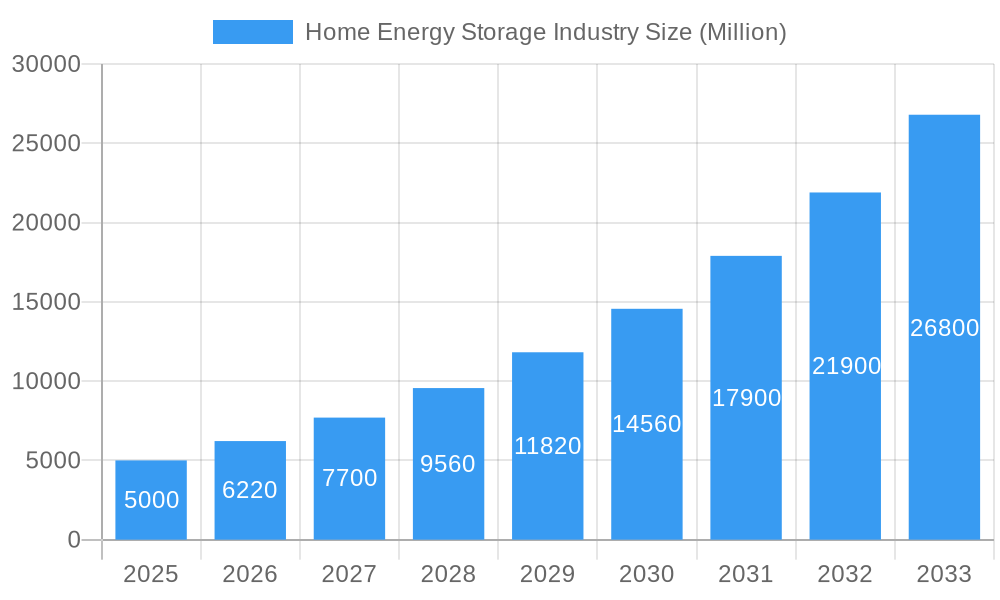
Home Energy Storage Industry Market Size (In Billion)
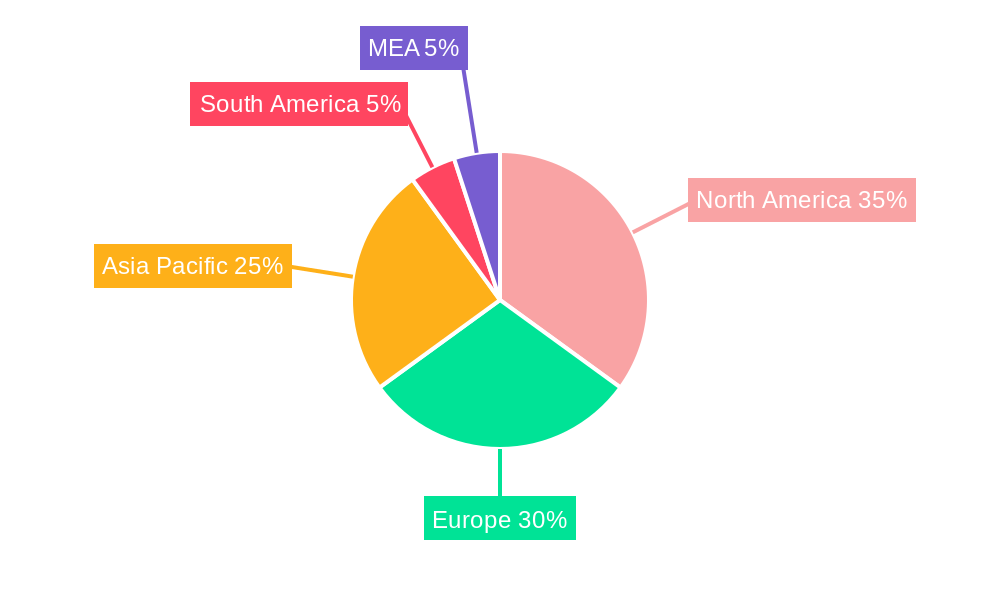
Geographically, the HES market demonstrates robust growth across North America, Europe, and Asia Pacific. North America is expected to maintain a dominant market share, supported by its strong renewable energy sector and favorable government policies. Europe, driven by ambitious climate targets and rising energy prices, presents significant market opportunities. Asia Pacific, characterized by rapid solar adoption and increasing energy demands, offers substantial future growth potential. Market restraints include the high upfront investment for HES systems, potential safety concerns associated with battery storage, and the need for enhanced grid infrastructure to effectively integrate distributed energy resources. Despite these challenges, the industry outlook remains positive, with continuous innovation and supportive policy frameworks fostering sustained growth. Leading companies such as Tesla, LG Energy Solution, and Panasonic are at the forefront of technological advancements and market penetration, shaping the future of home energy storage.
Home Energy Storage Industry Company Market Share
Home Energy Storage Industry Analysis: Market Size, Trends, and Forecast
This comprehensive report analyzes the home energy storage industry, detailing market dynamics, key players, technological progress, and future growth projections. With a study period from 2024 to 2033, a base year of 2024, and a forecast period of 2025-2033, this report delivers critical insights for industry stakeholders, investors, and decision-makers. The global market size is estimated to reach $61.5 billion by 2033, exhibiting a strong CAGR of 18.3% during the forecast period.
Home Energy Storage Industry Market Dynamics & Concentration
The home energy storage market is characterized by a dynamic interplay of factors influencing its growth and concentration. Market concentration is moderate, with several key players vying for market share. However, the industry is witnessing a surge in innovation, driven by advancements in battery technology and the increasing adoption of renewable energy sources. Stringent regulatory frameworks, particularly concerning safety and grid integration, are shaping the industry landscape. The increasing availability of product substitutes, such as traditional backup generators, presents a competitive challenge. End-user trends, such as rising energy costs and concerns about power outages, are fueling demand. Mergers and acquisitions (M&A) are further consolidating the market, with xx M&A deals recorded between 2019 and 2024. Leading companies, including Hitachi Energy Ltd, Saft Groupe SA, Samsung SDI Co Ltd, LG Energy Solution Ltd, Deutsche Energieversorgung GmbH (SENEC), Sunverge Energy LLC, Tesla Inc, Sonnen GmbH, and Panasonic Corporation, are actively shaping market dynamics through product innovation, strategic partnerships, and geographic expansion.
- Market Share (2024): Tesla Inc (xx%), LG Energy Solution Ltd (xx%), Samsung SDI Co Ltd (xx%), Others (xx%).
- M&A Deal Count (2019-2024): xx
- Key Innovation Drivers: Advancements in battery chemistry, improved energy density, enhanced safety features, smart grid integration capabilities.
- Regulatory Frameworks: Safety standards, grid interconnection regulations, permitting processes.
Home Energy Storage Industry Industry Trends & Analysis
The home energy storage market is experiencing significant growth, driven by a confluence of factors. The increasing adoption of renewable energy sources, particularly solar photovoltaic (PV) systems, is a key driver, as homeowners seek to store excess solar energy for later use. Technological advancements, such as the development of more efficient and cost-effective battery technologies (like Lithium-ion), are further accelerating market growth. Consumer preferences are shifting towards energy independence and resilience, leading to increased demand for home energy storage systems. Competitive dynamics are characterized by intense rivalry among established players and emerging startups, resulting in continuous product innovation and price reductions. The market is projected to experience a CAGR of xx% during the forecast period (2025-2033), with market penetration reaching xx% by 2033. The rising concerns regarding climate change and the increasing focus on sustainable energy solutions further propel the market.
Leading Markets & Segments in Home Energy Storage Industry
The North American and European regions are currently dominating the home energy storage market, driven by supportive government policies, strong consumer demand, and well-established renewable energy infrastructure. Within technology types, Lithium-ion batteries hold the largest market share, owing to their high energy density, long cycle life, and relatively lower cost compared to other battery technologies. Lead-acid batteries still maintain a presence, particularly in low-cost applications, but their market share is steadily declining due to their lower energy density and shorter lifespan. Other technology types, such as flow batteries and solid-state batteries, are emerging but currently hold a relatively small market share.
- Key Drivers in North America: Strong incentives for renewable energy adoption, rising electricity prices, frequent power outages.
- Key Drivers in Europe: Government support for energy independence, increasing environmental awareness, growing adoption of solar PV systems.
- Lithium-ion Battery Dominance: Higher energy density, longer lifespan, improved safety features, and decreasing cost compared to Lead-acid batteries.
Home Energy Storage Industry Product Developments
Recent product developments in the home energy storage industry have focused on enhancing energy density, improving safety features, and integrating smart grid capabilities. Manufacturers are increasingly incorporating advanced battery management systems (BMS) to optimize battery performance and lifespan. The integration of smart home features and remote monitoring capabilities is also becoming increasingly common. These innovations aim to address key consumer concerns, such as cost, safety, and ease of installation. The market is also witnessing the emergence of modular and scalable systems, offering greater flexibility to meet diverse energy needs.
Key Drivers of Home Energy Storage Industry Growth
Several key factors are driving the growth of the home energy storage industry. Technological advancements in battery technology, specifically in Lithium-ion batteries, are leading to increased efficiency, longer lifespan, and reduced costs. Government incentives and supportive policies, such as tax credits and rebates, are stimulating demand. Furthermore, rising electricity prices and concerns about power outages are prompting homeowners to invest in energy storage solutions. The increasing integration of renewable energy sources, such as solar PV, is creating a strong synergy, boosting the adoption of home energy storage systems.
Challenges in the Home Energy Storage Industry Market
The home energy storage market faces several challenges. High upfront costs remain a significant barrier for many consumers. Regulatory hurdles and grid interconnection complexities can delay deployment and increase costs. Supply chain disruptions and raw material price volatility pose risks to manufacturing and supply. Competition from established players and new entrants is intensifying, putting pressure on pricing and margins. These factors together can impact market growth if not addressed proactively.
Emerging Opportunities in Home Energy Storage Industry
The long-term growth of the home energy storage industry is fueled by several emerging opportunities. Advancements in battery technology, such as solid-state batteries, hold the potential to significantly improve energy density, safety, and lifespan. Strategic partnerships between energy storage companies and utility providers can unlock new markets and revenue streams. Expanding into new geographic regions with high renewable energy penetration and strong growth potential will further expand market size.
Leading Players in the Home Energy Storage Industry Sector
- Hitachi Energy Ltd
- Saft Groupe SA
- Samsung SDI Co Ltd
- LG Energy Solution Ltd
- Deutsche Energieversorgung GmbH (SENEC)
- Sunverge Energy LLC
- Tesla Inc
- Sonnen GmbH
- Panasonic Corporation
Key Milestones in Home Energy Storage Industry Industry
- May 2022: Mango Power launched the Mango Power M Series, a versatile home energy storage system with solar PV integration capabilities, offering 10-20 kWh battery capacity and 8-14 kW output.
- June 2022: Toyota launched the O-Uchi Kyuden System, a residential battery product utilizing EV battery technology, offering 5.5 kWh rated output and 8.7 kWh rated capacity.
Strategic Outlook for Home Energy Storage Industry Market
The future of the home energy storage industry looks promising. Continued technological advancements, decreasing battery costs, and supportive government policies will drive market expansion. Strategic partnerships, innovative business models, and geographic diversification will be crucial for companies to succeed in this rapidly evolving market. The industry is poised for significant growth, driven by increasing energy prices, climate change concerns, and the wider adoption of renewable energy sources. The market is expected to experience substantial expansion in the coming years, presenting significant opportunities for both established players and new entrants.
Home Energy Storage Industry Segmentation
-
1. Technology Type
- 1.1. Lithium-ion Batteries
- 1.2. Lead-acid Batteries
- 1.3. Other Technology Types
Home Energy Storage Industry Segmentation By Geography
- 1. North America
- 2. Asia Pacific
- 3. Europe
- 4. Middle East and Africa
- 5. South America
Home Energy Storage Industry Regional Market Share
Geographic Coverage of Home Energy Storage Industry
Home Energy Storage Industry REPORT HIGHLIGHTS
| Aspects | Details |
|---|---|
| Study Period | 2020-2034 |
| Base Year | 2025 |
| Estimated Year | 2026 |
| Forecast Period | 2026-2034 |
| Historical Period | 2020-2025 |
| Growth Rate | CAGR of 18.3% from 2020-2034 |
| Segmentation |
|
Table of Contents
- 1. Introduction
- 1.1. Research Scope
- 1.2. Market Segmentation
- 1.3. Research Objective
- 1.4. Definitions and Assumptions
- 2. Executive Summary
- 2.1. Market Snapshot
- 3. Market Dynamics
- 3.1. Market Drivers
- 3.2. Market Restrains
- 3.3. Market Trends
- 3.4. Market Opportunities
- 4. Market Factor Analysis
- 4.1. Porters Five Forces
- 4.1.1. Bargaining Power of Suppliers
- 4.1.2. Bargaining Power of Buyers
- 4.1.3. Threat of New Entrants
- 4.1.4. Threat of Substitutes
- 4.1.5. Competitive Rivalry
- 4.2. PESTEL analysis
- 4.3. BCG Analysis
- 4.3.1. Stars (High Growth, High Market Share)
- 4.3.2. Cash Cows (Low Growth, High Market Share)
- 4.3.3. Question Mark (High Growth, Low Market Share)
- 4.3.4. Dogs (Low Growth, Low Market Share)
- 4.4. Ansoff Matrix Analysis
- 4.5. Supply Chain Analysis
- 4.6. Regulatory Landscape
- 4.7. Current Market Potential and Opportunity Assessment (TAM–SAM–SOM Framework)
- 4.8. MDP Analyst Note
- 4.1. Porters Five Forces
- 5. Market Analysis, Insights and Forecast 2021-2033
- 5.1. Market Analysis, Insights and Forecast - by Technology Type
- 5.1.1. Lithium-ion Batteries
- 5.1.2. Lead-acid Batteries
- 5.1.3. Other Technology Types
- 5.2. Market Analysis, Insights and Forecast - by Region
- 5.2.1. North America
- 5.2.2. Asia Pacific
- 5.2.3. Europe
- 5.2.4. Middle East and Africa
- 5.2.5. South America
- 5.1. Market Analysis, Insights and Forecast - by Technology Type
- 6. Global Home Energy Storage Industry Analysis, Insights and Forecast, 2021-2033
- 6.1. Market Analysis, Insights and Forecast - by Technology Type
- 6.1.1. Lithium-ion Batteries
- 6.1.2. Lead-acid Batteries
- 6.1.3. Other Technology Types
- 6.1. Market Analysis, Insights and Forecast - by Technology Type
- 7. North America Home Energy Storage Industry Analysis, Insights and Forecast, 2020-2032
- 7.1. Market Analysis, Insights and Forecast - by Technology Type
- 7.1.1. Lithium-ion Batteries
- 7.1.2. Lead-acid Batteries
- 7.1.3. Other Technology Types
- 7.1. Market Analysis, Insights and Forecast - by Technology Type
- 8. Asia Pacific Home Energy Storage Industry Analysis, Insights and Forecast, 2020-2032
- 8.1. Market Analysis, Insights and Forecast - by Technology Type
- 8.1.1. Lithium-ion Batteries
- 8.1.2. Lead-acid Batteries
- 8.1.3. Other Technology Types
- 8.1. Market Analysis, Insights and Forecast - by Technology Type
- 9. Europe Home Energy Storage Industry Analysis, Insights and Forecast, 2020-2032
- 9.1. Market Analysis, Insights and Forecast - by Technology Type
- 9.1.1. Lithium-ion Batteries
- 9.1.2. Lead-acid Batteries
- 9.1.3. Other Technology Types
- 9.1. Market Analysis, Insights and Forecast - by Technology Type
- 10. Middle East and Africa Home Energy Storage Industry Analysis, Insights and Forecast, 2020-2032
- 10.1. Market Analysis, Insights and Forecast - by Technology Type
- 10.1.1. Lithium-ion Batteries
- 10.1.2. Lead-acid Batteries
- 10.1.3. Other Technology Types
- 10.1. Market Analysis, Insights and Forecast - by Technology Type
- 11. South America Home Energy Storage Industry Analysis, Insights and Forecast, 2020-2032
- 11.1. Market Analysis, Insights and Forecast - by Technology Type
- 11.1.1. Lithium-ion Batteries
- 11.1.2. Lead-acid Batteries
- 11.1.3. Other Technology Types
- 11.1. Market Analysis, Insights and Forecast - by Technology Type
- 12. Competitive Analysis
- 12.1. Company Profiles
- 12.1.1 Hitachi energy Ltd
- 12.1.1.1. Company Overview
- 12.1.1.2. Products
- 12.1.1.3. Company Financials
- 12.1.1.4. SWOT Analysis
- 12.1.2 Saft Groupe SA
- 12.1.2.1. Company Overview
- 12.1.2.2. Products
- 12.1.2.3. Company Financials
- 12.1.2.4. SWOT Analysis
- 12.1.3 Samsung SDI Co Ltd
- 12.1.3.1. Company Overview
- 12.1.3.2. Products
- 12.1.3.3. Company Financials
- 12.1.3.4. SWOT Analysis
- 12.1.4 LG Energy Solution Ltd
- 12.1.4.1. Company Overview
- 12.1.4.2. Products
- 12.1.4.3. Company Financials
- 12.1.4.4. SWOT Analysis
- 12.1.5 Deutsche Energieversorgung GmbH (SENEC)
- 12.1.5.1. Company Overview
- 12.1.5.2. Products
- 12.1.5.3. Company Financials
- 12.1.5.4. SWOT Analysis
- 12.1.6 Sunverge Energy LLC
- 12.1.6.1. Company Overview
- 12.1.6.2. Products
- 12.1.6.3. Company Financials
- 12.1.6.4. SWOT Analysis
- 12.1.7 Tesla Inc
- 12.1.7.1. Company Overview
- 12.1.7.2. Products
- 12.1.7.3. Company Financials
- 12.1.7.4. SWOT Analysis
- 12.1.8 Sonnen GmbH
- 12.1.8.1. Company Overview
- 12.1.8.2. Products
- 12.1.8.3. Company Financials
- 12.1.8.4. SWOT Analysis
- 12.1.9 Panasonic Corporation
- 12.1.9.1. Company Overview
- 12.1.9.2. Products
- 12.1.9.3. Company Financials
- 12.1.9.4. SWOT Analysis
- 12.1.1 Hitachi energy Ltd
- 12.2. Market Entropy
- 12.2.1 Company's Key Areas Served
- 12.2.2 Recent Developments
- 12.3. Company Market Share Analysis 2025
- 12.3.1 Top 5 Companies Market Share Analysis
- 12.3.2 Top 3 Companies Market Share Analysis
- 12.4. List of Potential Customers
- 13. Research Methodology
List of Figures
- Figure 1: Global Home Energy Storage Industry Revenue Breakdown (billion, %) by Region 2025 & 2033
- Figure 2: Global Home Energy Storage Industry Volume Breakdown (K Unit, %) by Region 2025 & 2033
- Figure 3: North America Home Energy Storage Industry Revenue (billion), by Technology Type 2025 & 2033
- Figure 4: North America Home Energy Storage Industry Volume (K Unit), by Technology Type 2025 & 2033
- Figure 5: North America Home Energy Storage Industry Revenue Share (%), by Technology Type 2025 & 2033
- Figure 6: North America Home Energy Storage Industry Volume Share (%), by Technology Type 2025 & 2033
- Figure 7: North America Home Energy Storage Industry Revenue (billion), by Country 2025 & 2033
- Figure 8: North America Home Energy Storage Industry Volume (K Unit), by Country 2025 & 2033
- Figure 9: North America Home Energy Storage Industry Revenue Share (%), by Country 2025 & 2033
- Figure 10: North America Home Energy Storage Industry Volume Share (%), by Country 2025 & 2033
- Figure 11: Asia Pacific Home Energy Storage Industry Revenue (billion), by Technology Type 2025 & 2033
- Figure 12: Asia Pacific Home Energy Storage Industry Volume (K Unit), by Technology Type 2025 & 2033
- Figure 13: Asia Pacific Home Energy Storage Industry Revenue Share (%), by Technology Type 2025 & 2033
- Figure 14: Asia Pacific Home Energy Storage Industry Volume Share (%), by Technology Type 2025 & 2033
- Figure 15: Asia Pacific Home Energy Storage Industry Revenue (billion), by Country 2025 & 2033
- Figure 16: Asia Pacific Home Energy Storage Industry Volume (K Unit), by Country 2025 & 2033
- Figure 17: Asia Pacific Home Energy Storage Industry Revenue Share (%), by Country 2025 & 2033
- Figure 18: Asia Pacific Home Energy Storage Industry Volume Share (%), by Country 2025 & 2033
- Figure 19: Europe Home Energy Storage Industry Revenue (billion), by Technology Type 2025 & 2033
- Figure 20: Europe Home Energy Storage Industry Volume (K Unit), by Technology Type 2025 & 2033
- Figure 21: Europe Home Energy Storage Industry Revenue Share (%), by Technology Type 2025 & 2033
- Figure 22: Europe Home Energy Storage Industry Volume Share (%), by Technology Type 2025 & 2033
- Figure 23: Europe Home Energy Storage Industry Revenue (billion), by Country 2025 & 2033
- Figure 24: Europe Home Energy Storage Industry Volume (K Unit), by Country 2025 & 2033
- Figure 25: Europe Home Energy Storage Industry Revenue Share (%), by Country 2025 & 2033
- Figure 26: Europe Home Energy Storage Industry Volume Share (%), by Country 2025 & 2033
- Figure 27: Middle East and Africa Home Energy Storage Industry Revenue (billion), by Technology Type 2025 & 2033
- Figure 28: Middle East and Africa Home Energy Storage Industry Volume (K Unit), by Technology Type 2025 & 2033
- Figure 29: Middle East and Africa Home Energy Storage Industry Revenue Share (%), by Technology Type 2025 & 2033
- Figure 30: Middle East and Africa Home Energy Storage Industry Volume Share (%), by Technology Type 2025 & 2033
- Figure 31: Middle East and Africa Home Energy Storage Industry Revenue (billion), by Country 2025 & 2033
- Figure 32: Middle East and Africa Home Energy Storage Industry Volume (K Unit), by Country 2025 & 2033
- Figure 33: Middle East and Africa Home Energy Storage Industry Revenue Share (%), by Country 2025 & 2033
- Figure 34: Middle East and Africa Home Energy Storage Industry Volume Share (%), by Country 2025 & 2033
- Figure 35: South America Home Energy Storage Industry Revenue (billion), by Technology Type 2025 & 2033
- Figure 36: South America Home Energy Storage Industry Volume (K Unit), by Technology Type 2025 & 2033
- Figure 37: South America Home Energy Storage Industry Revenue Share (%), by Technology Type 2025 & 2033
- Figure 38: South America Home Energy Storage Industry Volume Share (%), by Technology Type 2025 & 2033
- Figure 39: South America Home Energy Storage Industry Revenue (billion), by Country 2025 & 2033
- Figure 40: South America Home Energy Storage Industry Volume (K Unit), by Country 2025 & 2033
- Figure 41: South America Home Energy Storage Industry Revenue Share (%), by Country 2025 & 2033
- Figure 42: South America Home Energy Storage Industry Volume Share (%), by Country 2025 & 2033
List of Tables
- Table 1: Global Home Energy Storage Industry Revenue billion Forecast, by Technology Type 2020 & 2033
- Table 2: Global Home Energy Storage Industry Volume K Unit Forecast, by Technology Type 2020 & 2033
- Table 3: Global Home Energy Storage Industry Revenue billion Forecast, by Region 2020 & 2033
- Table 4: Global Home Energy Storage Industry Volume K Unit Forecast, by Region 2020 & 2033
- Table 5: Global Home Energy Storage Industry Revenue billion Forecast, by Technology Type 2020 & 2033
- Table 6: Global Home Energy Storage Industry Volume K Unit Forecast, by Technology Type 2020 & 2033
- Table 7: Global Home Energy Storage Industry Revenue billion Forecast, by Country 2020 & 2033
- Table 8: Global Home Energy Storage Industry Volume K Unit Forecast, by Country 2020 & 2033
- Table 9: Global Home Energy Storage Industry Revenue billion Forecast, by Technology Type 2020 & 2033
- Table 10: Global Home Energy Storage Industry Volume K Unit Forecast, by Technology Type 2020 & 2033
- Table 11: Global Home Energy Storage Industry Revenue billion Forecast, by Country 2020 & 2033
- Table 12: Global Home Energy Storage Industry Volume K Unit Forecast, by Country 2020 & 2033
- Table 13: Global Home Energy Storage Industry Revenue billion Forecast, by Technology Type 2020 & 2033
- Table 14: Global Home Energy Storage Industry Volume K Unit Forecast, by Technology Type 2020 & 2033
- Table 15: Global Home Energy Storage Industry Revenue billion Forecast, by Country 2020 & 2033
- Table 16: Global Home Energy Storage Industry Volume K Unit Forecast, by Country 2020 & 2033
- Table 17: Global Home Energy Storage Industry Revenue billion Forecast, by Technology Type 2020 & 2033
- Table 18: Global Home Energy Storage Industry Volume K Unit Forecast, by Technology Type 2020 & 2033
- Table 19: Global Home Energy Storage Industry Revenue billion Forecast, by Country 2020 & 2033
- Table 20: Global Home Energy Storage Industry Volume K Unit Forecast, by Country 2020 & 2033
- Table 21: Global Home Energy Storage Industry Revenue billion Forecast, by Technology Type 2020 & 2033
- Table 22: Global Home Energy Storage Industry Volume K Unit Forecast, by Technology Type 2020 & 2033
- Table 23: Global Home Energy Storage Industry Revenue billion Forecast, by Country 2020 & 2033
- Table 24: Global Home Energy Storage Industry Volume K Unit Forecast, by Country 2020 & 2033
Frequently Asked Questions
1. What is the projected Compound Annual Growth Rate (CAGR) of the Home Energy Storage Industry?
The projected CAGR is approximately 18.3%.
2. Which companies are prominent players in the Home Energy Storage Industry?
Key companies in the market include Hitachi energy Ltd, Saft Groupe SA, Samsung SDI Co Ltd, LG Energy Solution Ltd, Deutsche Energieversorgung GmbH (SENEC), Sunverge Energy LLC, Tesla Inc, Sonnen GmbH, Panasonic Corporation.
3. What are the main segments of the Home Energy Storage Industry?
The market segments include Technology Type.
4. Can you provide details about the market size?
The market size is estimated to be USD 61.5 billion as of 2022.
5. What are some drivers contributing to market growth?
4.; Increasing Investments in Offshore Oil and Gas Projects.
6. What are the notable trends driving market growth?
Lithium-Ion Battery Technology to Dominate the Market.
7. Are there any restraints impacting market growth?
4.; Increasing Penetration of Renewable Energy.
8. Can you provide examples of recent developments in the market?
In May 2022, Mango Power launched Mango Power M Series at the Intersolar Munich 2022. The system can be used with a solar PV, with a 10-20 kWh battery for daily and emergency use. The system supports single and triple-phase connections with 8-14 kW output capability. The system can be used in various applications, including a built-in inverter, backup gateway, and EV charger. The company launched different versions for the United States and Europe markets.
9. What pricing options are available for accessing the report?
Pricing options include single-user, multi-user, and enterprise licenses priced at USD 4750, USD 5250, and USD 8750 respectively.
10. Is the market size provided in terms of value or volume?
The market size is provided in terms of value, measured in billion and volume, measured in K Unit.
11. Are there any specific market keywords associated with the report?
Yes, the market keyword associated with the report is "Home Energy Storage Industry," which aids in identifying and referencing the specific market segment covered.
12. How do I determine which pricing option suits my needs best?
The pricing options vary based on user requirements and access needs. Individual users may opt for single-user licenses, while businesses requiring broader access may choose multi-user or enterprise licenses for cost-effective access to the report.
13. Are there any additional resources or data provided in the Home Energy Storage Industry report?
While the report offers comprehensive insights, it's advisable to review the specific contents or supplementary materials provided to ascertain if additional resources or data are available.
14. How can I stay updated on further developments or reports in the Home Energy Storage Industry?
To stay informed about further developments, trends, and reports in the Home Energy Storage Industry, consider subscribing to industry newsletters, following relevant companies and organizations, or regularly checking reputable industry news sources and publications.
Methodology
Step 1 - Identification of Relevant Samples Size from Population Database


Step 2 - Approaches for Defining Global Market Size (Value, Volume* & Price*)

Note*: In applicable scenarios
Step 3 - Data Sources
Primary Research
- Web Analytics
- Survey Reports
- Research Institute
- Latest Research Reports
- Opinion Leaders
Secondary Research
- Annual Reports
- White Paper
- Latest Press Release
- Industry Association
- Paid Database
- Investor Presentations

Step 4 - Data Triangulation
Involves using different sources of information in order to increase the validity of a study
These sources are likely to be stakeholders in a program - participants, other researchers, program staff, other community members, and so on.
Then we put all data in single framework & apply various statistical tools to find out the dynamic on the market.
During the analysis stage, feedback from the stakeholder groups would be compared to determine areas of agreement as well as areas of divergence