

Key Insights
The global glass bottle and packaging market is projected for substantial expansion, driven by the escalating demand for sustainable and eco-friendly packaging. Growing consumer awareness of environmental issues favors recyclable and reusable glass packaging. This trend is reinforced by government regulations targeting plastic waste reduction and the promotion of circular economy principles. The expanding food and beverage sector, particularly premium segments where glass packaging elevates product perception and shelf appeal, also contributes to market growth. Innovations in glass manufacturing, including lighter-weight bottles and advanced designs, improve cost-effectiveness and product protection. Market participants are pursuing strategic collaborations, acquisitions, and capacity enhancements to meet rising demand. The market is segmented by type (clear, amber, green), application (food & beverages, pharmaceuticals, cosmetics), and region. North America and Europe currently lead in market share due to high consumer consciousness and established regulatory frameworks. However, developing economies in Asia-Pacific present significant growth opportunities fueled by rising disposable incomes and expanding middle-class populations.
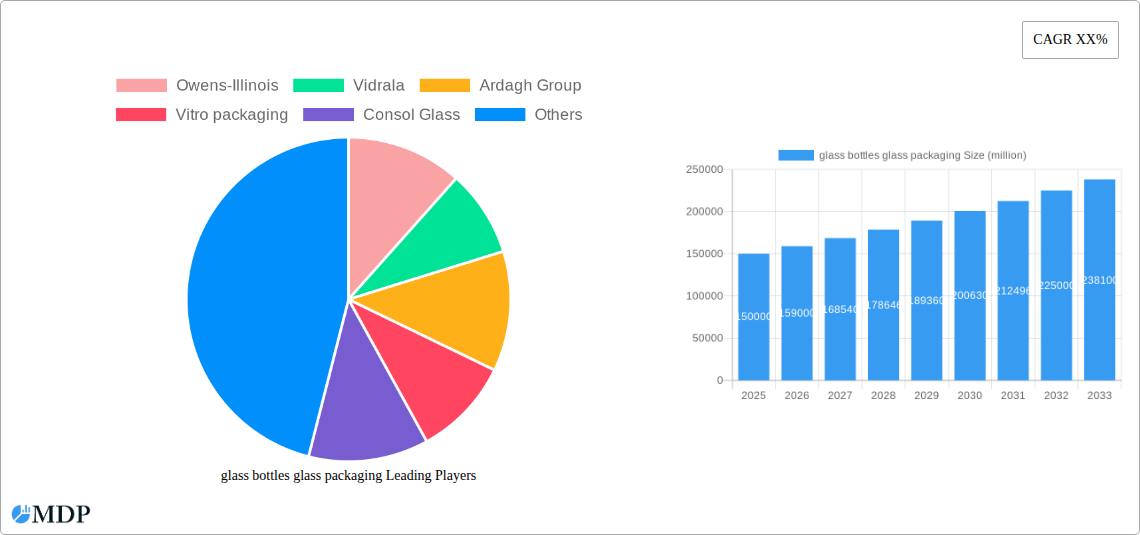
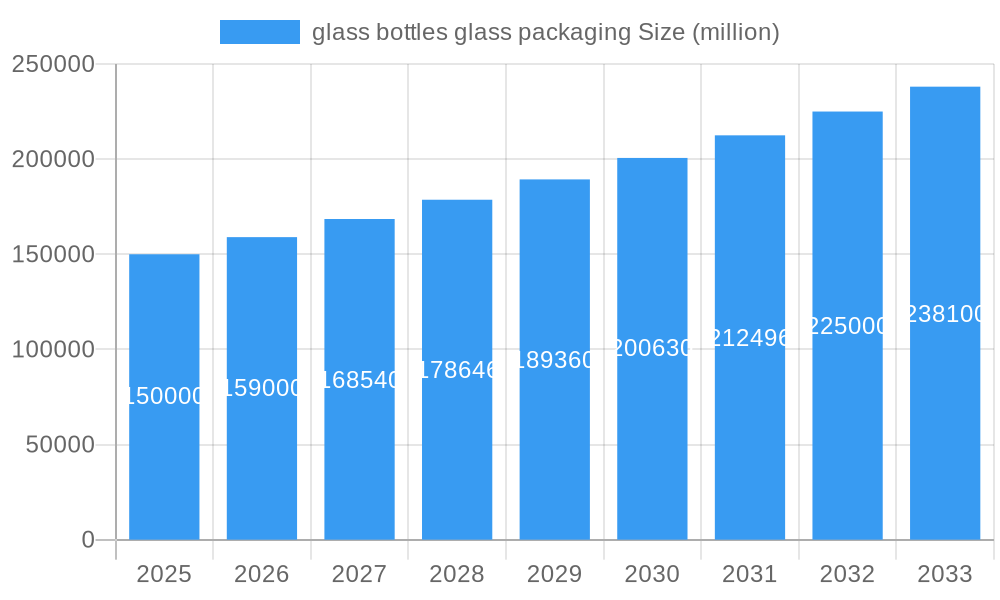
glass bottles glass packaging Market Size (In Billion)
While challenges such as elevated raw material costs and energy consumption in glass production persist, technological advancements are actively addressing these concerns. The development of energy-efficient furnaces and increased utilization of recycled glass are vital for minimizing the environmental impact of glass manufacturing. Despite these constraints, the long-term outlook for the glass bottle and packaging market is highly favorable, with significant growth anticipated over the next decade. The widespread adoption of sustainable business practices and a consumer shift towards eco-conscious products will be pivotal in solidifying glass's role as a preferred packaging material. Intensifying competition among key players is expected to foster further innovation and market consolidation.
glass bottles glass packaging Company Market Share
The global glass bottle and packaging market is forecast to reach $44.9 billion by 2025, growing at a Compound Annual Growth Rate (CAGR) of 5.7% from a 2025 base year.
Glass Bottles & Glass Packaging Market Report: 2019-2033
This comprehensive report provides an in-depth analysis of the global glass bottles and glass packaging market, offering invaluable insights for industry stakeholders, investors, and strategic decision-makers. Covering the period from 2019 to 2033, with a focus on 2025, this report unveils the market's dynamics, trends, leading players, and future outlook. The report projects a market valued at $XX billion in 2025, poised for significant growth with a CAGR of XX% during the forecast period (2025-2033).
Glass Bottles & Glass Packaging Market Dynamics & Concentration
The global glass bottles and glass packaging market exhibits a moderately consolidated structure, with key players holding significant market share. Owens-Illinois, Ardagh Group, and Vidrala are among the leading companies, collectively accounting for an estimated XX% of the market in 2025. The market is characterized by ongoing innovation, driven by the demand for lightweighting, enhanced barrier properties, and sustainable packaging solutions. Stringent regulatory frameworks concerning recyclability and material composition significantly influence market dynamics. While plastic and other materials pose competitive threats, the inherent qualities of glass—its inertness, recyclability, and perceived premium image—ensure its continued relevance.
- Market Concentration: High, with top 5 players controlling approximately XX% of market share in 2025.
- Innovation Drivers: Sustainability, lightweighting, improved barrier properties, design innovation.
- Regulatory Landscape: Growing focus on recyclability and reduced environmental impact.
- Product Substitutes: Plastic, metal, and alternative packaging materials.
- End-User Trends: Shift towards sustainable and premium packaging options.
- M&A Activity: An estimated XX mergers and acquisitions occurred in the historical period (2019-2024), indicating consolidation within the sector.
Glass Bottles & Glass Packaging Industry Trends & Analysis
The glass bottles and glass packaging market is witnessing robust growth, propelled by several key factors. The rising demand for premium and sustainable packaging in the food and beverage, cosmetics, and pharmaceutical industries is a major driver. Technological advancements, such as improved manufacturing processes and enhanced design capabilities, are contributing to increased efficiency and product diversification. Consumer preferences are shifting towards eco-friendly options, further bolstering the demand for recyclable glass packaging. The competitive landscape is dynamic, with companies focusing on innovation, strategic partnerships, and geographical expansion.
- Market growth is primarily driven by the increasing demand for eco-friendly packaging solutions and the expanding food and beverage sector.
- Technological advancements in manufacturing processes are enhancing the efficiency and cost-effectiveness of glass packaging production.
- Consumer preference towards aesthetically appealing and sustainable packaging is positively influencing market growth.
- The competitive landscape remains dynamic, with companies focusing on innovation, strategic partnerships, and geographic expansion to capture a larger market share.
Leading Markets & Segments in Glass Bottles & Glass Packaging
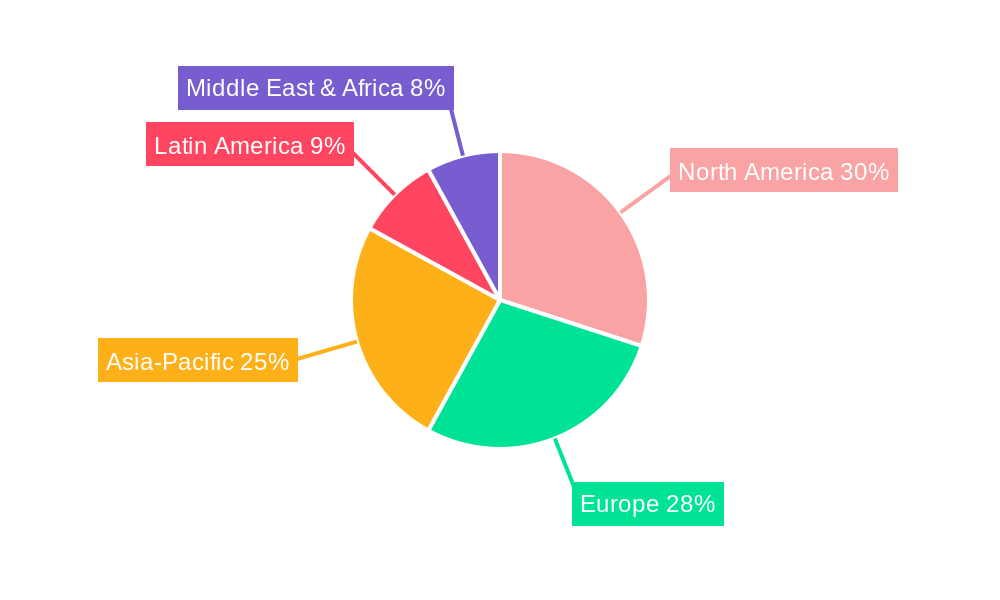
The North American region dominated the market in 2025, accounting for approximately XX% of the global market share, followed by Europe and Asia. This dominance stems from high per capita consumption, robust infrastructure, and a well-established packaging industry.
- Key Drivers for North American Dominance:
- High per capita consumption of packaged goods.
- Strong infrastructure and established packaging industry.
- Favorable regulatory environment supporting sustainable packaging.
- European Market: Strong presence driven by robust regulatory frameworks focused on sustainability and high demand for premium packaging.
- Asia-Pacific Market: Experiencing rapid growth, driven by increasing disposable incomes and expanding food & beverage sectors.
Glass Bottles & Glass Packaging Product Developments
Recent product developments focus on lightweighting to reduce transportation costs and environmental impact, improved barrier properties to enhance product shelf life, and innovative designs to enhance aesthetic appeal and brand differentiation. Technological advancements like advanced furnace technologies and automated production lines contribute to increased efficiency and reduced production costs. The market is witnessing a surge in demand for sustainable and recyclable glass packaging solutions, aligning with global environmental concerns.
Key Drivers of Glass Bottles & Glass Packaging Growth
The market's growth is propelled by several factors. Increased consumer awareness of sustainability is driving demand for eco-friendly packaging. Growth in the food and beverage, pharmaceutical, and cosmetics sectors creates significant demand for glass packaging. Technological advancements lead to more efficient manufacturing processes and lighter-weight bottles, reducing costs and environmental impact. Favorable government regulations promoting sustainable packaging further boost market growth.
Challenges in the Glass Bottles & Glass Packaging Market
The industry faces challenges such as fluctuating raw material costs (sand, soda ash, etc.), impacting production costs and profitability. Competition from alternative packaging materials (plastic, etc.) requires continuous innovation and differentiation. Stringent environmental regulations necessitate continuous investments in sustainable practices, and supply chain disruptions can impact timely delivery and cost efficiency.
Emerging Opportunities in Glass Bottles & Glass Packaging
Significant opportunities lie in developing innovative, lightweight, and sustainable glass packaging solutions. Strategic partnerships with technology providers can accelerate the adoption of advanced manufacturing techniques. Expanding into new and emerging markets, particularly in developing economies with growing consumer demand, presents substantial growth potential. Investing in research and development for enhanced barrier properties and design will be crucial to sustaining competitiveness.
Leading Players in the Glass Bottles & Glass Packaging Sector
- Owens-Illinois
- Vidrala
- Ardagh Group
- Vitro packaging
- Consol Glass
- Zignago Vetro Group
- Vetropack Group
- Guangdong Huaxing
- Yucai Group
- Cangzhou Xingchen Glass
- Cangzhou Four Stars Glass
- Shandong Huapeng Glass
- HEINZ-GLAS
- Piramal Glass
- SAVERGLASS Group
- Bormioli Luigi
- Stoelzle Glass Group
- Carib Glassworks Limited
- Gerresheimer
- Toyo Glass
Key Milestones in Glass Bottles & Glass Packaging Industry
- 2020: Increased focus on sustainable packaging due to growing environmental concerns.
- 2021: Several major players announced significant investments in lightweighting technologies.
- 2022: Launch of several innovative glass packaging designs catering to specific market needs.
- 2023: Several mergers and acquisitions reshaped the competitive landscape.
- 2024: Introduction of new recycling technologies enhancing the circular economy.
Strategic Outlook for Glass Bottles & Glass Packaging Market
The future of the glass bottles and glass packaging market is bright. Continued growth is expected, driven by sustainable packaging trends, technological advancements, and expanding end-use sectors. Companies that embrace innovation, prioritize sustainability, and strategically adapt to evolving consumer preferences are best positioned to capitalize on the market's growth potential. Focus on lightweighting, enhanced barrier properties, and innovative designs will be crucial for long-term success.
glass bottles glass packaging Segmentation
- 1. Application
- 2. Types
glass bottles glass packaging Segmentation By Geography
-
1. North America
- 1.1. United States
- 1.2. Canada
- 1.3. Mexico
-
2. South America
- 2.1. Brazil
- 2.2. Argentina
- 2.3. Rest of South America
-
3. Europe
- 3.1. United Kingdom
- 3.2. Germany
- 3.3. France
- 3.4. Italy
- 3.5. Spain
- 3.6. Russia
- 3.7. Benelux
- 3.8. Nordics
- 3.9. Rest of Europe
-
4. Middle East & Africa
- 4.1. Turkey
- 4.2. Israel
- 4.3. GCC
- 4.4. North Africa
- 4.5. South Africa
- 4.6. Rest of Middle East & Africa
-
5. Asia Pacific
- 5.1. China
- 5.2. India
- 5.3. Japan
- 5.4. South Korea
- 5.5. ASEAN
- 5.6. Oceania
- 5.7. Rest of Asia Pacific
glass bottles glass packaging Regional Market Share
Geographic Coverage of glass bottles glass packaging
glass bottles glass packaging REPORT HIGHLIGHTS
| Aspects | Details |
|---|---|
| Study Period | 2020-2034 |
| Base Year | 2025 |
| Estimated Year | 2026 |
| Forecast Period | 2026-2034 |
| Historical Period | 2020-2025 |
| Growth Rate | CAGR of 5.7% from 2020-2034 |
| Segmentation |
|
Table of Contents
- 1. Introduction
- 1.1. Research Scope
- 1.2. Market Segmentation
- 1.3. Research Objective
- 1.4. Definitions and Assumptions
- 2. Executive Summary
- 2.1. Market Snapshot
- 3. Market Dynamics
- 3.1. Market Drivers
- 3.2. Market Restrains
- 3.3. Market Trends
- 3.4. Market Opportunities
- 4. Market Factor Analysis
- 4.1. Porters Five Forces
- 4.1.1. Bargaining Power of Suppliers
- 4.1.2. Bargaining Power of Buyers
- 4.1.3. Threat of New Entrants
- 4.1.4. Threat of Substitutes
- 4.1.5. Competitive Rivalry
- 4.2. PESTEL analysis
- 4.3. BCG Analysis
- 4.3.1. Stars (High Growth, High Market Share)
- 4.3.2. Cash Cows (Low Growth, High Market Share)
- 4.3.3. Question Mark (High Growth, Low Market Share)
- 4.3.4. Dogs (Low Growth, Low Market Share)
- 4.4. Ansoff Matrix Analysis
- 4.5. Supply Chain Analysis
- 4.6. Regulatory Landscape
- 4.7. Current Market Potential and Opportunity Assessment (TAM–SAM–SOM Framework)
- 4.8. MDP Analyst Note
- 4.1. Porters Five Forces
- 5. Market Analysis, Insights and Forecast 2021-2033
- 5.1. Market Analysis, Insights and Forecast - by Application
- 5.2. Market Analysis, Insights and Forecast - by Types
- 5.3. Market Analysis, Insights and Forecast - by Region
- 5.3.1. North America
- 5.3.2. South America
- 5.3.3. Europe
- 5.3.4. Middle East & Africa
- 5.3.5. Asia Pacific
- 6. Global glass bottles glass packaging Analysis, Insights and Forecast, 2021-2033
- 6.1. Market Analysis, Insights and Forecast - by Application
- 6.2. Market Analysis, Insights and Forecast - by Types
- 7. North America glass bottles glass packaging Analysis, Insights and Forecast, 2020-2032
- 7.1. Market Analysis, Insights and Forecast - by Application
- 7.2. Market Analysis, Insights and Forecast - by Types
- 8. South America glass bottles glass packaging Analysis, Insights and Forecast, 2020-2032
- 8.1. Market Analysis, Insights and Forecast - by Application
- 8.2. Market Analysis, Insights and Forecast - by Types
- 9. Europe glass bottles glass packaging Analysis, Insights and Forecast, 2020-2032
- 9.1. Market Analysis, Insights and Forecast - by Application
- 9.2. Market Analysis, Insights and Forecast - by Types
- 10. Middle East & Africa glass bottles glass packaging Analysis, Insights and Forecast, 2020-2032
- 10.1. Market Analysis, Insights and Forecast - by Application
- 10.2. Market Analysis, Insights and Forecast - by Types
- 11. Asia Pacific glass bottles glass packaging Analysis, Insights and Forecast, 2020-2032
- 11.1. Market Analysis, Insights and Forecast - by Application
- 11.2. Market Analysis, Insights and Forecast - by Types
- 12. Competitive Analysis
- 12.1. Company Profiles
- 12.1.1 Owens-Illinois
- 12.1.1.1. Company Overview
- 12.1.1.2. Products
- 12.1.1.3. Company Financials
- 12.1.1.4. SWOT Analysis
- 12.1.2 Vidrala
- 12.1.2.1. Company Overview
- 12.1.2.2. Products
- 12.1.2.3. Company Financials
- 12.1.2.4. SWOT Analysis
- 12.1.3 Ardagh Group
- 12.1.3.1. Company Overview
- 12.1.3.2. Products
- 12.1.3.3. Company Financials
- 12.1.3.4. SWOT Analysis
- 12.1.4 Vitro packaging
- 12.1.4.1. Company Overview
- 12.1.4.2. Products
- 12.1.4.3. Company Financials
- 12.1.4.4. SWOT Analysis
- 12.1.5 Consol Glass
- 12.1.5.1. Company Overview
- 12.1.5.2. Products
- 12.1.5.3. Company Financials
- 12.1.5.4. SWOT Analysis
- 12.1.6 Zignago Vetro Group
- 12.1.6.1. Company Overview
- 12.1.6.2. Products
- 12.1.6.3. Company Financials
- 12.1.6.4. SWOT Analysis
- 12.1.7 Vetropack Group
- 12.1.7.1. Company Overview
- 12.1.7.2. Products
- 12.1.7.3. Company Financials
- 12.1.7.4. SWOT Analysis
- 12.1.8 Guangdong Huaxing
- 12.1.8.1. Company Overview
- 12.1.8.2. Products
- 12.1.8.3. Company Financials
- 12.1.8.4. SWOT Analysis
- 12.1.9 Yucai Group
- 12.1.9.1. Company Overview
- 12.1.9.2. Products
- 12.1.9.3. Company Financials
- 12.1.9.4. SWOT Analysis
- 12.1.10 Cangzhou Xingchen Glass
- 12.1.10.1. Company Overview
- 12.1.10.2. Products
- 12.1.10.3. Company Financials
- 12.1.10.4. SWOT Analysis
- 12.1.11 Cangzhou Four Stars Glass
- 12.1.11.1. Company Overview
- 12.1.11.2. Products
- 12.1.11.3. Company Financials
- 12.1.11.4. SWOT Analysis
- 12.1.12 Shandong Huapeng Glass
- 12.1.12.1. Company Overview
- 12.1.12.2. Products
- 12.1.12.3. Company Financials
- 12.1.12.4. SWOT Analysis
- 12.1.13 HEINZ-GLAS
- 12.1.13.1. Company Overview
- 12.1.13.2. Products
- 12.1.13.3. Company Financials
- 12.1.13.4. SWOT Analysis
- 12.1.14 Piramal Glass
- 12.1.14.1. Company Overview
- 12.1.14.2. Products
- 12.1.14.3. Company Financials
- 12.1.14.4. SWOT Analysis
- 12.1.15 SAVERGLASS Group
- 12.1.15.1. Company Overview
- 12.1.15.2. Products
- 12.1.15.3. Company Financials
- 12.1.15.4. SWOT Analysis
- 12.1.16 Bormioli Luigi
- 12.1.16.1. Company Overview
- 12.1.16.2. Products
- 12.1.16.3. Company Financials
- 12.1.16.4. SWOT Analysis
- 12.1.17 Stoelzle Glass Group
- 12.1.17.1. Company Overview
- 12.1.17.2. Products
- 12.1.17.3. Company Financials
- 12.1.17.4. SWOT Analysis
- 12.1.18 Carib Glassworks Limited
- 12.1.18.1. Company Overview
- 12.1.18.2. Products
- 12.1.18.3. Company Financials
- 12.1.18.4. SWOT Analysis
- 12.1.19 Gerresheimer
- 12.1.19.1. Company Overview
- 12.1.19.2. Products
- 12.1.19.3. Company Financials
- 12.1.19.4. SWOT Analysis
- 12.1.20 Toyo Glass
- 12.1.20.1. Company Overview
- 12.1.20.2. Products
- 12.1.20.3. Company Financials
- 12.1.20.4. SWOT Analysis
- 12.1.1 Owens-Illinois
- 12.2. Market Entropy
- 12.2.1 Company's Key Areas Served
- 12.2.2 Recent Developments
- 12.3. Company Market Share Analysis 2025
- 12.3.1 Top 5 Companies Market Share Analysis
- 12.3.2 Top 3 Companies Market Share Analysis
- 12.4. List of Potential Customers
- 13. Research Methodology
List of Figures
- Figure 1: Global glass bottles glass packaging Revenue Breakdown (billion, %) by Region 2025 & 2033
- Figure 2: Global glass bottles glass packaging Volume Breakdown (K, %) by Region 2025 & 2033
- Figure 3: North America glass bottles glass packaging Revenue (billion), by Application 2025 & 2033
- Figure 4: North America glass bottles glass packaging Volume (K), by Application 2025 & 2033
- Figure 5: North America glass bottles glass packaging Revenue Share (%), by Application 2025 & 2033
- Figure 6: North America glass bottles glass packaging Volume Share (%), by Application 2025 & 2033
- Figure 7: North America glass bottles glass packaging Revenue (billion), by Types 2025 & 2033
- Figure 8: North America glass bottles glass packaging Volume (K), by Types 2025 & 2033
- Figure 9: North America glass bottles glass packaging Revenue Share (%), by Types 2025 & 2033
- Figure 10: North America glass bottles glass packaging Volume Share (%), by Types 2025 & 2033
- Figure 11: North America glass bottles glass packaging Revenue (billion), by Country 2025 & 2033
- Figure 12: North America glass bottles glass packaging Volume (K), by Country 2025 & 2033
- Figure 13: North America glass bottles glass packaging Revenue Share (%), by Country 2025 & 2033
- Figure 14: North America glass bottles glass packaging Volume Share (%), by Country 2025 & 2033
- Figure 15: South America glass bottles glass packaging Revenue (billion), by Application 2025 & 2033
- Figure 16: South America glass bottles glass packaging Volume (K), by Application 2025 & 2033
- Figure 17: South America glass bottles glass packaging Revenue Share (%), by Application 2025 & 2033
- Figure 18: South America glass bottles glass packaging Volume Share (%), by Application 2025 & 2033
- Figure 19: South America glass bottles glass packaging Revenue (billion), by Types 2025 & 2033
- Figure 20: South America glass bottles glass packaging Volume (K), by Types 2025 & 2033
- Figure 21: South America glass bottles glass packaging Revenue Share (%), by Types 2025 & 2033
- Figure 22: South America glass bottles glass packaging Volume Share (%), by Types 2025 & 2033
- Figure 23: South America glass bottles glass packaging Revenue (billion), by Country 2025 & 2033
- Figure 24: South America glass bottles glass packaging Volume (K), by Country 2025 & 2033
- Figure 25: South America glass bottles glass packaging Revenue Share (%), by Country 2025 & 2033
- Figure 26: South America glass bottles glass packaging Volume Share (%), by Country 2025 & 2033
- Figure 27: Europe glass bottles glass packaging Revenue (billion), by Application 2025 & 2033
- Figure 28: Europe glass bottles glass packaging Volume (K), by Application 2025 & 2033
- Figure 29: Europe glass bottles glass packaging Revenue Share (%), by Application 2025 & 2033
- Figure 30: Europe glass bottles glass packaging Volume Share (%), by Application 2025 & 2033
- Figure 31: Europe glass bottles glass packaging Revenue (billion), by Types 2025 & 2033
- Figure 32: Europe glass bottles glass packaging Volume (K), by Types 2025 & 2033
- Figure 33: Europe glass bottles glass packaging Revenue Share (%), by Types 2025 & 2033
- Figure 34: Europe glass bottles glass packaging Volume Share (%), by Types 2025 & 2033
- Figure 35: Europe glass bottles glass packaging Revenue (billion), by Country 2025 & 2033
- Figure 36: Europe glass bottles glass packaging Volume (K), by Country 2025 & 2033
- Figure 37: Europe glass bottles glass packaging Revenue Share (%), by Country 2025 & 2033
- Figure 38: Europe glass bottles glass packaging Volume Share (%), by Country 2025 & 2033
- Figure 39: Middle East & Africa glass bottles glass packaging Revenue (billion), by Application 2025 & 2033
- Figure 40: Middle East & Africa glass bottles glass packaging Volume (K), by Application 2025 & 2033
- Figure 41: Middle East & Africa glass bottles glass packaging Revenue Share (%), by Application 2025 & 2033
- Figure 42: Middle East & Africa glass bottles glass packaging Volume Share (%), by Application 2025 & 2033
- Figure 43: Middle East & Africa glass bottles glass packaging Revenue (billion), by Types 2025 & 2033
- Figure 44: Middle East & Africa glass bottles glass packaging Volume (K), by Types 2025 & 2033
- Figure 45: Middle East & Africa glass bottles glass packaging Revenue Share (%), by Types 2025 & 2033
- Figure 46: Middle East & Africa glass bottles glass packaging Volume Share (%), by Types 2025 & 2033
- Figure 47: Middle East & Africa glass bottles glass packaging Revenue (billion), by Country 2025 & 2033
- Figure 48: Middle East & Africa glass bottles glass packaging Volume (K), by Country 2025 & 2033
- Figure 49: Middle East & Africa glass bottles glass packaging Revenue Share (%), by Country 2025 & 2033
- Figure 50: Middle East & Africa glass bottles glass packaging Volume Share (%), by Country 2025 & 2033
- Figure 51: Asia Pacific glass bottles glass packaging Revenue (billion), by Application 2025 & 2033
- Figure 52: Asia Pacific glass bottles glass packaging Volume (K), by Application 2025 & 2033
- Figure 53: Asia Pacific glass bottles glass packaging Revenue Share (%), by Application 2025 & 2033
- Figure 54: Asia Pacific glass bottles glass packaging Volume Share (%), by Application 2025 & 2033
- Figure 55: Asia Pacific glass bottles glass packaging Revenue (billion), by Types 2025 & 2033
- Figure 56: Asia Pacific glass bottles glass packaging Volume (K), by Types 2025 & 2033
- Figure 57: Asia Pacific glass bottles glass packaging Revenue Share (%), by Types 2025 & 2033
- Figure 58: Asia Pacific glass bottles glass packaging Volume Share (%), by Types 2025 & 2033
- Figure 59: Asia Pacific glass bottles glass packaging Revenue (billion), by Country 2025 & 2033
- Figure 60: Asia Pacific glass bottles glass packaging Volume (K), by Country 2025 & 2033
- Figure 61: Asia Pacific glass bottles glass packaging Revenue Share (%), by Country 2025 & 2033
- Figure 62: Asia Pacific glass bottles glass packaging Volume Share (%), by Country 2025 & 2033
List of Tables
- Table 1: Global glass bottles glass packaging Revenue billion Forecast, by Application 2020 & 2033
- Table 2: Global glass bottles glass packaging Volume K Forecast, by Application 2020 & 2033
- Table 3: Global glass bottles glass packaging Revenue billion Forecast, by Types 2020 & 2033
- Table 4: Global glass bottles glass packaging Volume K Forecast, by Types 2020 & 2033
- Table 5: Global glass bottles glass packaging Revenue billion Forecast, by Region 2020 & 2033
- Table 6: Global glass bottles glass packaging Volume K Forecast, by Region 2020 & 2033
- Table 7: Global glass bottles glass packaging Revenue billion Forecast, by Application 2020 & 2033
- Table 8: Global glass bottles glass packaging Volume K Forecast, by Application 2020 & 2033
- Table 9: Global glass bottles glass packaging Revenue billion Forecast, by Types 2020 & 2033
- Table 10: Global glass bottles glass packaging Volume K Forecast, by Types 2020 & 2033
- Table 11: Global glass bottles glass packaging Revenue billion Forecast, by Country 2020 & 2033
- Table 12: Global glass bottles glass packaging Volume K Forecast, by Country 2020 & 2033
- Table 13: United States glass bottles glass packaging Revenue (billion) Forecast, by Application 2020 & 2033
- Table 14: United States glass bottles glass packaging Volume (K) Forecast, by Application 2020 & 2033
- Table 15: Canada glass bottles glass packaging Revenue (billion) Forecast, by Application 2020 & 2033
- Table 16: Canada glass bottles glass packaging Volume (K) Forecast, by Application 2020 & 2033
- Table 17: Mexico glass bottles glass packaging Revenue (billion) Forecast, by Application 2020 & 2033
- Table 18: Mexico glass bottles glass packaging Volume (K) Forecast, by Application 2020 & 2033
- Table 19: Global glass bottles glass packaging Revenue billion Forecast, by Application 2020 & 2033
- Table 20: Global glass bottles glass packaging Volume K Forecast, by Application 2020 & 2033
- Table 21: Global glass bottles glass packaging Revenue billion Forecast, by Types 2020 & 2033
- Table 22: Global glass bottles glass packaging Volume K Forecast, by Types 2020 & 2033
- Table 23: Global glass bottles glass packaging Revenue billion Forecast, by Country 2020 & 2033
- Table 24: Global glass bottles glass packaging Volume K Forecast, by Country 2020 & 2033
- Table 25: Brazil glass bottles glass packaging Revenue (billion) Forecast, by Application 2020 & 2033
- Table 26: Brazil glass bottles glass packaging Volume (K) Forecast, by Application 2020 & 2033
- Table 27: Argentina glass bottles glass packaging Revenue (billion) Forecast, by Application 2020 & 2033
- Table 28: Argentina glass bottles glass packaging Volume (K) Forecast, by Application 2020 & 2033
- Table 29: Rest of South America glass bottles glass packaging Revenue (billion) Forecast, by Application 2020 & 2033
- Table 30: Rest of South America glass bottles glass packaging Volume (K) Forecast, by Application 2020 & 2033
- Table 31: Global glass bottles glass packaging Revenue billion Forecast, by Application 2020 & 2033
- Table 32: Global glass bottles glass packaging Volume K Forecast, by Application 2020 & 2033
- Table 33: Global glass bottles glass packaging Revenue billion Forecast, by Types 2020 & 2033
- Table 34: Global glass bottles glass packaging Volume K Forecast, by Types 2020 & 2033
- Table 35: Global glass bottles glass packaging Revenue billion Forecast, by Country 2020 & 2033
- Table 36: Global glass bottles glass packaging Volume K Forecast, by Country 2020 & 2033
- Table 37: United Kingdom glass bottles glass packaging Revenue (billion) Forecast, by Application 2020 & 2033
- Table 38: United Kingdom glass bottles glass packaging Volume (K) Forecast, by Application 2020 & 2033
- Table 39: Germany glass bottles glass packaging Revenue (billion) Forecast, by Application 2020 & 2033
- Table 40: Germany glass bottles glass packaging Volume (K) Forecast, by Application 2020 & 2033
- Table 41: France glass bottles glass packaging Revenue (billion) Forecast, by Application 2020 & 2033
- Table 42: France glass bottles glass packaging Volume (K) Forecast, by Application 2020 & 2033
- Table 43: Italy glass bottles glass packaging Revenue (billion) Forecast, by Application 2020 & 2033
- Table 44: Italy glass bottles glass packaging Volume (K) Forecast, by Application 2020 & 2033
- Table 45: Spain glass bottles glass packaging Revenue (billion) Forecast, by Application 2020 & 2033
- Table 46: Spain glass bottles glass packaging Volume (K) Forecast, by Application 2020 & 2033
- Table 47: Russia glass bottles glass packaging Revenue (billion) Forecast, by Application 2020 & 2033
- Table 48: Russia glass bottles glass packaging Volume (K) Forecast, by Application 2020 & 2033
- Table 49: Benelux glass bottles glass packaging Revenue (billion) Forecast, by Application 2020 & 2033
- Table 50: Benelux glass bottles glass packaging Volume (K) Forecast, by Application 2020 & 2033
- Table 51: Nordics glass bottles glass packaging Revenue (billion) Forecast, by Application 2020 & 2033
- Table 52: Nordics glass bottles glass packaging Volume (K) Forecast, by Application 2020 & 2033
- Table 53: Rest of Europe glass bottles glass packaging Revenue (billion) Forecast, by Application 2020 & 2033
- Table 54: Rest of Europe glass bottles glass packaging Volume (K) Forecast, by Application 2020 & 2033
- Table 55: Global glass bottles glass packaging Revenue billion Forecast, by Application 2020 & 2033
- Table 56: Global glass bottles glass packaging Volume K Forecast, by Application 2020 & 2033
- Table 57: Global glass bottles glass packaging Revenue billion Forecast, by Types 2020 & 2033
- Table 58: Global glass bottles glass packaging Volume K Forecast, by Types 2020 & 2033
- Table 59: Global glass bottles glass packaging Revenue billion Forecast, by Country 2020 & 2033
- Table 60: Global glass bottles glass packaging Volume K Forecast, by Country 2020 & 2033
- Table 61: Turkey glass bottles glass packaging Revenue (billion) Forecast, by Application 2020 & 2033
- Table 62: Turkey glass bottles glass packaging Volume (K) Forecast, by Application 2020 & 2033
- Table 63: Israel glass bottles glass packaging Revenue (billion) Forecast, by Application 2020 & 2033
- Table 64: Israel glass bottles glass packaging Volume (K) Forecast, by Application 2020 & 2033
- Table 65: GCC glass bottles glass packaging Revenue (billion) Forecast, by Application 2020 & 2033
- Table 66: GCC glass bottles glass packaging Volume (K) Forecast, by Application 2020 & 2033
- Table 67: North Africa glass bottles glass packaging Revenue (billion) Forecast, by Application 2020 & 2033
- Table 68: North Africa glass bottles glass packaging Volume (K) Forecast, by Application 2020 & 2033
- Table 69: South Africa glass bottles glass packaging Revenue (billion) Forecast, by Application 2020 & 2033
- Table 70: South Africa glass bottles glass packaging Volume (K) Forecast, by Application 2020 & 2033
- Table 71: Rest of Middle East & Africa glass bottles glass packaging Revenue (billion) Forecast, by Application 2020 & 2033
- Table 72: Rest of Middle East & Africa glass bottles glass packaging Volume (K) Forecast, by Application 2020 & 2033
- Table 73: Global glass bottles glass packaging Revenue billion Forecast, by Application 2020 & 2033
- Table 74: Global glass bottles glass packaging Volume K Forecast, by Application 2020 & 2033
- Table 75: Global glass bottles glass packaging Revenue billion Forecast, by Types 2020 & 2033
- Table 76: Global glass bottles glass packaging Volume K Forecast, by Types 2020 & 2033
- Table 77: Global glass bottles glass packaging Revenue billion Forecast, by Country 2020 & 2033
- Table 78: Global glass bottles glass packaging Volume K Forecast, by Country 2020 & 2033
- Table 79: China glass bottles glass packaging Revenue (billion) Forecast, by Application 2020 & 2033
- Table 80: China glass bottles glass packaging Volume (K) Forecast, by Application 2020 & 2033
- Table 81: India glass bottles glass packaging Revenue (billion) Forecast, by Application 2020 & 2033
- Table 82: India glass bottles glass packaging Volume (K) Forecast, by Application 2020 & 2033
- Table 83: Japan glass bottles glass packaging Revenue (billion) Forecast, by Application 2020 & 2033
- Table 84: Japan glass bottles glass packaging Volume (K) Forecast, by Application 2020 & 2033
- Table 85: South Korea glass bottles glass packaging Revenue (billion) Forecast, by Application 2020 & 2033
- Table 86: South Korea glass bottles glass packaging Volume (K) Forecast, by Application 2020 & 2033
- Table 87: ASEAN glass bottles glass packaging Revenue (billion) Forecast, by Application 2020 & 2033
- Table 88: ASEAN glass bottles glass packaging Volume (K) Forecast, by Application 2020 & 2033
- Table 89: Oceania glass bottles glass packaging Revenue (billion) Forecast, by Application 2020 & 2033
- Table 90: Oceania glass bottles glass packaging Volume (K) Forecast, by Application 2020 & 2033
- Table 91: Rest of Asia Pacific glass bottles glass packaging Revenue (billion) Forecast, by Application 2020 & 2033
- Table 92: Rest of Asia Pacific glass bottles glass packaging Volume (K) Forecast, by Application 2020 & 2033
Frequently Asked Questions
1. What is the projected Compound Annual Growth Rate (CAGR) of the glass bottles glass packaging?
The projected CAGR is approximately 5.7%.
2. Which companies are prominent players in the glass bottles glass packaging?
Key companies in the market include Owens-Illinois, Vidrala, Ardagh Group, Vitro packaging, Consol Glass, Zignago Vetro Group, Vetropack Group, Guangdong Huaxing, Yucai Group, Cangzhou Xingchen Glass, Cangzhou Four Stars Glass, Shandong Huapeng Glass, HEINZ-GLAS, Piramal Glass, SAVERGLASS Group, Bormioli Luigi, Stoelzle Glass Group, Carib Glassworks Limited, Gerresheimer, Toyo Glass.
3. What are the main segments of the glass bottles glass packaging?
The market segments include Application, Types.
4. Can you provide details about the market size?
The market size is estimated to be USD 44.9 billion as of 2022.
5. What are some drivers contributing to market growth?
N/A
6. What are the notable trends driving market growth?
N/A
7. Are there any restraints impacting market growth?
N/A
8. Can you provide examples of recent developments in the market?
N/A
9. What pricing options are available for accessing the report?
Pricing options include single-user, multi-user, and enterprise licenses priced at USD 4350.00, USD 6525.00, and USD 8700.00 respectively.
10. Is the market size provided in terms of value or volume?
The market size is provided in terms of value, measured in billion and volume, measured in K.
11. Are there any specific market keywords associated with the report?
Yes, the market keyword associated with the report is "glass bottles glass packaging," which aids in identifying and referencing the specific market segment covered.
12. How do I determine which pricing option suits my needs best?
The pricing options vary based on user requirements and access needs. Individual users may opt for single-user licenses, while businesses requiring broader access may choose multi-user or enterprise licenses for cost-effective access to the report.
13. Are there any additional resources or data provided in the glass bottles glass packaging report?
While the report offers comprehensive insights, it's advisable to review the specific contents or supplementary materials provided to ascertain if additional resources or data are available.
14. How can I stay updated on further developments or reports in the glass bottles glass packaging?
To stay informed about further developments, trends, and reports in the glass bottles glass packaging, consider subscribing to industry newsletters, following relevant companies and organizations, or regularly checking reputable industry news sources and publications.
Methodology
Step 1 - Identification of Relevant Samples Size from Population Database


Step 2 - Approaches for Defining Global Market Size (Value, Volume* & Price*)

Note*: In applicable scenarios
Step 3 - Data Sources
Primary Research
- Web Analytics
- Survey Reports
- Research Institute
- Latest Research Reports
- Opinion Leaders
Secondary Research
- Annual Reports
- White Paper
- Latest Press Release
- Industry Association
- Paid Database
- Investor Presentations

Step 4 - Data Triangulation
Involves using different sources of information in order to increase the validity of a study
These sources are likely to be stakeholders in a program - participants, other researchers, program staff, other community members, and so on.
Then we put all data in single framework & apply various statistical tools to find out the dynamic on the market.
During the analysis stage, feedback from the stakeholder groups would be compared to determine areas of agreement as well as areas of divergence