

Key Insights
The flow battery market is experiencing robust growth, projected to reach a substantial size driven by increasing demand for energy storage solutions. The market's Compound Annual Growth Rate (CAGR) of 15.41% from 2019 to 2024 indicates a significant upward trajectory. This growth is fueled by several key factors, including the rising adoption of renewable energy sources (solar and wind power), the need for grid stabilization and improved energy efficiency, and the increasing concerns surrounding climate change and the transition to a greener energy future. Different flow battery chemistries, such as vanadium redox flow batteries, zinc bromine flow batteries, and iron flow batteries, cater to diverse applications and market segments. While vanadium redox flow batteries currently hold a significant market share due to their longer lifespan and higher efficiency, other technologies are rapidly evolving, presenting promising alternatives with cost advantages. Geographic distribution shows North America and Europe as leading markets, driven by strong government policies supporting renewable energy integration and the presence of established energy storage infrastructure. However, Asia-Pacific is expected to witness significant growth in the coming years due to its rapid industrialization and increasing renewable energy deployment. The market faces challenges such as the relatively high initial investment costs associated with flow battery systems compared to other energy storage technologies. However, ongoing technological advancements, economies of scale, and supportive government incentives are expected to mitigate these challenges, propelling further market expansion.
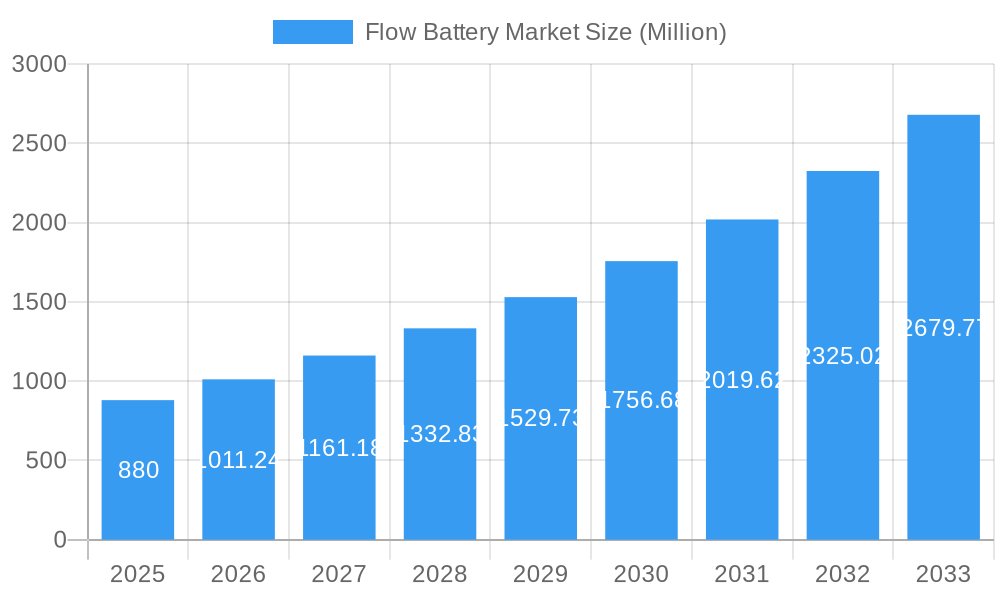
Flow Battery Market Market Size (In Million)
The competitive landscape is marked by a mix of established players and emerging companies actively involved in research and development, manufacturing, and deployment of flow battery systems. Key players are continuously striving to improve the performance, cost-effectiveness, and scalability of their technologies to gain a competitive edge. Strategic partnerships, mergers, and acquisitions are also anticipated to shape the market dynamics in the coming years. The forecast period of 2025-2033 promises further expansion, with emerging economies contributing significantly to the overall market growth. Technological innovations focused on improving energy density, reducing costs, and enhancing the lifespan of flow batteries will be crucial in driving wider adoption across various applications, including grid-scale energy storage, residential energy storage, and industrial applications.
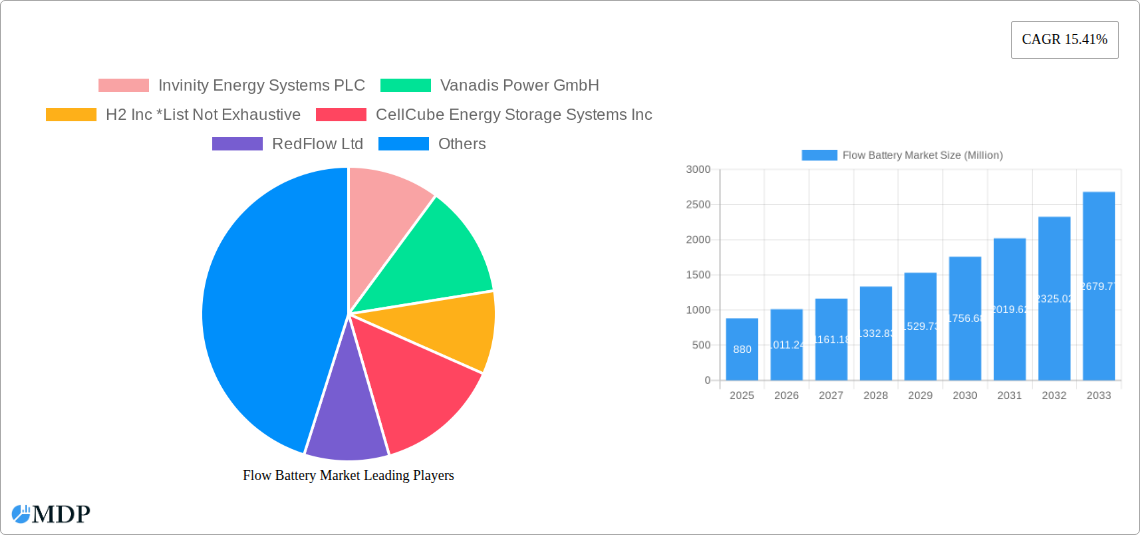
Flow Battery Market Company Market Share
Flow Battery Market Report: 2019-2033 Forecast
This comprehensive report provides a detailed analysis of the global flow battery market, offering invaluable insights for stakeholders across the energy storage sector. With a study period spanning 2019-2033, a base year of 2025, and a forecast period of 2025-2033, this report meticulously examines market dynamics, technological advancements, and key players shaping the future of energy storage. The report leverages extensive data and in-depth analysis to paint a clear picture of market trends and future opportunities, projecting a xx Million market value by 2033.
Flow Battery Market Market Dynamics & Concentration
The flow battery market is characterized by moderate concentration, with several key players vying for market share. Innovation is a significant driver, fueled by the need for long-duration energy storage solutions to support renewable energy integration. Stringent environmental regulations globally are also pushing adoption. Product substitutes, such as lithium-ion batteries, present significant competition, however, flow batteries offer unique advantages in terms of long duration storage and scalability. End-user trends show a growing demand across various sectors, including utility-scale energy storage, industrial applications, and microgrids. Mergers and acquisitions (M&A) activity has been steadily increasing, indicating consolidation within the industry.
- Market Share: The top 5 players account for approximately xx% of the market share in 2025.
- M&A Activity: An average of xx M&A deals were recorded annually during the historical period (2019-2024). This number is expected to increase to xx annually during the forecast period (2025-2033).
- Innovation Drivers: Advancements in electrode materials, membrane technology, and system design are driving cost reductions and performance enhancements.
- Regulatory Framework: Government policies supporting renewable energy integration and energy storage deployment are pivotal in driving market growth.
Flow Battery Market Industry Trends & Analysis
The flow battery market is experiencing robust growth, driven by the increasing demand for long-duration energy storage. Technological advancements, particularly in vanadium redox flow batteries (VRFBs), are improving efficiency and reducing costs. Consumer preferences are shifting towards sustainable and reliable energy solutions, creating a favorable environment for flow battery adoption. Competitive dynamics are characterized by both cooperation and competition, with companies focusing on strategic partnerships and technological differentiation.
The market is anticipated to witness a CAGR of xx% during the forecast period (2025-2033), with market penetration increasing from xx% in 2025 to xx% by 2033. Key factors contributing to this growth include decreasing battery costs, improved energy density, and expanding applications in various sectors. Technological disruptions are also expected, with ongoing research and development leading to new materials and improved battery architectures.
Leading Markets & Segments in Flow Battery Market
The North American region currently holds a dominant position in the flow battery market, driven by supportive government policies and a robust renewable energy sector. Within the market segments, vanadium redox flow batteries (VRFBs) constitute the largest share, benefiting from mature technology, and reliable performance.
Key Drivers in North America:
- Strong government incentives for renewable energy and energy storage deployment.
- Significant investments in grid modernization and smart grid technologies.
- Growing demand from utility-scale energy storage projects.
Vanadium Redox Flow Battery Dominance: The higher energy density and longer lifespan of VRFBs compared to other flow battery technologies contribute to their market leadership. Further technological advancements are expected to solidify this position. Other segments, including zinc bromine and iron flow batteries are also expected to experience growth, however, at a slower rate than VRFBs.
Flow Battery Market Product Developments
Recent advancements in flow battery technology have focused on improving energy density, cycle life, and reducing manufacturing costs. New materials and designs are being developed to enhance performance and address specific application needs. These innovations are expanding the market reach of flow batteries into various sectors, including grid-scale energy storage, industrial backup power, and microgrids. Companies are increasingly focusing on developing modular and scalable systems to meet diverse customer requirements.
Key Drivers of Flow Battery Market Growth
Several factors are driving the growth of the flow battery market. Firstly, the increasing penetration of renewable energy sources, such as solar and wind, necessitates reliable and long-duration energy storage solutions. Secondly, government policies and regulations promoting clean energy technologies are creating a favorable regulatory environment. Finally, advancements in battery technology, leading to cost reductions and improved performance, are making flow batteries increasingly competitive.
Challenges in the Flow Battery Market Market
Despite the significant growth potential, the flow battery market faces certain challenges. High initial capital costs remain a barrier to widespread adoption, particularly for smaller-scale applications. Supply chain constraints for critical materials, such as vanadium, can also affect production and market availability. Competition from other energy storage technologies, particularly lithium-ion batteries, poses a significant challenge. The market is estimated to experience a xx% reduction in growth due to these challenges within the forecast period.
Emerging Opportunities in Flow Battery Market
The flow battery market presents several promising opportunities for long-term growth. Technological breakthroughs, such as the development of more efficient and cost-effective materials, will continue to drive market expansion. Strategic partnerships between battery manufacturers and energy providers are creating new market access and enhancing market penetration. The expansion into new geographic regions and application areas, such as remote communities and industrial settings, will further fuel market growth.
Leading Players in the Flow Battery Market Sector
- Invinity Energy Systems PLC
- Vanadis Power GmbH
- H2 Inc
- CellCube Energy Storage Systems Inc
- RedFlow Ltd
- ESS Tech Inc
- Dalian Rongke Power Co Ltd
- Stryten Energy
- Primus Power Corporation
- VRB Energy
Key Milestones in Flow Battery Market Industry
- September 2022: CellCube's R&D partnership in Australia for a 2 MW/8 MWh VRFB system pilot project signals expansion into the Australian long-duration energy storage market.
- November 2022: Tdafoq Energy's distribution and manufacturing license agreement with Delectrik Systems, coupled with plans for a Saudi Arabian GWh-scale manufacturing plant by 2025, demonstrates significant expansion into the Gulf region.
Strategic Outlook for Flow Battery Market Market
The flow battery market is poised for substantial growth over the next decade, driven by the increasing need for long-duration energy storage and supportive government policies. Strategic partnerships, technological advancements, and market expansion into new geographic regions will be key to unlocking the full potential of this sector. Focus on cost reduction, improved performance, and increased scalability will be crucial factors for companies seeking to capitalize on the burgeoning opportunities in the flow battery market.
Flow Battery Market Segmentation
- 1. Production Analysis
- 2. Consumption Analysis
- 3. Import Market Analysis (Value & Volume)
- 4. Export Market Analysis (Value & Volume)
- 5. Price Trend Analysis
Flow Battery Market Segmentation By Geography
- 1. North America
- 2. Europe
- 3. Asia Pacific
- 4. South America
- 5. Middle East and Africa
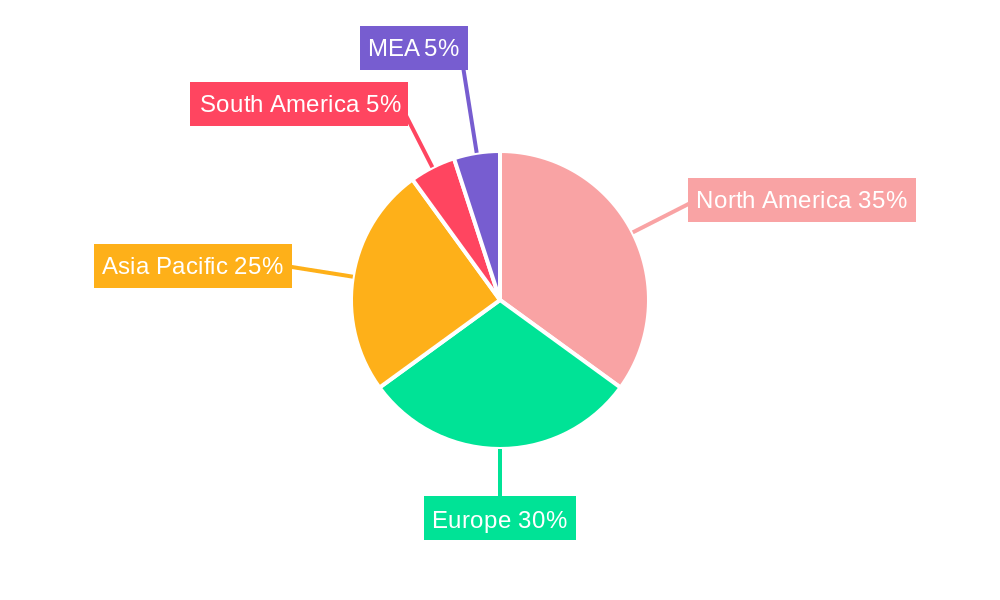
Flow Battery Market Regional Market Share
Geographic Coverage of Flow Battery Market
Flow Battery Market REPORT HIGHLIGHTS
| Aspects | Details |
|---|---|
| Study Period | 2020-2034 |
| Base Year | 2025 |
| Estimated Year | 2026 |
| Forecast Period | 2026-2034 |
| Historical Period | 2020-2025 |
| Growth Rate | CAGR of 15.41% from 2020-2034 |
| Segmentation |
|
Table of Contents
- 1. Introduction
- 1.1. Research Scope
- 1.2. Market Segmentation
- 1.3. Research Objective
- 1.4. Definitions and Assumptions
- 2. Executive Summary
- 2.1. Market Snapshot
- 3. Market Dynamics
- 3.1. Market Drivers
- 3.2. Market Restrains
- 3.3. Market Trends
- 3.4. Market Opportunities
- 4. Market Factor Analysis
- 4.1. Porters Five Forces
- 4.1.1. Bargaining Power of Suppliers
- 4.1.2. Bargaining Power of Buyers
- 4.1.3. Threat of New Entrants
- 4.1.4. Threat of Substitutes
- 4.1.5. Competitive Rivalry
- 4.2. PESTEL analysis
- 4.3. BCG Analysis
- 4.3.1. Stars (High Growth, High Market Share)
- 4.3.2. Cash Cows (Low Growth, High Market Share)
- 4.3.3. Question Mark (High Growth, Low Market Share)
- 4.3.4. Dogs (Low Growth, Low Market Share)
- 4.4. Ansoff Matrix Analysis
- 4.5. Supply Chain Analysis
- 4.6. Regulatory Landscape
- 4.7. Current Market Potential and Opportunity Assessment (TAM–SAM–SOM Framework)
- 4.8. MDP Analyst Note
- 4.1. Porters Five Forces
- 5. Market Analysis, Insights and Forecast 2021-2033
- 5.1. Market Analysis, Insights and Forecast - by Production Analysis
- 5.2. Market Analysis, Insights and Forecast - by Consumption Analysis
- 5.3. Market Analysis, Insights and Forecast - by Import Market Analysis (Value & Volume)
- 5.4. Market Analysis, Insights and Forecast - by Export Market Analysis (Value & Volume)
- 5.5. Market Analysis, Insights and Forecast - by Price Trend Analysis
- 5.6. Market Analysis, Insights and Forecast - by Region
- 5.6.1. North America
- 5.6.2. Europe
- 5.6.3. Asia Pacific
- 5.6.4. South America
- 5.6.5. Middle East and Africa
- 6. Global Flow Battery Market Analysis, Insights and Forecast, 2021-2033
- 6.1. Market Analysis, Insights and Forecast - by Production Analysis
- 6.2. Market Analysis, Insights and Forecast - by Consumption Analysis
- 6.3. Market Analysis, Insights and Forecast - by Import Market Analysis (Value & Volume)
- 6.4. Market Analysis, Insights and Forecast - by Export Market Analysis (Value & Volume)
- 6.5. Market Analysis, Insights and Forecast - by Price Trend Analysis
- 7. North America Flow Battery Market Analysis, Insights and Forecast, 2020-2032
- 7.1. Market Analysis, Insights and Forecast - by Production Analysis
- 7.2. Market Analysis, Insights and Forecast - by Consumption Analysis
- 7.3. Market Analysis, Insights and Forecast - by Import Market Analysis (Value & Volume)
- 7.4. Market Analysis, Insights and Forecast - by Export Market Analysis (Value & Volume)
- 7.5. Market Analysis, Insights and Forecast - by Price Trend Analysis
- 8. Europe Flow Battery Market Analysis, Insights and Forecast, 2020-2032
- 8.1. Market Analysis, Insights and Forecast - by Production Analysis
- 8.2. Market Analysis, Insights and Forecast - by Consumption Analysis
- 8.3. Market Analysis, Insights and Forecast - by Import Market Analysis (Value & Volume)
- 8.4. Market Analysis, Insights and Forecast - by Export Market Analysis (Value & Volume)
- 8.5. Market Analysis, Insights and Forecast - by Price Trend Analysis
- 9. Asia Pacific Flow Battery Market Analysis, Insights and Forecast, 2020-2032
- 9.1. Market Analysis, Insights and Forecast - by Production Analysis
- 9.2. Market Analysis, Insights and Forecast - by Consumption Analysis
- 9.3. Market Analysis, Insights and Forecast - by Import Market Analysis (Value & Volume)
- 9.4. Market Analysis, Insights and Forecast - by Export Market Analysis (Value & Volume)
- 9.5. Market Analysis, Insights and Forecast - by Price Trend Analysis
- 10. South America Flow Battery Market Analysis, Insights and Forecast, 2020-2032
- 10.1. Market Analysis, Insights and Forecast - by Production Analysis
- 10.2. Market Analysis, Insights and Forecast - by Consumption Analysis
- 10.3. Market Analysis, Insights and Forecast - by Import Market Analysis (Value & Volume)
- 10.4. Market Analysis, Insights and Forecast - by Export Market Analysis (Value & Volume)
- 10.5. Market Analysis, Insights and Forecast - by Price Trend Analysis
- 11. Middle East and Africa Flow Battery Market Analysis, Insights and Forecast, 2020-2032
- 11.1. Market Analysis, Insights and Forecast - by Production Analysis
- 11.2. Market Analysis, Insights and Forecast - by Consumption Analysis
- 11.3. Market Analysis, Insights and Forecast - by Import Market Analysis (Value & Volume)
- 11.4. Market Analysis, Insights and Forecast - by Export Market Analysis (Value & Volume)
- 11.5. Market Analysis, Insights and Forecast - by Price Trend Analysis
- 12. Competitive Analysis
- 12.1. Company Profiles
- 12.1.1 Invinity Energy Systems PLC
- 12.1.1.1. Company Overview
- 12.1.1.2. Products
- 12.1.1.3. Company Financials
- 12.1.1.4. SWOT Analysis
- 12.1.2 Vanadis Power GmbH
- 12.1.2.1. Company Overview
- 12.1.2.2. Products
- 12.1.2.3. Company Financials
- 12.1.2.4. SWOT Analysis
- 12.1.3 H2 Inc *List Not Exhaustive
- 12.1.3.1. Company Overview
- 12.1.3.2. Products
- 12.1.3.3. Company Financials
- 12.1.3.4. SWOT Analysis
- 12.1.4 CellCube Energy Storage Systems Inc
- 12.1.4.1. Company Overview
- 12.1.4.2. Products
- 12.1.4.3. Company Financials
- 12.1.4.4. SWOT Analysis
- 12.1.5 RedFlow Ltd
- 12.1.5.1. Company Overview
- 12.1.5.2. Products
- 12.1.5.3. Company Financials
- 12.1.5.4. SWOT Analysis
- 12.1.6 ESS Tech Inc
- 12.1.6.1. Company Overview
- 12.1.6.2. Products
- 12.1.6.3. Company Financials
- 12.1.6.4. SWOT Analysis
- 12.1.7 Dalian Rongke Power Co Ltd
- 12.1.7.1. Company Overview
- 12.1.7.2. Products
- 12.1.7.3. Company Financials
- 12.1.7.4. SWOT Analysis
- 12.1.8 Stryten Energy
- 12.1.8.1. Company Overview
- 12.1.8.2. Products
- 12.1.8.3. Company Financials
- 12.1.8.4. SWOT Analysis
- 12.1.9 Primus Power Corporation
- 12.1.9.1. Company Overview
- 12.1.9.2. Products
- 12.1.9.3. Company Financials
- 12.1.9.4. SWOT Analysis
- 12.1.10 VRB Energy
- 12.1.10.1. Company Overview
- 12.1.10.2. Products
- 12.1.10.3. Company Financials
- 12.1.10.4. SWOT Analysis
- 12.1.1 Invinity Energy Systems PLC
- 12.2. Market Entropy
- 12.2.1 Company's Key Areas Served
- 12.2.2 Recent Developments
- 12.3. Company Market Share Analysis 2025
- 12.3.1 Top 5 Companies Market Share Analysis
- 12.3.2 Top 3 Companies Market Share Analysis
- 12.4. List of Potential Customers
- 13. Research Methodology
List of Figures
- Figure 1: Global Flow Battery Market Revenue Breakdown (Million, %) by Region 2025 & 2033
- Figure 2: Global Flow Battery Market Volume Breakdown (K Units, %) by Region 2025 & 2033
- Figure 3: North America Flow Battery Market Revenue (Million), by Production Analysis 2025 & 2033
- Figure 4: North America Flow Battery Market Volume (K Units), by Production Analysis 2025 & 2033
- Figure 5: North America Flow Battery Market Revenue Share (%), by Production Analysis 2025 & 2033
- Figure 6: North America Flow Battery Market Volume Share (%), by Production Analysis 2025 & 2033
- Figure 7: North America Flow Battery Market Revenue (Million), by Consumption Analysis 2025 & 2033
- Figure 8: North America Flow Battery Market Volume (K Units), by Consumption Analysis 2025 & 2033
- Figure 9: North America Flow Battery Market Revenue Share (%), by Consumption Analysis 2025 & 2033
- Figure 10: North America Flow Battery Market Volume Share (%), by Consumption Analysis 2025 & 2033
- Figure 11: North America Flow Battery Market Revenue (Million), by Import Market Analysis (Value & Volume) 2025 & 2033
- Figure 12: North America Flow Battery Market Volume (K Units), by Import Market Analysis (Value & Volume) 2025 & 2033
- Figure 13: North America Flow Battery Market Revenue Share (%), by Import Market Analysis (Value & Volume) 2025 & 2033
- Figure 14: North America Flow Battery Market Volume Share (%), by Import Market Analysis (Value & Volume) 2025 & 2033
- Figure 15: North America Flow Battery Market Revenue (Million), by Export Market Analysis (Value & Volume) 2025 & 2033
- Figure 16: North America Flow Battery Market Volume (K Units), by Export Market Analysis (Value & Volume) 2025 & 2033
- Figure 17: North America Flow Battery Market Revenue Share (%), by Export Market Analysis (Value & Volume) 2025 & 2033
- Figure 18: North America Flow Battery Market Volume Share (%), by Export Market Analysis (Value & Volume) 2025 & 2033
- Figure 19: North America Flow Battery Market Revenue (Million), by Price Trend Analysis 2025 & 2033
- Figure 20: North America Flow Battery Market Volume (K Units), by Price Trend Analysis 2025 & 2033
- Figure 21: North America Flow Battery Market Revenue Share (%), by Price Trend Analysis 2025 & 2033
- Figure 22: North America Flow Battery Market Volume Share (%), by Price Trend Analysis 2025 & 2033
- Figure 23: North America Flow Battery Market Revenue (Million), by Country 2025 & 2033
- Figure 24: North America Flow Battery Market Volume (K Units), by Country 2025 & 2033
- Figure 25: North America Flow Battery Market Revenue Share (%), by Country 2025 & 2033
- Figure 26: North America Flow Battery Market Volume Share (%), by Country 2025 & 2033
- Figure 27: Europe Flow Battery Market Revenue (Million), by Production Analysis 2025 & 2033
- Figure 28: Europe Flow Battery Market Volume (K Units), by Production Analysis 2025 & 2033
- Figure 29: Europe Flow Battery Market Revenue Share (%), by Production Analysis 2025 & 2033
- Figure 30: Europe Flow Battery Market Volume Share (%), by Production Analysis 2025 & 2033
- Figure 31: Europe Flow Battery Market Revenue (Million), by Consumption Analysis 2025 & 2033
- Figure 32: Europe Flow Battery Market Volume (K Units), by Consumption Analysis 2025 & 2033
- Figure 33: Europe Flow Battery Market Revenue Share (%), by Consumption Analysis 2025 & 2033
- Figure 34: Europe Flow Battery Market Volume Share (%), by Consumption Analysis 2025 & 2033
- Figure 35: Europe Flow Battery Market Revenue (Million), by Import Market Analysis (Value & Volume) 2025 & 2033
- Figure 36: Europe Flow Battery Market Volume (K Units), by Import Market Analysis (Value & Volume) 2025 & 2033
- Figure 37: Europe Flow Battery Market Revenue Share (%), by Import Market Analysis (Value & Volume) 2025 & 2033
- Figure 38: Europe Flow Battery Market Volume Share (%), by Import Market Analysis (Value & Volume) 2025 & 2033
- Figure 39: Europe Flow Battery Market Revenue (Million), by Export Market Analysis (Value & Volume) 2025 & 2033
- Figure 40: Europe Flow Battery Market Volume (K Units), by Export Market Analysis (Value & Volume) 2025 & 2033
- Figure 41: Europe Flow Battery Market Revenue Share (%), by Export Market Analysis (Value & Volume) 2025 & 2033
- Figure 42: Europe Flow Battery Market Volume Share (%), by Export Market Analysis (Value & Volume) 2025 & 2033
- Figure 43: Europe Flow Battery Market Revenue (Million), by Price Trend Analysis 2025 & 2033
- Figure 44: Europe Flow Battery Market Volume (K Units), by Price Trend Analysis 2025 & 2033
- Figure 45: Europe Flow Battery Market Revenue Share (%), by Price Trend Analysis 2025 & 2033
- Figure 46: Europe Flow Battery Market Volume Share (%), by Price Trend Analysis 2025 & 2033
- Figure 47: Europe Flow Battery Market Revenue (Million), by Country 2025 & 2033
- Figure 48: Europe Flow Battery Market Volume (K Units), by Country 2025 & 2033
- Figure 49: Europe Flow Battery Market Revenue Share (%), by Country 2025 & 2033
- Figure 50: Europe Flow Battery Market Volume Share (%), by Country 2025 & 2033
- Figure 51: Asia Pacific Flow Battery Market Revenue (Million), by Production Analysis 2025 & 2033
- Figure 52: Asia Pacific Flow Battery Market Volume (K Units), by Production Analysis 2025 & 2033
- Figure 53: Asia Pacific Flow Battery Market Revenue Share (%), by Production Analysis 2025 & 2033
- Figure 54: Asia Pacific Flow Battery Market Volume Share (%), by Production Analysis 2025 & 2033
- Figure 55: Asia Pacific Flow Battery Market Revenue (Million), by Consumption Analysis 2025 & 2033
- Figure 56: Asia Pacific Flow Battery Market Volume (K Units), by Consumption Analysis 2025 & 2033
- Figure 57: Asia Pacific Flow Battery Market Revenue Share (%), by Consumption Analysis 2025 & 2033
- Figure 58: Asia Pacific Flow Battery Market Volume Share (%), by Consumption Analysis 2025 & 2033
- Figure 59: Asia Pacific Flow Battery Market Revenue (Million), by Import Market Analysis (Value & Volume) 2025 & 2033
- Figure 60: Asia Pacific Flow Battery Market Volume (K Units), by Import Market Analysis (Value & Volume) 2025 & 2033
- Figure 61: Asia Pacific Flow Battery Market Revenue Share (%), by Import Market Analysis (Value & Volume) 2025 & 2033
- Figure 62: Asia Pacific Flow Battery Market Volume Share (%), by Import Market Analysis (Value & Volume) 2025 & 2033
- Figure 63: Asia Pacific Flow Battery Market Revenue (Million), by Export Market Analysis (Value & Volume) 2025 & 2033
- Figure 64: Asia Pacific Flow Battery Market Volume (K Units), by Export Market Analysis (Value & Volume) 2025 & 2033
- Figure 65: Asia Pacific Flow Battery Market Revenue Share (%), by Export Market Analysis (Value & Volume) 2025 & 2033
- Figure 66: Asia Pacific Flow Battery Market Volume Share (%), by Export Market Analysis (Value & Volume) 2025 & 2033
- Figure 67: Asia Pacific Flow Battery Market Revenue (Million), by Price Trend Analysis 2025 & 2033
- Figure 68: Asia Pacific Flow Battery Market Volume (K Units), by Price Trend Analysis 2025 & 2033
- Figure 69: Asia Pacific Flow Battery Market Revenue Share (%), by Price Trend Analysis 2025 & 2033
- Figure 70: Asia Pacific Flow Battery Market Volume Share (%), by Price Trend Analysis 2025 & 2033
- Figure 71: Asia Pacific Flow Battery Market Revenue (Million), by Country 2025 & 2033
- Figure 72: Asia Pacific Flow Battery Market Volume (K Units), by Country 2025 & 2033
- Figure 73: Asia Pacific Flow Battery Market Revenue Share (%), by Country 2025 & 2033
- Figure 74: Asia Pacific Flow Battery Market Volume Share (%), by Country 2025 & 2033
- Figure 75: South America Flow Battery Market Revenue (Million), by Production Analysis 2025 & 2033
- Figure 76: South America Flow Battery Market Volume (K Units), by Production Analysis 2025 & 2033
- Figure 77: South America Flow Battery Market Revenue Share (%), by Production Analysis 2025 & 2033
- Figure 78: South America Flow Battery Market Volume Share (%), by Production Analysis 2025 & 2033
- Figure 79: South America Flow Battery Market Revenue (Million), by Consumption Analysis 2025 & 2033
- Figure 80: South America Flow Battery Market Volume (K Units), by Consumption Analysis 2025 & 2033
- Figure 81: South America Flow Battery Market Revenue Share (%), by Consumption Analysis 2025 & 2033
- Figure 82: South America Flow Battery Market Volume Share (%), by Consumption Analysis 2025 & 2033
- Figure 83: South America Flow Battery Market Revenue (Million), by Import Market Analysis (Value & Volume) 2025 & 2033
- Figure 84: South America Flow Battery Market Volume (K Units), by Import Market Analysis (Value & Volume) 2025 & 2033
- Figure 85: South America Flow Battery Market Revenue Share (%), by Import Market Analysis (Value & Volume) 2025 & 2033
- Figure 86: South America Flow Battery Market Volume Share (%), by Import Market Analysis (Value & Volume) 2025 & 2033
- Figure 87: South America Flow Battery Market Revenue (Million), by Export Market Analysis (Value & Volume) 2025 & 2033
- Figure 88: South America Flow Battery Market Volume (K Units), by Export Market Analysis (Value & Volume) 2025 & 2033
- Figure 89: South America Flow Battery Market Revenue Share (%), by Export Market Analysis (Value & Volume) 2025 & 2033
- Figure 90: South America Flow Battery Market Volume Share (%), by Export Market Analysis (Value & Volume) 2025 & 2033
- Figure 91: South America Flow Battery Market Revenue (Million), by Price Trend Analysis 2025 & 2033
- Figure 92: South America Flow Battery Market Volume (K Units), by Price Trend Analysis 2025 & 2033
- Figure 93: South America Flow Battery Market Revenue Share (%), by Price Trend Analysis 2025 & 2033
- Figure 94: South America Flow Battery Market Volume Share (%), by Price Trend Analysis 2025 & 2033
- Figure 95: South America Flow Battery Market Revenue (Million), by Country 2025 & 2033
- Figure 96: South America Flow Battery Market Volume (K Units), by Country 2025 & 2033
- Figure 97: South America Flow Battery Market Revenue Share (%), by Country 2025 & 2033
- Figure 98: South America Flow Battery Market Volume Share (%), by Country 2025 & 2033
- Figure 99: Middle East and Africa Flow Battery Market Revenue (Million), by Production Analysis 2025 & 2033
- Figure 100: Middle East and Africa Flow Battery Market Volume (K Units), by Production Analysis 2025 & 2033
- Figure 101: Middle East and Africa Flow Battery Market Revenue Share (%), by Production Analysis 2025 & 2033
- Figure 102: Middle East and Africa Flow Battery Market Volume Share (%), by Production Analysis 2025 & 2033
- Figure 103: Middle East and Africa Flow Battery Market Revenue (Million), by Consumption Analysis 2025 & 2033
- Figure 104: Middle East and Africa Flow Battery Market Volume (K Units), by Consumption Analysis 2025 & 2033
- Figure 105: Middle East and Africa Flow Battery Market Revenue Share (%), by Consumption Analysis 2025 & 2033
- Figure 106: Middle East and Africa Flow Battery Market Volume Share (%), by Consumption Analysis 2025 & 2033
- Figure 107: Middle East and Africa Flow Battery Market Revenue (Million), by Import Market Analysis (Value & Volume) 2025 & 2033
- Figure 108: Middle East and Africa Flow Battery Market Volume (K Units), by Import Market Analysis (Value & Volume) 2025 & 2033
- Figure 109: Middle East and Africa Flow Battery Market Revenue Share (%), by Import Market Analysis (Value & Volume) 2025 & 2033
- Figure 110: Middle East and Africa Flow Battery Market Volume Share (%), by Import Market Analysis (Value & Volume) 2025 & 2033
- Figure 111: Middle East and Africa Flow Battery Market Revenue (Million), by Export Market Analysis (Value & Volume) 2025 & 2033
- Figure 112: Middle East and Africa Flow Battery Market Volume (K Units), by Export Market Analysis (Value & Volume) 2025 & 2033
- Figure 113: Middle East and Africa Flow Battery Market Revenue Share (%), by Export Market Analysis (Value & Volume) 2025 & 2033
- Figure 114: Middle East and Africa Flow Battery Market Volume Share (%), by Export Market Analysis (Value & Volume) 2025 & 2033
- Figure 115: Middle East and Africa Flow Battery Market Revenue (Million), by Price Trend Analysis 2025 & 2033
- Figure 116: Middle East and Africa Flow Battery Market Volume (K Units), by Price Trend Analysis 2025 & 2033
- Figure 117: Middle East and Africa Flow Battery Market Revenue Share (%), by Price Trend Analysis 2025 & 2033
- Figure 118: Middle East and Africa Flow Battery Market Volume Share (%), by Price Trend Analysis 2025 & 2033
- Figure 119: Middle East and Africa Flow Battery Market Revenue (Million), by Country 2025 & 2033
- Figure 120: Middle East and Africa Flow Battery Market Volume (K Units), by Country 2025 & 2033
- Figure 121: Middle East and Africa Flow Battery Market Revenue Share (%), by Country 2025 & 2033
- Figure 122: Middle East and Africa Flow Battery Market Volume Share (%), by Country 2025 & 2033
List of Tables
- Table 1: Global Flow Battery Market Revenue Million Forecast, by Production Analysis 2020 & 2033
- Table 2: Global Flow Battery Market Volume K Units Forecast, by Production Analysis 2020 & 2033
- Table 3: Global Flow Battery Market Revenue Million Forecast, by Consumption Analysis 2020 & 2033
- Table 4: Global Flow Battery Market Volume K Units Forecast, by Consumption Analysis 2020 & 2033
- Table 5: Global Flow Battery Market Revenue Million Forecast, by Import Market Analysis (Value & Volume) 2020 & 2033
- Table 6: Global Flow Battery Market Volume K Units Forecast, by Import Market Analysis (Value & Volume) 2020 & 2033
- Table 7: Global Flow Battery Market Revenue Million Forecast, by Export Market Analysis (Value & Volume) 2020 & 2033
- Table 8: Global Flow Battery Market Volume K Units Forecast, by Export Market Analysis (Value & Volume) 2020 & 2033
- Table 9: Global Flow Battery Market Revenue Million Forecast, by Price Trend Analysis 2020 & 2033
- Table 10: Global Flow Battery Market Volume K Units Forecast, by Price Trend Analysis 2020 & 2033
- Table 11: Global Flow Battery Market Revenue Million Forecast, by Region 2020 & 2033
- Table 12: Global Flow Battery Market Volume K Units Forecast, by Region 2020 & 2033
- Table 13: Global Flow Battery Market Revenue Million Forecast, by Production Analysis 2020 & 2033
- Table 14: Global Flow Battery Market Volume K Units Forecast, by Production Analysis 2020 & 2033
- Table 15: Global Flow Battery Market Revenue Million Forecast, by Consumption Analysis 2020 & 2033
- Table 16: Global Flow Battery Market Volume K Units Forecast, by Consumption Analysis 2020 & 2033
- Table 17: Global Flow Battery Market Revenue Million Forecast, by Import Market Analysis (Value & Volume) 2020 & 2033
- Table 18: Global Flow Battery Market Volume K Units Forecast, by Import Market Analysis (Value & Volume) 2020 & 2033
- Table 19: Global Flow Battery Market Revenue Million Forecast, by Export Market Analysis (Value & Volume) 2020 & 2033
- Table 20: Global Flow Battery Market Volume K Units Forecast, by Export Market Analysis (Value & Volume) 2020 & 2033
- Table 21: Global Flow Battery Market Revenue Million Forecast, by Price Trend Analysis 2020 & 2033
- Table 22: Global Flow Battery Market Volume K Units Forecast, by Price Trend Analysis 2020 & 2033
- Table 23: Global Flow Battery Market Revenue Million Forecast, by Country 2020 & 2033
- Table 24: Global Flow Battery Market Volume K Units Forecast, by Country 2020 & 2033
- Table 25: Global Flow Battery Market Revenue Million Forecast, by Production Analysis 2020 & 2033
- Table 26: Global Flow Battery Market Volume K Units Forecast, by Production Analysis 2020 & 2033
- Table 27: Global Flow Battery Market Revenue Million Forecast, by Consumption Analysis 2020 & 2033
- Table 28: Global Flow Battery Market Volume K Units Forecast, by Consumption Analysis 2020 & 2033
- Table 29: Global Flow Battery Market Revenue Million Forecast, by Import Market Analysis (Value & Volume) 2020 & 2033
- Table 30: Global Flow Battery Market Volume K Units Forecast, by Import Market Analysis (Value & Volume) 2020 & 2033
- Table 31: Global Flow Battery Market Revenue Million Forecast, by Export Market Analysis (Value & Volume) 2020 & 2033
- Table 32: Global Flow Battery Market Volume K Units Forecast, by Export Market Analysis (Value & Volume) 2020 & 2033
- Table 33: Global Flow Battery Market Revenue Million Forecast, by Price Trend Analysis 2020 & 2033
- Table 34: Global Flow Battery Market Volume K Units Forecast, by Price Trend Analysis 2020 & 2033
- Table 35: Global Flow Battery Market Revenue Million Forecast, by Country 2020 & 2033
- Table 36: Global Flow Battery Market Volume K Units Forecast, by Country 2020 & 2033
- Table 37: Global Flow Battery Market Revenue Million Forecast, by Production Analysis 2020 & 2033
- Table 38: Global Flow Battery Market Volume K Units Forecast, by Production Analysis 2020 & 2033
- Table 39: Global Flow Battery Market Revenue Million Forecast, by Consumption Analysis 2020 & 2033
- Table 40: Global Flow Battery Market Volume K Units Forecast, by Consumption Analysis 2020 & 2033
- Table 41: Global Flow Battery Market Revenue Million Forecast, by Import Market Analysis (Value & Volume) 2020 & 2033
- Table 42: Global Flow Battery Market Volume K Units Forecast, by Import Market Analysis (Value & Volume) 2020 & 2033
- Table 43: Global Flow Battery Market Revenue Million Forecast, by Export Market Analysis (Value & Volume) 2020 & 2033
- Table 44: Global Flow Battery Market Volume K Units Forecast, by Export Market Analysis (Value & Volume) 2020 & 2033
- Table 45: Global Flow Battery Market Revenue Million Forecast, by Price Trend Analysis 2020 & 2033
- Table 46: Global Flow Battery Market Volume K Units Forecast, by Price Trend Analysis 2020 & 2033
- Table 47: Global Flow Battery Market Revenue Million Forecast, by Country 2020 & 2033
- Table 48: Global Flow Battery Market Volume K Units Forecast, by Country 2020 & 2033
- Table 49: Global Flow Battery Market Revenue Million Forecast, by Production Analysis 2020 & 2033
- Table 50: Global Flow Battery Market Volume K Units Forecast, by Production Analysis 2020 & 2033
- Table 51: Global Flow Battery Market Revenue Million Forecast, by Consumption Analysis 2020 & 2033
- Table 52: Global Flow Battery Market Volume K Units Forecast, by Consumption Analysis 2020 & 2033
- Table 53: Global Flow Battery Market Revenue Million Forecast, by Import Market Analysis (Value & Volume) 2020 & 2033
- Table 54: Global Flow Battery Market Volume K Units Forecast, by Import Market Analysis (Value & Volume) 2020 & 2033
- Table 55: Global Flow Battery Market Revenue Million Forecast, by Export Market Analysis (Value & Volume) 2020 & 2033
- Table 56: Global Flow Battery Market Volume K Units Forecast, by Export Market Analysis (Value & Volume) 2020 & 2033
- Table 57: Global Flow Battery Market Revenue Million Forecast, by Price Trend Analysis 2020 & 2033
- Table 58: Global Flow Battery Market Volume K Units Forecast, by Price Trend Analysis 2020 & 2033
- Table 59: Global Flow Battery Market Revenue Million Forecast, by Country 2020 & 2033
- Table 60: Global Flow Battery Market Volume K Units Forecast, by Country 2020 & 2033
- Table 61: Global Flow Battery Market Revenue Million Forecast, by Production Analysis 2020 & 2033
- Table 62: Global Flow Battery Market Volume K Units Forecast, by Production Analysis 2020 & 2033
- Table 63: Global Flow Battery Market Revenue Million Forecast, by Consumption Analysis 2020 & 2033
- Table 64: Global Flow Battery Market Volume K Units Forecast, by Consumption Analysis 2020 & 2033
- Table 65: Global Flow Battery Market Revenue Million Forecast, by Import Market Analysis (Value & Volume) 2020 & 2033
- Table 66: Global Flow Battery Market Volume K Units Forecast, by Import Market Analysis (Value & Volume) 2020 & 2033
- Table 67: Global Flow Battery Market Revenue Million Forecast, by Export Market Analysis (Value & Volume) 2020 & 2033
- Table 68: Global Flow Battery Market Volume K Units Forecast, by Export Market Analysis (Value & Volume) 2020 & 2033
- Table 69: Global Flow Battery Market Revenue Million Forecast, by Price Trend Analysis 2020 & 2033
- Table 70: Global Flow Battery Market Volume K Units Forecast, by Price Trend Analysis 2020 & 2033
- Table 71: Global Flow Battery Market Revenue Million Forecast, by Country 2020 & 2033
- Table 72: Global Flow Battery Market Volume K Units Forecast, by Country 2020 & 2033
Frequently Asked Questions
1. What is the projected Compound Annual Growth Rate (CAGR) of the Flow Battery Market?
The projected CAGR is approximately 15.41%.
2. Which companies are prominent players in the Flow Battery Market?
Key companies in the market include Invinity Energy Systems PLC, Vanadis Power GmbH, H2 Inc *List Not Exhaustive, CellCube Energy Storage Systems Inc, RedFlow Ltd, ESS Tech Inc, Dalian Rongke Power Co Ltd, Stryten Energy, Primus Power Corporation, VRB Energy.
3. What are the main segments of the Flow Battery Market?
The market segments include Production Analysis, Consumption Analysis, Import Market Analysis (Value & Volume), Export Market Analysis (Value & Volume), Price Trend Analysis.
4. Can you provide details about the market size?
The market size is estimated to be USD 0.88 Million as of 2022.
5. What are some drivers contributing to market growth?
4.; Favorable Government Policies4.; Reduced Cost of Solar Energy Systems.
6. What are the notable trends driving market growth?
Vanadium Redox Flow Batteries are Expected to Witness Significant Growth.
7. Are there any restraints impacting market growth?
4.; Lack of Financing Options Coupled with Difficulties in Integrating Residential Solar PV Systems in Regions like Africa.
8. Can you provide examples of recent developments in the market?
September 2022: CellCube, the subsidiary of Austria-headquartered technology provider Enerox, formed an R&D partnership in Australia in anticipation of establishing a presence in the country's long-duration energy storage market. The companies will work together to integrate CellCube vanadium redox flow batteries (VRFBs) to help meet the power demand for 24/7 low-carbon energy in Australia, starting with a pilot project deployment of a 2 MW/8 MWh VRFB system.
9. What pricing options are available for accessing the report?
Pricing options include single-user, multi-user, and enterprise licenses priced at USD 4750, USD 5250, and USD 8750 respectively.
10. Is the market size provided in terms of value or volume?
The market size is provided in terms of value, measured in Million and volume, measured in K Units.
11. Are there any specific market keywords associated with the report?
Yes, the market keyword associated with the report is "Flow Battery Market," which aids in identifying and referencing the specific market segment covered.
12. How do I determine which pricing option suits my needs best?
The pricing options vary based on user requirements and access needs. Individual users may opt for single-user licenses, while businesses requiring broader access may choose multi-user or enterprise licenses for cost-effective access to the report.
13. Are there any additional resources or data provided in the Flow Battery Market report?
While the report offers comprehensive insights, it's advisable to review the specific contents or supplementary materials provided to ascertain if additional resources or data are available.
14. How can I stay updated on further developments or reports in the Flow Battery Market?
To stay informed about further developments, trends, and reports in the Flow Battery Market, consider subscribing to industry newsletters, following relevant companies and organizations, or regularly checking reputable industry news sources and publications.
Methodology
Step 1 - Identification of Relevant Samples Size from Population Database


Step 2 - Approaches for Defining Global Market Size (Value, Volume* & Price*)

Note*: In applicable scenarios
Step 3 - Data Sources
Primary Research
- Web Analytics
- Survey Reports
- Research Institute
- Latest Research Reports
- Opinion Leaders
Secondary Research
- Annual Reports
- White Paper
- Latest Press Release
- Industry Association
- Paid Database
- Investor Presentations

Step 4 - Data Triangulation
Involves using different sources of information in order to increase the validity of a study
These sources are likely to be stakeholders in a program - participants, other researchers, program staff, other community members, and so on.
Then we put all data in single framework & apply various statistical tools to find out the dynamic on the market.
During the analysis stage, feedback from the stakeholder groups would be compared to determine areas of agreement as well as areas of divergence