

Key Insights
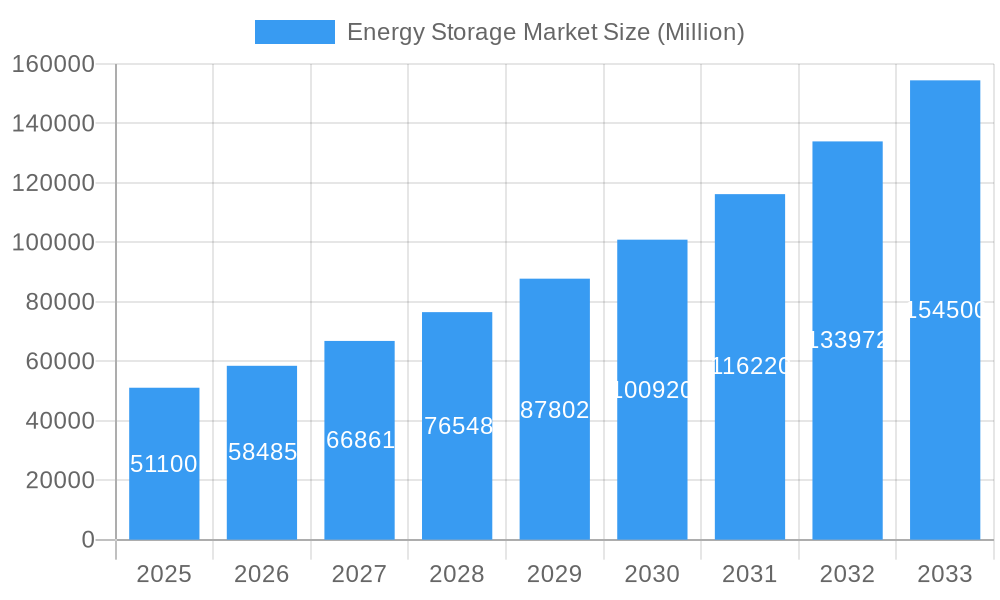
The global energy storage market, valued at $51.10 billion in 2025, is poised for substantial growth, exhibiting a Compound Annual Growth Rate (CAGR) of 14.31% from 2025 to 2033. This robust expansion is driven by several key factors. The increasing adoption of renewable energy sources like solar and wind power necessitates effective energy storage solutions to address intermittency issues and ensure grid stability. Furthermore, rising electricity prices and concerns about energy security are compelling businesses and consumers to invest in energy storage systems for cost savings and resilience. Technological advancements in battery technologies, particularly lithium-ion batteries, are also contributing to market growth, improving efficiency, reducing costs, and expanding applications. The diverse application segments, encompassing residential, commercial, and industrial sectors, further fuel market expansion, with significant opportunities arising from large-scale deployments in industrial settings and grid-scale energy storage projects. Growth in electric vehicle adoption is indirectly supporting the market by driving innovation and economies of scale in battery production. The market is segmented by type (batteries, pumped-storage hydroelectricity, thermal energy storage, flywheel energy storage, and others) and application, reflecting the diverse technological landscape and user needs. Leading companies such as BYD, CATL, and Tesla are driving innovation and competition, further accelerating market growth.
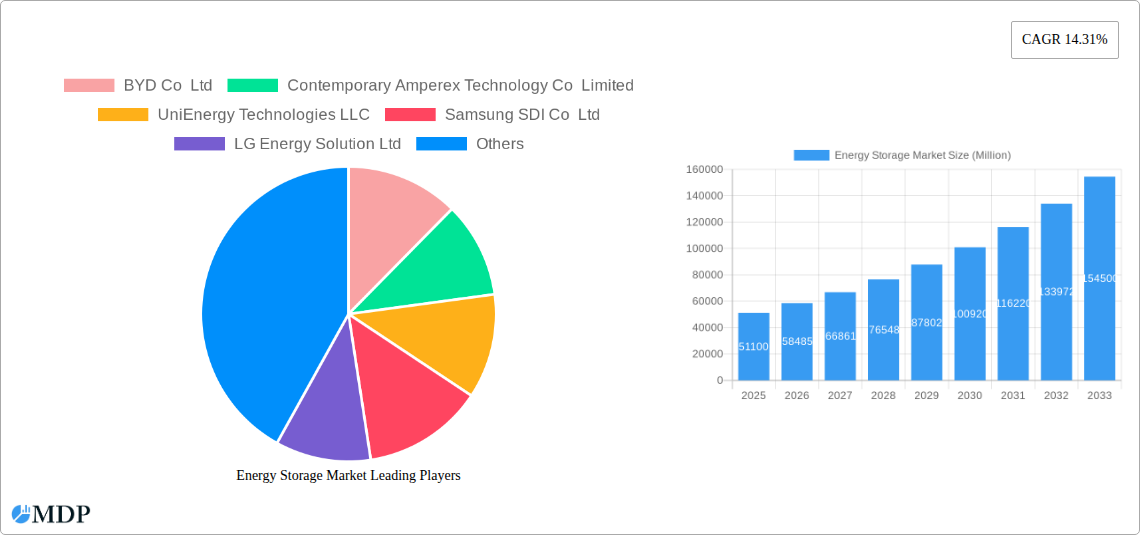
Energy Storage Market Market Size (In Billion)
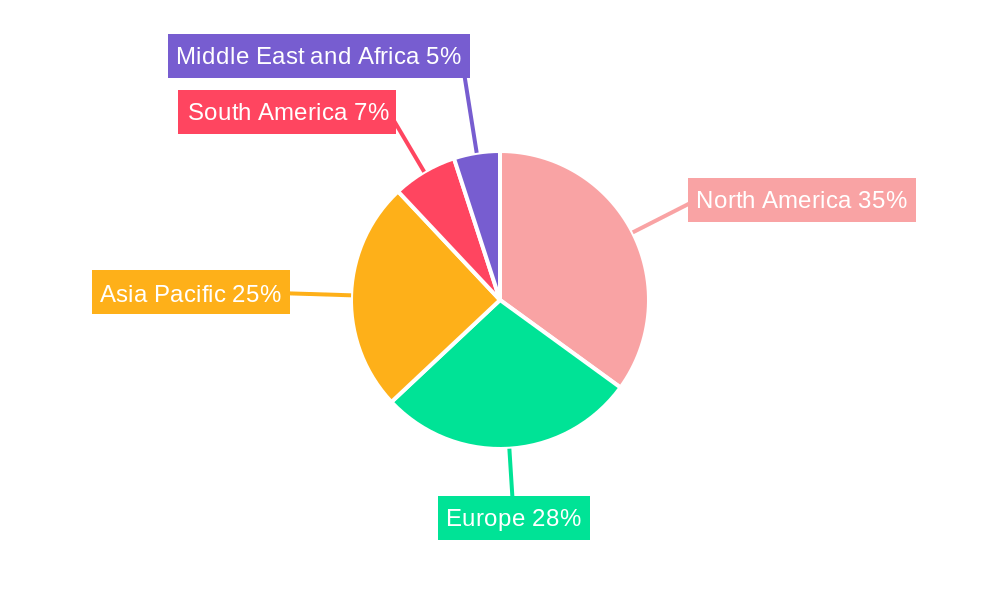
Geographic expansion is another notable trend. While North America and Asia-Pacific currently hold significant market shares, developing economies in regions like South America and the Middle East and Africa present substantial untapped potential for growth. However, challenges remain, including the high initial investment costs of energy storage systems, concerns about battery lifespan and environmental impact (especially concerning battery recycling), and regulatory hurdles in some regions. Despite these constraints, the long-term outlook for the energy storage market remains extremely positive, driven by supportive government policies, growing environmental awareness, and the increasing need for reliable and sustainable energy solutions. The market's growth trajectory strongly suggests a significant expansion in the coming years, exceeding the $51.10 Billion mark considerably by 2033.
Energy Storage Market Company Market Share
Energy Storage Market Report: 2019-2033 Forecast
Dive deep into the dynamic Energy Storage Market with this comprehensive report, projecting a xx Million market value by 2033. This in-depth analysis covers the period from 2019 to 2033, with a focus on 2025 as the base and estimated year. Uncover key trends, leading players like BYD Co Ltd, Contemporary Amperex Technology Co Limited, and Tesla Inc, and lucrative opportunities in this rapidly expanding sector. This report is essential for investors, industry professionals, and anyone seeking to navigate the complexities of the energy storage landscape.
Energy Storage Market Market Dynamics & Concentration
The global energy storage market is experiencing robust growth driven by increasing demand for renewable energy integration, grid modernization initiatives, and the need for reliable backup power. Market concentration is moderate, with a few key players holding significant market share, while a diverse range of smaller companies contribute to innovation and specialization. The market share of the top 5 players in 2025 is estimated at xx%, indicating a competitive yet consolidated landscape. Innovation is a key driver, with ongoing advancements in battery technologies, such as lithium-ion and zinc-ion, leading to improved efficiency, longer lifespans, and reduced costs.
Regulatory frameworks, including government incentives and subsidies for renewable energy adoption, significantly influence market growth. Stringent environmental regulations are also driving the adoption of energy storage solutions to mitigate carbon emissions. Product substitutes, primarily based on traditional fossil fuel-based solutions, are facing increasing pressure due to rising energy costs and environmental concerns. End-user trends show a growing preference for decentralized energy systems, driving demand for residential and commercial energy storage solutions. The period 2019-2024 witnessed xx M&A deals, indicating significant consolidation and strategic partnerships within the industry. Looking ahead, a further xx deals are projected for 2025-2033, demonstrating ongoing industry activity and expansion.
Energy Storage Market Industry Trends & Analysis
The energy storage market exhibits a compound annual growth rate (CAGR) of xx% during the forecast period (2025-2033). Technological advancements, particularly in battery chemistry and energy density, are major growth catalysts, driving down costs and improving performance. Consumer preferences are shifting toward sustainable and reliable energy solutions, boosting the demand for home energy storage systems. The market penetration of energy storage solutions in the residential sector is projected to reach xx% by 2033, demonstrating significant growth potential. Competitive dynamics are intense, with companies focusing on product differentiation, technological innovation, and strategic partnerships to gain a competitive edge. The market is witnessing increased investment in research and development, leading to the emergence of new and improved energy storage technologies. This competitive landscape is fostering innovation, driving down costs, and creating a more diverse and robust market.
Leading Markets & Segments in Energy Storage Market
Dominant Regions/Countries: The Asia-Pacific region, particularly China, is currently the leading market for energy storage, driven by strong government support for renewable energy and a rapidly growing economy. North America and Europe follow closely, with significant investments in grid-scale energy storage projects.
- Key Drivers in Asia-Pacific: Government policies promoting renewable energy integration, expanding infrastructure, and strong economic growth.
- Key Drivers in North America: Focus on grid modernization, increasing demand for backup power, and substantial investments in renewable energy projects.
- Key Drivers in Europe: Stringent environmental regulations, ambitious renewable energy targets, and growing concerns about energy security.
Dominant Segments:
- Type: Batteries dominate the market, accounting for xx% of the total revenue in 2025, due to their versatility and adaptability to various applications. Pumped-storage hydroelectricity (PSH) remains a significant segment, primarily in large-scale energy storage projects.
- Application: The commercial and industrial segment is expected to exhibit the highest growth rate during the forecast period, driven by the increasing need for reliable power supply and reduced operational costs. Residential applications are also witnessing strong growth, fueled by declining battery prices and increasing awareness of renewable energy solutions.
Energy Storage Market Product Developments
Recent product innovations focus on improving energy density, extending battery lifespan, and enhancing safety features. The integration of advanced battery management systems (BMS) and smart grid technologies is improving efficiency and grid integration capabilities. New applications are emerging in areas such as electric vehicles (EVs), data centers, and microgrids, broadening the market reach of energy storage systems. These advancements are creating competitive advantages for companies capable of delivering high-performance, cost-effective solutions tailored to specific market needs. The market is witnessing a shift towards more sustainable and environmentally friendly battery chemistries.
Key Drivers of Energy Storage Market Growth
The energy storage market is fueled by several key factors. Firstly, the increasing adoption of renewable energy sources, such as solar and wind power, necessitates efficient energy storage solutions to address their intermittent nature. Secondly, the growing demand for reliable and resilient power grids is driving investments in grid-scale energy storage projects. Thirdly, government policies and regulations promoting clean energy and energy independence are incentivizing the deployment of energy storage technologies. Examples include tax credits for renewable energy systems and mandates for renewable energy portfolio standards.
Challenges in the Energy Storage Market Market
Challenges include high initial investment costs, limited lifespan of some battery technologies, and concerns related to safety and environmental impact of certain battery chemistries. Supply chain disruptions, particularly regarding critical raw materials such as lithium, pose a significant risk to market growth. Furthermore, intense competition among various energy storage technologies and vendors can create pressure on pricing and profitability. These challenges impact market growth by limiting adoption rates and increasing development risks.
Emerging Opportunities in Energy Storage Market
Long-term growth is driven by technological breakthroughs in battery technologies, such as solid-state batteries, which offer enhanced safety, energy density, and lifespan. Strategic partnerships between energy storage companies and renewable energy developers are creating new market opportunities. Expanding into new geographic markets, particularly in developing economies with growing energy demands, presents significant potential for growth. These factors contribute to the long-term potential of the energy storage market.
Leading Players in the Energy Storage Market Sector
- BYD Co Ltd
- Contemporary Amperex Technology Co Limited
- UniEnergy Technologies LLC
- Samsung SDI Co Ltd
- LG Energy Solution Ltd
- NGK Insulators Ltd
- Tesla Inc
- Clarios (Formerly Johnson Controls International PLC)
- GS Yuasa Corporation
Key Milestones in Energy Storage Market Industry
- February 2022: FIMER and Vega Solar partnered, supplying 14 PVS-100 inverters to Albania, boosting decentralized solar systems. This highlights the growing market for inverters supporting energy storage solutions.
- May 2022: Salient Energy partnered with Horton World Solutions, promoting zinc-ion batteries for residential energy storage. This signals growing interest in alternative battery technologies and their integration into sustainable housing.
Strategic Outlook for Energy Storage Market Market
The future of the energy storage market is bright, driven by continuous technological advancements, increasing demand for renewable energy, and supportive government policies. Strategic partnerships and collaborations will play a crucial role in accelerating market growth. Companies focusing on innovation, cost reduction, and addressing sustainability concerns will be best positioned to capture market share. The market is expected to witness significant expansion in the coming years, driven by both grid-scale and distributed energy storage applications.
Energy Storage Market Segmentation
-
1. Type
- 1.1. Batteries
- 1.2. Pumped-storage Hydroelectricity (PSH)
- 1.3. Thermal Energy Storage (TES)
- 1.4. Flywheel Energy Storage (FES)
- 1.5. Other Types
-
2. Application
- 2.1. Residential
- 2.2. Commercial and Industrial
Energy Storage Market Segmentation By Geography
-
1. North America
- 1.1. United States
- 1.2. Canada
- 1.3. Rest of North America
-
2. Asia Pacific
- 2.1. India
- 2.2. China
- 2.3. Australia
- 2.4. Rest of Asia Pacific
-
3. Europe
- 3.1. Germany
- 3.2. United Kingdom
- 3.3. Rest of Europe
-
4. South America
- 4.1. Brazil
- 4.2. Argentina
- 4.3. Rest of South America
-
5. Middle East and Africa
- 5.1. Saudi Arabia
- 5.2. Iraq
- 5.3. Jordan
- 5.4. Rest of Middle East and Africa
Energy Storage Market Regional Market Share
Geographic Coverage of Energy Storage Market
Energy Storage Market REPORT HIGHLIGHTS
| Aspects | Details |
|---|---|
| Study Period | 2020-2034 |
| Base Year | 2025 |
| Estimated Year | 2026 |
| Forecast Period | 2026-2034 |
| Historical Period | 2020-2025 |
| Growth Rate | CAGR of 14.31% from 2020-2034 |
| Segmentation |
|
Table of Contents
- 1. Introduction
- 1.1. Research Scope
- 1.2. Market Segmentation
- 1.3. Research Objective
- 1.4. Definitions and Assumptions
- 2. Executive Summary
- 2.1. Market Snapshot
- 3. Market Dynamics
- 3.1. Market Drivers
- 3.2. Market Restrains
- 3.3. Market Trends
- 3.4. Market Opportunities
- 4. Market Factor Analysis
- 4.1. Porters Five Forces
- 4.1.1. Bargaining Power of Suppliers
- 4.1.2. Bargaining Power of Buyers
- 4.1.3. Threat of New Entrants
- 4.1.4. Threat of Substitutes
- 4.1.5. Competitive Rivalry
- 4.2. PESTEL analysis
- 4.3. BCG Analysis
- 4.3.1. Stars (High Growth, High Market Share)
- 4.3.2. Cash Cows (Low Growth, High Market Share)
- 4.3.3. Question Mark (High Growth, Low Market Share)
- 4.3.4. Dogs (Low Growth, Low Market Share)
- 4.4. Ansoff Matrix Analysis
- 4.5. Supply Chain Analysis
- 4.6. Regulatory Landscape
- 4.7. Current Market Potential and Opportunity Assessment (TAM–SAM–SOM Framework)
- 4.8. MDP Analyst Note
- 4.1. Porters Five Forces
- 5. Market Analysis, Insights and Forecast 2021-2033
- 5.1. Market Analysis, Insights and Forecast - by Type
- 5.1.1. Batteries
- 5.1.2. Pumped-storage Hydroelectricity (PSH)
- 5.1.3. Thermal Energy Storage (TES)
- 5.1.4. Flywheel Energy Storage (FES)
- 5.1.5. Other Types
- 5.2. Market Analysis, Insights and Forecast - by Application
- 5.2.1. Residential
- 5.2.2. Commercial and Industrial
- 5.3. Market Analysis, Insights and Forecast - by Region
- 5.3.1. North America
- 5.3.2. Asia Pacific
- 5.3.3. Europe
- 5.3.4. South America
- 5.3.5. Middle East and Africa
- 5.1. Market Analysis, Insights and Forecast - by Type
- 6. Global Energy Storage Market Analysis, Insights and Forecast, 2021-2033
- 6.1. Market Analysis, Insights and Forecast - by Type
- 6.1.1. Batteries
- 6.1.2. Pumped-storage Hydroelectricity (PSH)
- 6.1.3. Thermal Energy Storage (TES)
- 6.1.4. Flywheel Energy Storage (FES)
- 6.1.5. Other Types
- 6.2. Market Analysis, Insights and Forecast - by Application
- 6.2.1. Residential
- 6.2.2. Commercial and Industrial
- 6.1. Market Analysis, Insights and Forecast - by Type
- 7. North America Energy Storage Market Analysis, Insights and Forecast, 2020-2032
- 7.1. Market Analysis, Insights and Forecast - by Type
- 7.1.1. Batteries
- 7.1.2. Pumped-storage Hydroelectricity (PSH)
- 7.1.3. Thermal Energy Storage (TES)
- 7.1.4. Flywheel Energy Storage (FES)
- 7.1.5. Other Types
- 7.2. Market Analysis, Insights and Forecast - by Application
- 7.2.1. Residential
- 7.2.2. Commercial and Industrial
- 7.1. Market Analysis, Insights and Forecast - by Type
- 8. Asia Pacific Energy Storage Market Analysis, Insights and Forecast, 2020-2032
- 8.1. Market Analysis, Insights and Forecast - by Type
- 8.1.1. Batteries
- 8.1.2. Pumped-storage Hydroelectricity (PSH)
- 8.1.3. Thermal Energy Storage (TES)
- 8.1.4. Flywheel Energy Storage (FES)
- 8.1.5. Other Types
- 8.2. Market Analysis, Insights and Forecast - by Application
- 8.2.1. Residential
- 8.2.2. Commercial and Industrial
- 8.1. Market Analysis, Insights and Forecast - by Type
- 9. Europe Energy Storage Market Analysis, Insights and Forecast, 2020-2032
- 9.1. Market Analysis, Insights and Forecast - by Type
- 9.1.1. Batteries
- 9.1.2. Pumped-storage Hydroelectricity (PSH)
- 9.1.3. Thermal Energy Storage (TES)
- 9.1.4. Flywheel Energy Storage (FES)
- 9.1.5. Other Types
- 9.2. Market Analysis, Insights and Forecast - by Application
- 9.2.1. Residential
- 9.2.2. Commercial and Industrial
- 9.1. Market Analysis, Insights and Forecast - by Type
- 10. South America Energy Storage Market Analysis, Insights and Forecast, 2020-2032
- 10.1. Market Analysis, Insights and Forecast - by Type
- 10.1.1. Batteries
- 10.1.2. Pumped-storage Hydroelectricity (PSH)
- 10.1.3. Thermal Energy Storage (TES)
- 10.1.4. Flywheel Energy Storage (FES)
- 10.1.5. Other Types
- 10.2. Market Analysis, Insights and Forecast - by Application
- 10.2.1. Residential
- 10.2.2. Commercial and Industrial
- 10.1. Market Analysis, Insights and Forecast - by Type
- 11. Middle East and Africa Energy Storage Market Analysis, Insights and Forecast, 2020-2032
- 11.1. Market Analysis, Insights and Forecast - by Type
- 11.1.1. Batteries
- 11.1.2. Pumped-storage Hydroelectricity (PSH)
- 11.1.3. Thermal Energy Storage (TES)
- 11.1.4. Flywheel Energy Storage (FES)
- 11.1.5. Other Types
- 11.2. Market Analysis, Insights and Forecast - by Application
- 11.2.1. Residential
- 11.2.2. Commercial and Industrial
- 11.1. Market Analysis, Insights and Forecast - by Type
- 12. Competitive Analysis
- 12.1. Company Profiles
- 12.1.1 BYD Co Ltd
- 12.1.1.1. Company Overview
- 12.1.1.2. Products
- 12.1.1.3. Company Financials
- 12.1.1.4. SWOT Analysis
- 12.1.2 Contemporary Amperex Technology Co Limited
- 12.1.2.1. Company Overview
- 12.1.2.2. Products
- 12.1.2.3. Company Financials
- 12.1.2.4. SWOT Analysis
- 12.1.3 UniEnergy Technologies LLC
- 12.1.3.1. Company Overview
- 12.1.3.2. Products
- 12.1.3.3. Company Financials
- 12.1.3.4. SWOT Analysis
- 12.1.4 Samsung SDI Co Ltd
- 12.1.4.1. Company Overview
- 12.1.4.2. Products
- 12.1.4.3. Company Financials
- 12.1.4.4. SWOT Analysis
- 12.1.5 LG Energy Solution Ltd
- 12.1.5.1. Company Overview
- 12.1.5.2. Products
- 12.1.5.3. Company Financials
- 12.1.5.4. SWOT Analysis
- 12.1.6 NGK Insulators Ltd
- 12.1.6.1. Company Overview
- 12.1.6.2. Products
- 12.1.6.3. Company Financials
- 12.1.6.4. SWOT Analysis
- 12.1.7 Tesla Inc *List Not Exhaustive
- 12.1.7.1. Company Overview
- 12.1.7.2. Products
- 12.1.7.3. Company Financials
- 12.1.7.4. SWOT Analysis
- 12.1.8 Clarios (Formerly Johnson Controls International PLC)
- 12.1.8.1. Company Overview
- 12.1.8.2. Products
- 12.1.8.3. Company Financials
- 12.1.8.4. SWOT Analysis
- 12.1.9 GS Yuasa Corporation
- 12.1.9.1. Company Overview
- 12.1.9.2. Products
- 12.1.9.3. Company Financials
- 12.1.9.4. SWOT Analysis
- 12.1.1 BYD Co Ltd
- 12.2. Market Entropy
- 12.2.1 Company's Key Areas Served
- 12.2.2 Recent Developments
- 12.3. Company Market Share Analysis 2025
- 12.3.1 Top 5 Companies Market Share Analysis
- 12.3.2 Top 3 Companies Market Share Analysis
- 12.4. List of Potential Customers
- 13. Research Methodology
List of Figures
- Figure 1: Global Energy Storage Market Revenue Breakdown (Million, %) by Region 2025 & 2033
- Figure 2: Global Energy Storage Market Volume Breakdown (K Unit, %) by Region 2025 & 2033
- Figure 3: North America Energy Storage Market Revenue (Million), by Type 2025 & 2033
- Figure 4: North America Energy Storage Market Volume (K Unit), by Type 2025 & 2033
- Figure 5: North America Energy Storage Market Revenue Share (%), by Type 2025 & 2033
- Figure 6: North America Energy Storage Market Volume Share (%), by Type 2025 & 2033
- Figure 7: North America Energy Storage Market Revenue (Million), by Application 2025 & 2033
- Figure 8: North America Energy Storage Market Volume (K Unit), by Application 2025 & 2033
- Figure 9: North America Energy Storage Market Revenue Share (%), by Application 2025 & 2033
- Figure 10: North America Energy Storage Market Volume Share (%), by Application 2025 & 2033
- Figure 11: North America Energy Storage Market Revenue (Million), by Country 2025 & 2033
- Figure 12: North America Energy Storage Market Volume (K Unit), by Country 2025 & 2033
- Figure 13: North America Energy Storage Market Revenue Share (%), by Country 2025 & 2033
- Figure 14: North America Energy Storage Market Volume Share (%), by Country 2025 & 2033
- Figure 15: Asia Pacific Energy Storage Market Revenue (Million), by Type 2025 & 2033
- Figure 16: Asia Pacific Energy Storage Market Volume (K Unit), by Type 2025 & 2033
- Figure 17: Asia Pacific Energy Storage Market Revenue Share (%), by Type 2025 & 2033
- Figure 18: Asia Pacific Energy Storage Market Volume Share (%), by Type 2025 & 2033
- Figure 19: Asia Pacific Energy Storage Market Revenue (Million), by Application 2025 & 2033
- Figure 20: Asia Pacific Energy Storage Market Volume (K Unit), by Application 2025 & 2033
- Figure 21: Asia Pacific Energy Storage Market Revenue Share (%), by Application 2025 & 2033
- Figure 22: Asia Pacific Energy Storage Market Volume Share (%), by Application 2025 & 2033
- Figure 23: Asia Pacific Energy Storage Market Revenue (Million), by Country 2025 & 2033
- Figure 24: Asia Pacific Energy Storage Market Volume (K Unit), by Country 2025 & 2033
- Figure 25: Asia Pacific Energy Storage Market Revenue Share (%), by Country 2025 & 2033
- Figure 26: Asia Pacific Energy Storage Market Volume Share (%), by Country 2025 & 2033
- Figure 27: Europe Energy Storage Market Revenue (Million), by Type 2025 & 2033
- Figure 28: Europe Energy Storage Market Volume (K Unit), by Type 2025 & 2033
- Figure 29: Europe Energy Storage Market Revenue Share (%), by Type 2025 & 2033
- Figure 30: Europe Energy Storage Market Volume Share (%), by Type 2025 & 2033
- Figure 31: Europe Energy Storage Market Revenue (Million), by Application 2025 & 2033
- Figure 32: Europe Energy Storage Market Volume (K Unit), by Application 2025 & 2033
- Figure 33: Europe Energy Storage Market Revenue Share (%), by Application 2025 & 2033
- Figure 34: Europe Energy Storage Market Volume Share (%), by Application 2025 & 2033
- Figure 35: Europe Energy Storage Market Revenue (Million), by Country 2025 & 2033
- Figure 36: Europe Energy Storage Market Volume (K Unit), by Country 2025 & 2033
- Figure 37: Europe Energy Storage Market Revenue Share (%), by Country 2025 & 2033
- Figure 38: Europe Energy Storage Market Volume Share (%), by Country 2025 & 2033
- Figure 39: South America Energy Storage Market Revenue (Million), by Type 2025 & 2033
- Figure 40: South America Energy Storage Market Volume (K Unit), by Type 2025 & 2033
- Figure 41: South America Energy Storage Market Revenue Share (%), by Type 2025 & 2033
- Figure 42: South America Energy Storage Market Volume Share (%), by Type 2025 & 2033
- Figure 43: South America Energy Storage Market Revenue (Million), by Application 2025 & 2033
- Figure 44: South America Energy Storage Market Volume (K Unit), by Application 2025 & 2033
- Figure 45: South America Energy Storage Market Revenue Share (%), by Application 2025 & 2033
- Figure 46: South America Energy Storage Market Volume Share (%), by Application 2025 & 2033
- Figure 47: South America Energy Storage Market Revenue (Million), by Country 2025 & 2033
- Figure 48: South America Energy Storage Market Volume (K Unit), by Country 2025 & 2033
- Figure 49: South America Energy Storage Market Revenue Share (%), by Country 2025 & 2033
- Figure 50: South America Energy Storage Market Volume Share (%), by Country 2025 & 2033
- Figure 51: Middle East and Africa Energy Storage Market Revenue (Million), by Type 2025 & 2033
- Figure 52: Middle East and Africa Energy Storage Market Volume (K Unit), by Type 2025 & 2033
- Figure 53: Middle East and Africa Energy Storage Market Revenue Share (%), by Type 2025 & 2033
- Figure 54: Middle East and Africa Energy Storage Market Volume Share (%), by Type 2025 & 2033
- Figure 55: Middle East and Africa Energy Storage Market Revenue (Million), by Application 2025 & 2033
- Figure 56: Middle East and Africa Energy Storage Market Volume (K Unit), by Application 2025 & 2033
- Figure 57: Middle East and Africa Energy Storage Market Revenue Share (%), by Application 2025 & 2033
- Figure 58: Middle East and Africa Energy Storage Market Volume Share (%), by Application 2025 & 2033
- Figure 59: Middle East and Africa Energy Storage Market Revenue (Million), by Country 2025 & 2033
- Figure 60: Middle East and Africa Energy Storage Market Volume (K Unit), by Country 2025 & 2033
- Figure 61: Middle East and Africa Energy Storage Market Revenue Share (%), by Country 2025 & 2033
- Figure 62: Middle East and Africa Energy Storage Market Volume Share (%), by Country 2025 & 2033
List of Tables
- Table 1: Global Energy Storage Market Revenue Million Forecast, by Type 2020 & 2033
- Table 2: Global Energy Storage Market Volume K Unit Forecast, by Type 2020 & 2033
- Table 3: Global Energy Storage Market Revenue Million Forecast, by Application 2020 & 2033
- Table 4: Global Energy Storage Market Volume K Unit Forecast, by Application 2020 & 2033
- Table 5: Global Energy Storage Market Revenue Million Forecast, by Region 2020 & 2033
- Table 6: Global Energy Storage Market Volume K Unit Forecast, by Region 2020 & 2033
- Table 7: Global Energy Storage Market Revenue Million Forecast, by Type 2020 & 2033
- Table 8: Global Energy Storage Market Volume K Unit Forecast, by Type 2020 & 2033
- Table 9: Global Energy Storage Market Revenue Million Forecast, by Application 2020 & 2033
- Table 10: Global Energy Storage Market Volume K Unit Forecast, by Application 2020 & 2033
- Table 11: Global Energy Storage Market Revenue Million Forecast, by Country 2020 & 2033
- Table 12: Global Energy Storage Market Volume K Unit Forecast, by Country 2020 & 2033
- Table 13: United States Energy Storage Market Revenue (Million) Forecast, by Application 2020 & 2033
- Table 14: United States Energy Storage Market Volume (K Unit) Forecast, by Application 2020 & 2033
- Table 15: Canada Energy Storage Market Revenue (Million) Forecast, by Application 2020 & 2033
- Table 16: Canada Energy Storage Market Volume (K Unit) Forecast, by Application 2020 & 2033
- Table 17: Rest of North America Energy Storage Market Revenue (Million) Forecast, by Application 2020 & 2033
- Table 18: Rest of North America Energy Storage Market Volume (K Unit) Forecast, by Application 2020 & 2033
- Table 19: Global Energy Storage Market Revenue Million Forecast, by Type 2020 & 2033
- Table 20: Global Energy Storage Market Volume K Unit Forecast, by Type 2020 & 2033
- Table 21: Global Energy Storage Market Revenue Million Forecast, by Application 2020 & 2033
- Table 22: Global Energy Storage Market Volume K Unit Forecast, by Application 2020 & 2033
- Table 23: Global Energy Storage Market Revenue Million Forecast, by Country 2020 & 2033
- Table 24: Global Energy Storage Market Volume K Unit Forecast, by Country 2020 & 2033
- Table 25: India Energy Storage Market Revenue (Million) Forecast, by Application 2020 & 2033
- Table 26: India Energy Storage Market Volume (K Unit) Forecast, by Application 2020 & 2033
- Table 27: China Energy Storage Market Revenue (Million) Forecast, by Application 2020 & 2033
- Table 28: China Energy Storage Market Volume (K Unit) Forecast, by Application 2020 & 2033
- Table 29: Australia Energy Storage Market Revenue (Million) Forecast, by Application 2020 & 2033
- Table 30: Australia Energy Storage Market Volume (K Unit) Forecast, by Application 2020 & 2033
- Table 31: Rest of Asia Pacific Energy Storage Market Revenue (Million) Forecast, by Application 2020 & 2033
- Table 32: Rest of Asia Pacific Energy Storage Market Volume (K Unit) Forecast, by Application 2020 & 2033
- Table 33: Global Energy Storage Market Revenue Million Forecast, by Type 2020 & 2033
- Table 34: Global Energy Storage Market Volume K Unit Forecast, by Type 2020 & 2033
- Table 35: Global Energy Storage Market Revenue Million Forecast, by Application 2020 & 2033
- Table 36: Global Energy Storage Market Volume K Unit Forecast, by Application 2020 & 2033
- Table 37: Global Energy Storage Market Revenue Million Forecast, by Country 2020 & 2033
- Table 38: Global Energy Storage Market Volume K Unit Forecast, by Country 2020 & 2033
- Table 39: Germany Energy Storage Market Revenue (Million) Forecast, by Application 2020 & 2033
- Table 40: Germany Energy Storage Market Volume (K Unit) Forecast, by Application 2020 & 2033
- Table 41: United Kingdom Energy Storage Market Revenue (Million) Forecast, by Application 2020 & 2033
- Table 42: United Kingdom Energy Storage Market Volume (K Unit) Forecast, by Application 2020 & 2033
- Table 43: Rest of Europe Energy Storage Market Revenue (Million) Forecast, by Application 2020 & 2033
- Table 44: Rest of Europe Energy Storage Market Volume (K Unit) Forecast, by Application 2020 & 2033
- Table 45: Global Energy Storage Market Revenue Million Forecast, by Type 2020 & 2033
- Table 46: Global Energy Storage Market Volume K Unit Forecast, by Type 2020 & 2033
- Table 47: Global Energy Storage Market Revenue Million Forecast, by Application 2020 & 2033
- Table 48: Global Energy Storage Market Volume K Unit Forecast, by Application 2020 & 2033
- Table 49: Global Energy Storage Market Revenue Million Forecast, by Country 2020 & 2033
- Table 50: Global Energy Storage Market Volume K Unit Forecast, by Country 2020 & 2033
- Table 51: Brazil Energy Storage Market Revenue (Million) Forecast, by Application 2020 & 2033
- Table 52: Brazil Energy Storage Market Volume (K Unit) Forecast, by Application 2020 & 2033
- Table 53: Argentina Energy Storage Market Revenue (Million) Forecast, by Application 2020 & 2033
- Table 54: Argentina Energy Storage Market Volume (K Unit) Forecast, by Application 2020 & 2033
- Table 55: Rest of South America Energy Storage Market Revenue (Million) Forecast, by Application 2020 & 2033
- Table 56: Rest of South America Energy Storage Market Volume (K Unit) Forecast, by Application 2020 & 2033
- Table 57: Global Energy Storage Market Revenue Million Forecast, by Type 2020 & 2033
- Table 58: Global Energy Storage Market Volume K Unit Forecast, by Type 2020 & 2033
- Table 59: Global Energy Storage Market Revenue Million Forecast, by Application 2020 & 2033
- Table 60: Global Energy Storage Market Volume K Unit Forecast, by Application 2020 & 2033
- Table 61: Global Energy Storage Market Revenue Million Forecast, by Country 2020 & 2033
- Table 62: Global Energy Storage Market Volume K Unit Forecast, by Country 2020 & 2033
- Table 63: Saudi Arabia Energy Storage Market Revenue (Million) Forecast, by Application 2020 & 2033
- Table 64: Saudi Arabia Energy Storage Market Volume (K Unit) Forecast, by Application 2020 & 2033
- Table 65: Iraq Energy Storage Market Revenue (Million) Forecast, by Application 2020 & 2033
- Table 66: Iraq Energy Storage Market Volume (K Unit) Forecast, by Application 2020 & 2033
- Table 67: Jordan Energy Storage Market Revenue (Million) Forecast, by Application 2020 & 2033
- Table 68: Jordan Energy Storage Market Volume (K Unit) Forecast, by Application 2020 & 2033
- Table 69: Rest of Middle East and Africa Energy Storage Market Revenue (Million) Forecast, by Application 2020 & 2033
- Table 70: Rest of Middle East and Africa Energy Storage Market Volume (K Unit) Forecast, by Application 2020 & 2033
Frequently Asked Questions
1. What is the projected Compound Annual Growth Rate (CAGR) of the Energy Storage Market?
The projected CAGR is approximately 14.31%.
2. Which companies are prominent players in the Energy Storage Market?
Key companies in the market include BYD Co Ltd, Contemporary Amperex Technology Co Limited, UniEnergy Technologies LLC, Samsung SDI Co Ltd, LG Energy Solution Ltd, NGK Insulators Ltd, Tesla Inc *List Not Exhaustive, Clarios (Formerly Johnson Controls International PLC), GS Yuasa Corporation.
3. What are the main segments of the Energy Storage Market?
The market segments include Type, Application.
4. Can you provide details about the market size?
The market size is estimated to be USD 51.10 Million as of 2022.
5. What are some drivers contributing to market growth?
Rising Supporting Government Policies for Solar Energy in South Africa4.; Increasing Investment in Renewable Energy Such as Solar. Wind. and Others.
6. What are the notable trends driving market growth?
Batteries Segment to Dominate the Market.
7. Are there any restraints impacting market growth?
Increasing Adoption of Alternate Renewable Technologies Such as Wind.
8. Can you provide examples of recent developments in the market?
February 2022: The partnership between FIMER and Vega Solar supplied 14 PVS-100 inverters, a three-phase string solution, to Albania. The PVS-100/120-TL is a cloud-connected three-phase string inverter by FIMER designed for cost-effective decentralized solar systems on both ground and rooftops.
9. What pricing options are available for accessing the report?
Pricing options include single-user, multi-user, and enterprise licenses priced at USD 4750, USD 5250, and USD 8750 respectively.
10. Is the market size provided in terms of value or volume?
The market size is provided in terms of value, measured in Million and volume, measured in K Unit.
11. Are there any specific market keywords associated with the report?
Yes, the market keyword associated with the report is "Energy Storage Market," which aids in identifying and referencing the specific market segment covered.
12. How do I determine which pricing option suits my needs best?
The pricing options vary based on user requirements and access needs. Individual users may opt for single-user licenses, while businesses requiring broader access may choose multi-user or enterprise licenses for cost-effective access to the report.
13. Are there any additional resources or data provided in the Energy Storage Market report?
While the report offers comprehensive insights, it's advisable to review the specific contents or supplementary materials provided to ascertain if additional resources or data are available.
14. How can I stay updated on further developments or reports in the Energy Storage Market?
To stay informed about further developments, trends, and reports in the Energy Storage Market, consider subscribing to industry newsletters, following relevant companies and organizations, or regularly checking reputable industry news sources and publications.
Methodology
Step 1 - Identification of Relevant Samples Size from Population Database


Step 2 - Approaches for Defining Global Market Size (Value, Volume* & Price*)

Note*: In applicable scenarios
Step 3 - Data Sources
Primary Research
- Web Analytics
- Survey Reports
- Research Institute
- Latest Research Reports
- Opinion Leaders
Secondary Research
- Annual Reports
- White Paper
- Latest Press Release
- Industry Association
- Paid Database
- Investor Presentations

Step 4 - Data Triangulation
Involves using different sources of information in order to increase the validity of a study
These sources are likely to be stakeholders in a program - participants, other researchers, program staff, other community members, and so on.
Then we put all data in single framework & apply various statistical tools to find out the dynamic on the market.
During the analysis stage, feedback from the stakeholder groups would be compared to determine areas of agreement as well as areas of divergence