

Key Insights
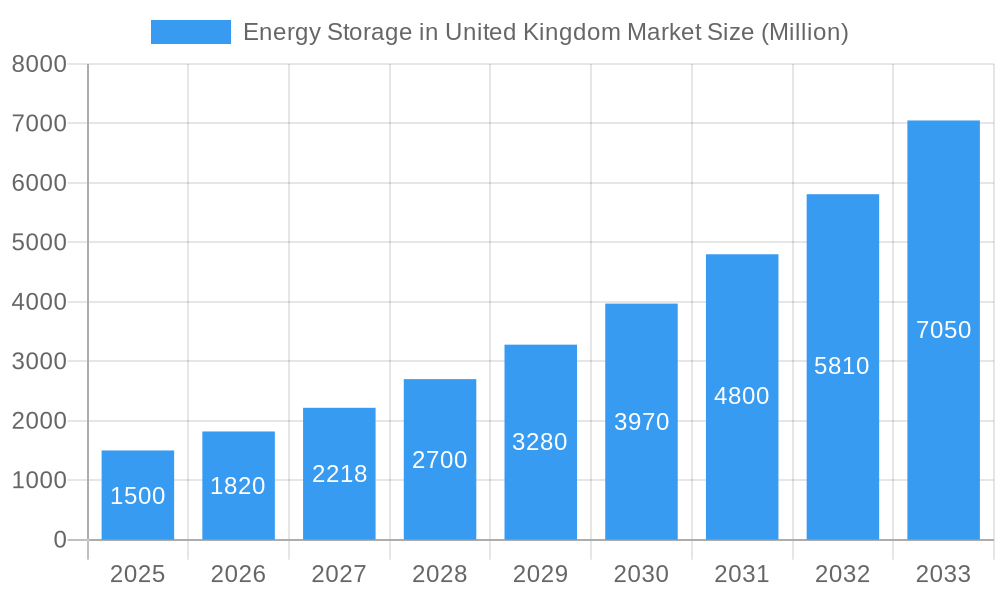
The United Kingdom energy storage market, valued at 6872 million in 2025, is poised for significant expansion, driven by the nation's commitment to renewable energy integration. This dynamic sector is projected to witness a compound annual growth rate (CAGR) of 19.57%, underscoring the critical role of energy storage in stabilizing the grid and optimizing energy management. The increasing deployment of intermittent renewable sources, such as solar and wind power, necessitates robust energy storage solutions to ensure grid reliability and address supply fluctuations.
Energy Storage in United Kingdom Market Market Size (In Billion)
Key growth drivers include supportive government policies promoting clean energy, rising electricity costs, and growing environmental consciousness. The market is segmented by technology, with batteries dominating due to rapid advancements and cost reductions, alongside pumped-storage hydroelectricity (PSH) for large-scale applications. While residential adoption is growing steadily, the commercial and industrial (C&I) sectors are demonstrating accelerated uptake, seeking cost efficiencies and enhanced operational performance.
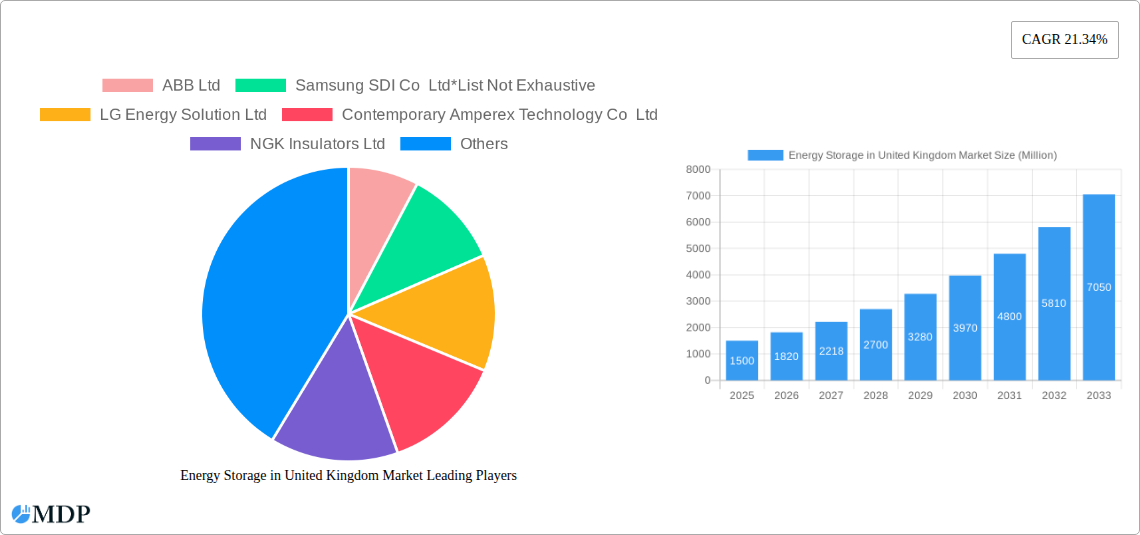
Energy Storage in United Kingdom Market Company Market Share
Major industry participants, including ABB, Samsung SDI, LG Energy Solution, and Tesla, are actively engaged in research and development, portfolio expansion, and strategic alliances to secure market leadership. Despite hurdles such as substantial initial investment, localized grid infrastructure limitations, and regulatory complexities, ongoing technological innovation, declining battery prices, and favorable government initiatives are expected to propel market growth. Future expansion will be heavily influenced by advancements in battery technology, grid modernization, and the escalating integration of renewable energy into the UK's power infrastructure.
Energy Storage in the United Kingdom Market: A Comprehensive Report (2019-2033)
This in-depth report provides a comprehensive analysis of the dynamic UK energy storage market, offering crucial insights for investors, industry stakeholders, and strategic decision-makers. Covering the period 2019-2033, with a focus on 2025, this report dissects market trends, leading players, technological advancements, and future growth potential. The report leverages extensive market research, incorporating data-driven analysis and expert insights to deliver actionable intelligence for navigating this rapidly evolving sector. Expect detailed coverage of key segments like batteries, pumped-storage hydroelectricity (PSH), and other emerging technologies, across residential, commercial & industrial (C&I) applications.
Energy Storage in United Kingdom Market Market Dynamics & Concentration
The UK energy storage market is experiencing substantial growth, driven by increasing renewable energy integration, stringent emissions targets, and supportive government policies. Market concentration is moderate, with several key players vying for dominance, alongside a burgeoning number of smaller, specialized firms. The market share held by the top five players in 2024 is estimated at xx%, indicating a competitive landscape with opportunities for both established and emerging companies. Innovation is fueled by ongoing R&D in battery technologies, improving efficiency and reducing costs. The regulatory framework, including government incentives and grid modernization initiatives, significantly shapes market development. Product substitutes, such as traditional fossil fuel-based solutions, are facing increasing pressure due to environmental concerns and economic factors. End-user trends reveal a growing preference for sustainable and reliable energy solutions, especially in the C&I sector, which drives demand. The historical period (2019-2024) saw a significant increase in M&A activity, with an estimated xx merger and acquisition deals recorded. This trend is expected to continue in the forecast period (2025-2033).
- Market Concentration: Moderate, with top 5 players holding xx% market share in 2024.
- Innovation Drivers: R&D in battery technologies, improved energy efficiency, cost reductions.
- Regulatory Framework: Supportive government policies and incentives for renewable energy integration.
- Product Substitutes: Facing increasing pressure due to environmental concerns and economic factors.
- End-User Trends: Growing preference for sustainable and reliable energy solutions, particularly in the C&I sector.
- M&A Activity: xx deals recorded in 2019-2024.
Energy Storage in United Kingdom Market Industry Trends & Analysis
The UK energy storage market is projected to witness significant growth, with a compound annual growth rate (CAGR) of xx% from 2025 to 2033. This growth is fueled by the increasing penetration of renewable energy sources, such as wind and solar, which require energy storage solutions to address intermittency issues. Technological advancements, particularly in battery technologies, are driving down costs and improving performance, making energy storage more economically viable. Consumer preferences are shifting towards sustainable and reliable energy sources, boosting demand for energy storage systems in residential, commercial, and industrial sectors. Competitive dynamics are characterized by both established energy companies and new entrants vying for market share. Market penetration in the residential sector is estimated at xx% in 2025, with significant potential for future growth. Technological disruptions, including the development of next-generation battery chemistries and advanced energy management systems, are reshaping the market landscape. The industry is also seeing increased focus on lifecycle management and sustainability considerations, impacting the adoption of particular technologies. The government's commitment to decarbonization is creating a favorable environment for the expansion of the energy storage market.
Leading Markets & Segments in Energy Storage in United Kingdom Market
The UK's C&I sector dominates the energy storage market, driven by high electricity demand and the desire for grid stability and cost savings. Batteries are the leading technology type, capturing xx% of the market share in 2025, followed by Pumped-storage Hydroelectricity (PSH) with xx% and "Other Types" with xx%.
Key Drivers for C&I Segment Dominance:
- Strong demand for reliable power supply and cost reduction.
- Government incentives and policies promoting renewable energy integration.
- Growing awareness of energy efficiency and sustainability among businesses.
Type Segmentation:
- Batteries: Leading technology due to cost reduction, modularity, and versatility. Key drivers include advancements in battery chemistry, improved energy density, and decreasing costs.
- Pumped-storage Hydroelectricity (PSH): Significant role in large-scale grid stabilization and energy arbitrage. Growth influenced by availability of suitable geographical locations and government support for hydroelectric projects.
- Other Types: Includes compressed air energy storage (CAES) and other emerging technologies; market share is smaller than batteries and PSH due to limited maturity and higher costs.
Application Segmentation:
- Commercial & Industrial (C&I): The largest segment, driven by high energy demand, reliability needs and cost optimization potential.
- Residential: A growing sector, fueled by increasing energy prices, desire for self-sufficiency, and government incentives.
Energy Storage in United Kingdom Market Product Developments
Recent product innovations focus on improving battery lifespan, energy density, and safety. Advanced battery management systems (BMS) are enhancing performance and reliability, while new applications are emerging in grid-scale energy storage and microgrids. Competition is driven by cost reduction, improved performance, and integration with smart grid technologies. The market is seeing the emergence of hybrid energy storage solutions integrating different technologies to optimize performance and cost-effectiveness. These developments are leading to increased market fit and faster adoption of energy storage technologies.
Key Drivers of Energy Storage in United Kingdom Market Growth
The UK energy storage market growth is propelled by several key factors:
- Government policies and incentives: Support for renewable energy integration and decarbonization targets. Examples include the Contracts for Difference (CfD) scheme and various grants.
- Technological advancements: Reduced battery costs and improved energy density make energy storage more economical and efficient.
- Grid modernization: Upgrades to the national grid to accommodate intermittent renewable energy sources require extensive energy storage capacity.
- Corporate sustainability goals: Many businesses are adopting sustainability goals, driving demand for clean energy solutions.
Challenges in the Energy Storage in United Kingdom Market Market
The UK energy storage market faces challenges including:
- High initial capital costs: Energy storage systems require significant upfront investment, acting as a barrier to entry for some stakeholders.
- Limited grid infrastructure: The existing grid infrastructure in some areas may require upgrading to effectively integrate large amounts of energy storage capacity.
- Supply chain risks: The dependence on imported materials for manufacturing batteries creates vulnerabilities to supply chain disruptions.
- Regulatory uncertainty: While the overall regulatory framework is supportive, certain aspects remain unclear and may affect investment decisions. This includes planning permission for large-scale projects.
Emerging Opportunities in Energy Storage in United Kingdom Market
Significant opportunities exist in the UK's energy storage market, stemming from:
- Technological breakthroughs: Continued improvements in battery technologies and the emergence of new storage solutions.
- Strategic partnerships: Collaboration between energy companies, technology providers, and government agencies to accelerate deployment.
- Market expansion: Growing demand across diverse sectors, including transportation, and the integration of energy storage into smart grids.
- Focus on second-life battery applications: Expanding the market by re-purposing spent batteries from electric vehicles for stationary storage applications.
Leading Players in the Energy Storage in United Kingdom Market Sector
- ABB Ltd
- Samsung SDI Co Ltd
- LG Energy Solution Ltd
- Contemporary Amperex Technology Co Ltd
- NGK Insulators Ltd
- Electricite de France SA (EDF)
- Wartsila Oyj Abp
- Tesla Inc
- Siemens Energy AG
- General Electric Company
Key Milestones in Energy Storage in United Kingdom Market Industry
- June 2022: Quinbrook Infrastructure Partners acquired development rights for a 230 MW/460 MWh battery energy storage project in Wales, signifying substantial investment in large-scale energy storage. Expected commissioning by end of 2024.
- January 2022: Voltalia commissioned the Hallen BESS project (32 MW/32 MWh), demonstrating progress in deploying lithium-ion battery storage facilities in the UK.
Strategic Outlook for Energy Storage in United Kingdom Market Market
The UK energy storage market presents a compelling investment opportunity with substantial growth potential. Government support, technological advancements, and increasing demand from various sectors create a favorable environment for market expansion. Strategic partnerships and innovative business models are crucial for success in this competitive landscape. The focus on grid stability, renewable energy integration, and decarbonization will further drive demand. The market's evolution will be characterized by continued technological innovation, cost reductions, and increased market penetration across all sectors.
Energy Storage in United Kingdom Market Segmentation
-
1. Type
- 1.1. Batteries
- 1.2. Pumped-storage Hydroelectricity (PSH)
- 1.3. Other Types
-
2. Application
- 2.1. Residential
- 2.2. Commercial and Industrial (C&I)
Energy Storage in United Kingdom Market Segmentation By Geography
-
1. North America
- 1.1. United States
- 1.2. Canada
- 1.3. Mexico
-
2. South America
- 2.1. Brazil
- 2.2. Argentina
- 2.3. Rest of South America
-
3. Europe
- 3.1. United Kingdom
- 3.2. Germany
- 3.3. France
- 3.4. Italy
- 3.5. Spain
- 3.6. Russia
- 3.7. Benelux
- 3.8. Nordics
- 3.9. Rest of Europe
-
4. Middle East & Africa
- 4.1. Turkey
- 4.2. Israel
- 4.3. GCC
- 4.4. North Africa
- 4.5. South Africa
- 4.6. Rest of Middle East & Africa
-
5. Asia Pacific
- 5.1. China
- 5.2. India
- 5.3. Japan
- 5.4. South Korea
- 5.5. ASEAN
- 5.6. Oceania
- 5.7. Rest of Asia Pacific
Energy Storage in United Kingdom Market Regional Market Share
Geographic Coverage of Energy Storage in United Kingdom Market
Energy Storage in United Kingdom Market REPORT HIGHLIGHTS
| Aspects | Details |
|---|---|
| Study Period | 2020-2034 |
| Base Year | 2025 |
| Estimated Year | 2026 |
| Forecast Period | 2026-2034 |
| Historical Period | 2020-2025 |
| Growth Rate | CAGR of 19.57% from 2020-2034 |
| Segmentation |
|
Table of Contents
- 1. Introduction
- 1.1. Research Scope
- 1.2. Market Segmentation
- 1.3. Research Objective
- 1.4. Definitions and Assumptions
- 2. Executive Summary
- 2.1. Market Snapshot
- 3. Market Dynamics
- 3.1. Market Drivers
- 3.2. Market Restrains
- 3.3. Market Trends
- 3.4. Market Opportunities
- 4. Market Factor Analysis
- 4.1. Porters Five Forces
- 4.1.1. Bargaining Power of Suppliers
- 4.1.2. Bargaining Power of Buyers
- 4.1.3. Threat of New Entrants
- 4.1.4. Threat of Substitutes
- 4.1.5. Competitive Rivalry
- 4.2. PESTEL analysis
- 4.3. BCG Analysis
- 4.3.1. Stars (High Growth, High Market Share)
- 4.3.2. Cash Cows (Low Growth, High Market Share)
- 4.3.3. Question Mark (High Growth, Low Market Share)
- 4.3.4. Dogs (Low Growth, Low Market Share)
- 4.4. Ansoff Matrix Analysis
- 4.5. Supply Chain Analysis
- 4.6. Regulatory Landscape
- 4.7. Current Market Potential and Opportunity Assessment (TAM–SAM–SOM Framework)
- 4.8. MDP Analyst Note
- 4.1. Porters Five Forces
- 5. Market Analysis, Insights and Forecast 2021-2033
- 5.1. Market Analysis, Insights and Forecast - by Type
- 5.1.1. Batteries
- 5.1.2. Pumped-storage Hydroelectricity (PSH)
- 5.1.3. Other Types
- 5.2. Market Analysis, Insights and Forecast - by Application
- 5.2.1. Residential
- 5.2.2. Commercial and Industrial (C&I)
- 5.3. Market Analysis, Insights and Forecast - by Region
- 5.3.1. North America
- 5.3.2. South America
- 5.3.3. Europe
- 5.3.4. Middle East & Africa
- 5.3.5. Asia Pacific
- 5.1. Market Analysis, Insights and Forecast - by Type
- 6. Global Energy Storage in United Kingdom Market Analysis, Insights and Forecast, 2021-2033
- 6.1. Market Analysis, Insights and Forecast - by Type
- 6.1.1. Batteries
- 6.1.2. Pumped-storage Hydroelectricity (PSH)
- 6.1.3. Other Types
- 6.2. Market Analysis, Insights and Forecast - by Application
- 6.2.1. Residential
- 6.2.2. Commercial and Industrial (C&I)
- 6.1. Market Analysis, Insights and Forecast - by Type
- 7. North America Energy Storage in United Kingdom Market Analysis, Insights and Forecast, 2020-2032
- 7.1. Market Analysis, Insights and Forecast - by Type
- 7.1.1. Batteries
- 7.1.2. Pumped-storage Hydroelectricity (PSH)
- 7.1.3. Other Types
- 7.2. Market Analysis, Insights and Forecast - by Application
- 7.2.1. Residential
- 7.2.2. Commercial and Industrial (C&I)
- 7.1. Market Analysis, Insights and Forecast - by Type
- 8. South America Energy Storage in United Kingdom Market Analysis, Insights and Forecast, 2020-2032
- 8.1. Market Analysis, Insights and Forecast - by Type
- 8.1.1. Batteries
- 8.1.2. Pumped-storage Hydroelectricity (PSH)
- 8.1.3. Other Types
- 8.2. Market Analysis, Insights and Forecast - by Application
- 8.2.1. Residential
- 8.2.2. Commercial and Industrial (C&I)
- 8.1. Market Analysis, Insights and Forecast - by Type
- 9. Europe Energy Storage in United Kingdom Market Analysis, Insights and Forecast, 2020-2032
- 9.1. Market Analysis, Insights and Forecast - by Type
- 9.1.1. Batteries
- 9.1.2. Pumped-storage Hydroelectricity (PSH)
- 9.1.3. Other Types
- 9.2. Market Analysis, Insights and Forecast - by Application
- 9.2.1. Residential
- 9.2.2. Commercial and Industrial (C&I)
- 9.1. Market Analysis, Insights and Forecast - by Type
- 10. Middle East & Africa Energy Storage in United Kingdom Market Analysis, Insights and Forecast, 2020-2032
- 10.1. Market Analysis, Insights and Forecast - by Type
- 10.1.1. Batteries
- 10.1.2. Pumped-storage Hydroelectricity (PSH)
- 10.1.3. Other Types
- 10.2. Market Analysis, Insights and Forecast - by Application
- 10.2.1. Residential
- 10.2.2. Commercial and Industrial (C&I)
- 10.1. Market Analysis, Insights and Forecast - by Type
- 11. Asia Pacific Energy Storage in United Kingdom Market Analysis, Insights and Forecast, 2020-2032
- 11.1. Market Analysis, Insights and Forecast - by Type
- 11.1.1. Batteries
- 11.1.2. Pumped-storage Hydroelectricity (PSH)
- 11.1.3. Other Types
- 11.2. Market Analysis, Insights and Forecast - by Application
- 11.2.1. Residential
- 11.2.2. Commercial and Industrial (C&I)
- 11.1. Market Analysis, Insights and Forecast - by Type
- 12. Competitive Analysis
- 12.1. Company Profiles
- 12.1.1 ABB Ltd
- 12.1.1.1. Company Overview
- 12.1.1.2. Products
- 12.1.1.3. Company Financials
- 12.1.1.4. SWOT Analysis
- 12.1.2 Samsung SDI Co Ltd*List Not Exhaustive
- 12.1.2.1. Company Overview
- 12.1.2.2. Products
- 12.1.2.3. Company Financials
- 12.1.2.4. SWOT Analysis
- 12.1.3 LG Energy Solution Ltd
- 12.1.3.1. Company Overview
- 12.1.3.2. Products
- 12.1.3.3. Company Financials
- 12.1.3.4. SWOT Analysis
- 12.1.4 Contemporary Amperex Technology Co Ltd
- 12.1.4.1. Company Overview
- 12.1.4.2. Products
- 12.1.4.3. Company Financials
- 12.1.4.4. SWOT Analysis
- 12.1.5 NGK Insulators Ltd
- 12.1.5.1. Company Overview
- 12.1.5.2. Products
- 12.1.5.3. Company Financials
- 12.1.5.4. SWOT Analysis
- 12.1.6 Electricite de France SA (EDF)
- 12.1.6.1. Company Overview
- 12.1.6.2. Products
- 12.1.6.3. Company Financials
- 12.1.6.4. SWOT Analysis
- 12.1.7 Wartsila Oyj Abp
- 12.1.7.1. Company Overview
- 12.1.7.2. Products
- 12.1.7.3. Company Financials
- 12.1.7.4. SWOT Analysis
- 12.1.8 Tesla Inc
- 12.1.8.1. Company Overview
- 12.1.8.2. Products
- 12.1.8.3. Company Financials
- 12.1.8.4. SWOT Analysis
- 12.1.9 Siemens Energy AG
- 12.1.9.1. Company Overview
- 12.1.9.2. Products
- 12.1.9.3. Company Financials
- 12.1.9.4. SWOT Analysis
- 12.1.10 General Electric Company
- 12.1.10.1. Company Overview
- 12.1.10.2. Products
- 12.1.10.3. Company Financials
- 12.1.10.4. SWOT Analysis
- 12.1.1 ABB Ltd
- 12.2. Market Entropy
- 12.2.1 Company's Key Areas Served
- 12.2.2 Recent Developments
- 12.3. Company Market Share Analysis 2025
- 12.3.1 Top 5 Companies Market Share Analysis
- 12.3.2 Top 3 Companies Market Share Analysis
- 12.4. List of Potential Customers
- 13. Research Methodology
List of Figures
- Figure 1: Global Energy Storage in United Kingdom Market Revenue Breakdown (million, %) by Region 2025 & 2033
- Figure 2: Global Energy Storage in United Kingdom Market Volume Breakdown (megawatt, %) by Region 2025 & 2033
- Figure 3: North America Energy Storage in United Kingdom Market Revenue (million), by Type 2025 & 2033
- Figure 4: North America Energy Storage in United Kingdom Market Volume (megawatt), by Type 2025 & 2033
- Figure 5: North America Energy Storage in United Kingdom Market Revenue Share (%), by Type 2025 & 2033
- Figure 6: North America Energy Storage in United Kingdom Market Volume Share (%), by Type 2025 & 2033
- Figure 7: North America Energy Storage in United Kingdom Market Revenue (million), by Application 2025 & 2033
- Figure 8: North America Energy Storage in United Kingdom Market Volume (megawatt), by Application 2025 & 2033
- Figure 9: North America Energy Storage in United Kingdom Market Revenue Share (%), by Application 2025 & 2033
- Figure 10: North America Energy Storage in United Kingdom Market Volume Share (%), by Application 2025 & 2033
- Figure 11: North America Energy Storage in United Kingdom Market Revenue (million), by Country 2025 & 2033
- Figure 12: North America Energy Storage in United Kingdom Market Volume (megawatt), by Country 2025 & 2033
- Figure 13: North America Energy Storage in United Kingdom Market Revenue Share (%), by Country 2025 & 2033
- Figure 14: North America Energy Storage in United Kingdom Market Volume Share (%), by Country 2025 & 2033
- Figure 15: South America Energy Storage in United Kingdom Market Revenue (million), by Type 2025 & 2033
- Figure 16: South America Energy Storage in United Kingdom Market Volume (megawatt), by Type 2025 & 2033
- Figure 17: South America Energy Storage in United Kingdom Market Revenue Share (%), by Type 2025 & 2033
- Figure 18: South America Energy Storage in United Kingdom Market Volume Share (%), by Type 2025 & 2033
- Figure 19: South America Energy Storage in United Kingdom Market Revenue (million), by Application 2025 & 2033
- Figure 20: South America Energy Storage in United Kingdom Market Volume (megawatt), by Application 2025 & 2033
- Figure 21: South America Energy Storage in United Kingdom Market Revenue Share (%), by Application 2025 & 2033
- Figure 22: South America Energy Storage in United Kingdom Market Volume Share (%), by Application 2025 & 2033
- Figure 23: South America Energy Storage in United Kingdom Market Revenue (million), by Country 2025 & 2033
- Figure 24: South America Energy Storage in United Kingdom Market Volume (megawatt), by Country 2025 & 2033
- Figure 25: South America Energy Storage in United Kingdom Market Revenue Share (%), by Country 2025 & 2033
- Figure 26: South America Energy Storage in United Kingdom Market Volume Share (%), by Country 2025 & 2033
- Figure 27: Europe Energy Storage in United Kingdom Market Revenue (million), by Type 2025 & 2033
- Figure 28: Europe Energy Storage in United Kingdom Market Volume (megawatt), by Type 2025 & 2033
- Figure 29: Europe Energy Storage in United Kingdom Market Revenue Share (%), by Type 2025 & 2033
- Figure 30: Europe Energy Storage in United Kingdom Market Volume Share (%), by Type 2025 & 2033
- Figure 31: Europe Energy Storage in United Kingdom Market Revenue (million), by Application 2025 & 2033
- Figure 32: Europe Energy Storage in United Kingdom Market Volume (megawatt), by Application 2025 & 2033
- Figure 33: Europe Energy Storage in United Kingdom Market Revenue Share (%), by Application 2025 & 2033
- Figure 34: Europe Energy Storage in United Kingdom Market Volume Share (%), by Application 2025 & 2033
- Figure 35: Europe Energy Storage in United Kingdom Market Revenue (million), by Country 2025 & 2033
- Figure 36: Europe Energy Storage in United Kingdom Market Volume (megawatt), by Country 2025 & 2033
- Figure 37: Europe Energy Storage in United Kingdom Market Revenue Share (%), by Country 2025 & 2033
- Figure 38: Europe Energy Storage in United Kingdom Market Volume Share (%), by Country 2025 & 2033
- Figure 39: Middle East & Africa Energy Storage in United Kingdom Market Revenue (million), by Type 2025 & 2033
- Figure 40: Middle East & Africa Energy Storage in United Kingdom Market Volume (megawatt), by Type 2025 & 2033
- Figure 41: Middle East & Africa Energy Storage in United Kingdom Market Revenue Share (%), by Type 2025 & 2033
- Figure 42: Middle East & Africa Energy Storage in United Kingdom Market Volume Share (%), by Type 2025 & 2033
- Figure 43: Middle East & Africa Energy Storage in United Kingdom Market Revenue (million), by Application 2025 & 2033
- Figure 44: Middle East & Africa Energy Storage in United Kingdom Market Volume (megawatt), by Application 2025 & 2033
- Figure 45: Middle East & Africa Energy Storage in United Kingdom Market Revenue Share (%), by Application 2025 & 2033
- Figure 46: Middle East & Africa Energy Storage in United Kingdom Market Volume Share (%), by Application 2025 & 2033
- Figure 47: Middle East & Africa Energy Storage in United Kingdom Market Revenue (million), by Country 2025 & 2033
- Figure 48: Middle East & Africa Energy Storage in United Kingdom Market Volume (megawatt), by Country 2025 & 2033
- Figure 49: Middle East & Africa Energy Storage in United Kingdom Market Revenue Share (%), by Country 2025 & 2033
- Figure 50: Middle East & Africa Energy Storage in United Kingdom Market Volume Share (%), by Country 2025 & 2033
- Figure 51: Asia Pacific Energy Storage in United Kingdom Market Revenue (million), by Type 2025 & 2033
- Figure 52: Asia Pacific Energy Storage in United Kingdom Market Volume (megawatt), by Type 2025 & 2033
- Figure 53: Asia Pacific Energy Storage in United Kingdom Market Revenue Share (%), by Type 2025 & 2033
- Figure 54: Asia Pacific Energy Storage in United Kingdom Market Volume Share (%), by Type 2025 & 2033
- Figure 55: Asia Pacific Energy Storage in United Kingdom Market Revenue (million), by Application 2025 & 2033
- Figure 56: Asia Pacific Energy Storage in United Kingdom Market Volume (megawatt), by Application 2025 & 2033
- Figure 57: Asia Pacific Energy Storage in United Kingdom Market Revenue Share (%), by Application 2025 & 2033
- Figure 58: Asia Pacific Energy Storage in United Kingdom Market Volume Share (%), by Application 2025 & 2033
- Figure 59: Asia Pacific Energy Storage in United Kingdom Market Revenue (million), by Country 2025 & 2033
- Figure 60: Asia Pacific Energy Storage in United Kingdom Market Volume (megawatt), by Country 2025 & 2033
- Figure 61: Asia Pacific Energy Storage in United Kingdom Market Revenue Share (%), by Country 2025 & 2033
- Figure 62: Asia Pacific Energy Storage in United Kingdom Market Volume Share (%), by Country 2025 & 2033
List of Tables
- Table 1: Global Energy Storage in United Kingdom Market Revenue million Forecast, by Type 2020 & 2033
- Table 2: Global Energy Storage in United Kingdom Market Volume megawatt Forecast, by Type 2020 & 2033
- Table 3: Global Energy Storage in United Kingdom Market Revenue million Forecast, by Application 2020 & 2033
- Table 4: Global Energy Storage in United Kingdom Market Volume megawatt Forecast, by Application 2020 & 2033
- Table 5: Global Energy Storage in United Kingdom Market Revenue million Forecast, by Region 2020 & 2033
- Table 6: Global Energy Storage in United Kingdom Market Volume megawatt Forecast, by Region 2020 & 2033
- Table 7: Global Energy Storage in United Kingdom Market Revenue million Forecast, by Type 2020 & 2033
- Table 8: Global Energy Storage in United Kingdom Market Volume megawatt Forecast, by Type 2020 & 2033
- Table 9: Global Energy Storage in United Kingdom Market Revenue million Forecast, by Application 2020 & 2033
- Table 10: Global Energy Storage in United Kingdom Market Volume megawatt Forecast, by Application 2020 & 2033
- Table 11: Global Energy Storage in United Kingdom Market Revenue million Forecast, by Country 2020 & 2033
- Table 12: Global Energy Storage in United Kingdom Market Volume megawatt Forecast, by Country 2020 & 2033
- Table 13: United States Energy Storage in United Kingdom Market Revenue (million) Forecast, by Application 2020 & 2033
- Table 14: United States Energy Storage in United Kingdom Market Volume (megawatt) Forecast, by Application 2020 & 2033
- Table 15: Canada Energy Storage in United Kingdom Market Revenue (million) Forecast, by Application 2020 & 2033
- Table 16: Canada Energy Storage in United Kingdom Market Volume (megawatt) Forecast, by Application 2020 & 2033
- Table 17: Mexico Energy Storage in United Kingdom Market Revenue (million) Forecast, by Application 2020 & 2033
- Table 18: Mexico Energy Storage in United Kingdom Market Volume (megawatt) Forecast, by Application 2020 & 2033
- Table 19: Global Energy Storage in United Kingdom Market Revenue million Forecast, by Type 2020 & 2033
- Table 20: Global Energy Storage in United Kingdom Market Volume megawatt Forecast, by Type 2020 & 2033
- Table 21: Global Energy Storage in United Kingdom Market Revenue million Forecast, by Application 2020 & 2033
- Table 22: Global Energy Storage in United Kingdom Market Volume megawatt Forecast, by Application 2020 & 2033
- Table 23: Global Energy Storage in United Kingdom Market Revenue million Forecast, by Country 2020 & 2033
- Table 24: Global Energy Storage in United Kingdom Market Volume megawatt Forecast, by Country 2020 & 2033
- Table 25: Brazil Energy Storage in United Kingdom Market Revenue (million) Forecast, by Application 2020 & 2033
- Table 26: Brazil Energy Storage in United Kingdom Market Volume (megawatt) Forecast, by Application 2020 & 2033
- Table 27: Argentina Energy Storage in United Kingdom Market Revenue (million) Forecast, by Application 2020 & 2033
- Table 28: Argentina Energy Storage in United Kingdom Market Volume (megawatt) Forecast, by Application 2020 & 2033
- Table 29: Rest of South America Energy Storage in United Kingdom Market Revenue (million) Forecast, by Application 2020 & 2033
- Table 30: Rest of South America Energy Storage in United Kingdom Market Volume (megawatt) Forecast, by Application 2020 & 2033
- Table 31: Global Energy Storage in United Kingdom Market Revenue million Forecast, by Type 2020 & 2033
- Table 32: Global Energy Storage in United Kingdom Market Volume megawatt Forecast, by Type 2020 & 2033
- Table 33: Global Energy Storage in United Kingdom Market Revenue million Forecast, by Application 2020 & 2033
- Table 34: Global Energy Storage in United Kingdom Market Volume megawatt Forecast, by Application 2020 & 2033
- Table 35: Global Energy Storage in United Kingdom Market Revenue million Forecast, by Country 2020 & 2033
- Table 36: Global Energy Storage in United Kingdom Market Volume megawatt Forecast, by Country 2020 & 2033
- Table 37: United Kingdom Energy Storage in United Kingdom Market Revenue (million) Forecast, by Application 2020 & 2033
- Table 38: United Kingdom Energy Storage in United Kingdom Market Volume (megawatt) Forecast, by Application 2020 & 2033
- Table 39: Germany Energy Storage in United Kingdom Market Revenue (million) Forecast, by Application 2020 & 2033
- Table 40: Germany Energy Storage in United Kingdom Market Volume (megawatt) Forecast, by Application 2020 & 2033
- Table 41: France Energy Storage in United Kingdom Market Revenue (million) Forecast, by Application 2020 & 2033
- Table 42: France Energy Storage in United Kingdom Market Volume (megawatt) Forecast, by Application 2020 & 2033
- Table 43: Italy Energy Storage in United Kingdom Market Revenue (million) Forecast, by Application 2020 & 2033
- Table 44: Italy Energy Storage in United Kingdom Market Volume (megawatt) Forecast, by Application 2020 & 2033
- Table 45: Spain Energy Storage in United Kingdom Market Revenue (million) Forecast, by Application 2020 & 2033
- Table 46: Spain Energy Storage in United Kingdom Market Volume (megawatt) Forecast, by Application 2020 & 2033
- Table 47: Russia Energy Storage in United Kingdom Market Revenue (million) Forecast, by Application 2020 & 2033
- Table 48: Russia Energy Storage in United Kingdom Market Volume (megawatt) Forecast, by Application 2020 & 2033
- Table 49: Benelux Energy Storage in United Kingdom Market Revenue (million) Forecast, by Application 2020 & 2033
- Table 50: Benelux Energy Storage in United Kingdom Market Volume (megawatt) Forecast, by Application 2020 & 2033
- Table 51: Nordics Energy Storage in United Kingdom Market Revenue (million) Forecast, by Application 2020 & 2033
- Table 52: Nordics Energy Storage in United Kingdom Market Volume (megawatt) Forecast, by Application 2020 & 2033
- Table 53: Rest of Europe Energy Storage in United Kingdom Market Revenue (million) Forecast, by Application 2020 & 2033
- Table 54: Rest of Europe Energy Storage in United Kingdom Market Volume (megawatt) Forecast, by Application 2020 & 2033
- Table 55: Global Energy Storage in United Kingdom Market Revenue million Forecast, by Type 2020 & 2033
- Table 56: Global Energy Storage in United Kingdom Market Volume megawatt Forecast, by Type 2020 & 2033
- Table 57: Global Energy Storage in United Kingdom Market Revenue million Forecast, by Application 2020 & 2033
- Table 58: Global Energy Storage in United Kingdom Market Volume megawatt Forecast, by Application 2020 & 2033
- Table 59: Global Energy Storage in United Kingdom Market Revenue million Forecast, by Country 2020 & 2033
- Table 60: Global Energy Storage in United Kingdom Market Volume megawatt Forecast, by Country 2020 & 2033
- Table 61: Turkey Energy Storage in United Kingdom Market Revenue (million) Forecast, by Application 2020 & 2033
- Table 62: Turkey Energy Storage in United Kingdom Market Volume (megawatt) Forecast, by Application 2020 & 2033
- Table 63: Israel Energy Storage in United Kingdom Market Revenue (million) Forecast, by Application 2020 & 2033
- Table 64: Israel Energy Storage in United Kingdom Market Volume (megawatt) Forecast, by Application 2020 & 2033
- Table 65: GCC Energy Storage in United Kingdom Market Revenue (million) Forecast, by Application 2020 & 2033
- Table 66: GCC Energy Storage in United Kingdom Market Volume (megawatt) Forecast, by Application 2020 & 2033
- Table 67: North Africa Energy Storage in United Kingdom Market Revenue (million) Forecast, by Application 2020 & 2033
- Table 68: North Africa Energy Storage in United Kingdom Market Volume (megawatt) Forecast, by Application 2020 & 2033
- Table 69: South Africa Energy Storage in United Kingdom Market Revenue (million) Forecast, by Application 2020 & 2033
- Table 70: South Africa Energy Storage in United Kingdom Market Volume (megawatt) Forecast, by Application 2020 & 2033
- Table 71: Rest of Middle East & Africa Energy Storage in United Kingdom Market Revenue (million) Forecast, by Application 2020 & 2033
- Table 72: Rest of Middle East & Africa Energy Storage in United Kingdom Market Volume (megawatt) Forecast, by Application 2020 & 2033
- Table 73: Global Energy Storage in United Kingdom Market Revenue million Forecast, by Type 2020 & 2033
- Table 74: Global Energy Storage in United Kingdom Market Volume megawatt Forecast, by Type 2020 & 2033
- Table 75: Global Energy Storage in United Kingdom Market Revenue million Forecast, by Application 2020 & 2033
- Table 76: Global Energy Storage in United Kingdom Market Volume megawatt Forecast, by Application 2020 & 2033
- Table 77: Global Energy Storage in United Kingdom Market Revenue million Forecast, by Country 2020 & 2033
- Table 78: Global Energy Storage in United Kingdom Market Volume megawatt Forecast, by Country 2020 & 2033
- Table 79: China Energy Storage in United Kingdom Market Revenue (million) Forecast, by Application 2020 & 2033
- Table 80: China Energy Storage in United Kingdom Market Volume (megawatt) Forecast, by Application 2020 & 2033
- Table 81: India Energy Storage in United Kingdom Market Revenue (million) Forecast, by Application 2020 & 2033
- Table 82: India Energy Storage in United Kingdom Market Volume (megawatt) Forecast, by Application 2020 & 2033
- Table 83: Japan Energy Storage in United Kingdom Market Revenue (million) Forecast, by Application 2020 & 2033
- Table 84: Japan Energy Storage in United Kingdom Market Volume (megawatt) Forecast, by Application 2020 & 2033
- Table 85: South Korea Energy Storage in United Kingdom Market Revenue (million) Forecast, by Application 2020 & 2033
- Table 86: South Korea Energy Storage in United Kingdom Market Volume (megawatt) Forecast, by Application 2020 & 2033
- Table 87: ASEAN Energy Storage in United Kingdom Market Revenue (million) Forecast, by Application 2020 & 2033
- Table 88: ASEAN Energy Storage in United Kingdom Market Volume (megawatt) Forecast, by Application 2020 & 2033
- Table 89: Oceania Energy Storage in United Kingdom Market Revenue (million) Forecast, by Application 2020 & 2033
- Table 90: Oceania Energy Storage in United Kingdom Market Volume (megawatt) Forecast, by Application 2020 & 2033
- Table 91: Rest of Asia Pacific Energy Storage in United Kingdom Market Revenue (million) Forecast, by Application 2020 & 2033
- Table 92: Rest of Asia Pacific Energy Storage in United Kingdom Market Volume (megawatt) Forecast, by Application 2020 & 2033
Frequently Asked Questions
1. What is the projected Compound Annual Growth Rate (CAGR) of the Energy Storage in United Kingdom Market?
The projected CAGR is approximately 19.57%.
2. Which companies are prominent players in the Energy Storage in United Kingdom Market?
Key companies in the market include ABB Ltd, Samsung SDI Co Ltd*List Not Exhaustive, LG Energy Solution Ltd, Contemporary Amperex Technology Co Ltd, NGK Insulators Ltd, Electricite de France SA (EDF), Wartsila Oyj Abp, Tesla Inc, Siemens Energy AG, General Electric Company.
3. What are the main segments of the Energy Storage in United Kingdom Market?
The market segments include Type, Application.
4. Can you provide details about the market size?
The market size is estimated to be USD 6872 million as of 2022.
5. What are some drivers contributing to market growth?
4.; The High Amount of Waste Generation in the Country4.; The growing Focus on Non-Fossil Fuel Sources.
6. What are the notable trends driving market growth?
Battery Energy Storage Systems Expected to Witness Significant Demand.
7. Are there any restraints impacting market growth?
4.; The Recycling Rate of Waste in Germany.
8. Can you provide examples of recent developments in the market?
Jun 2022: Quinbrook Infrastructure Partners acquired exclusive project development rights for the 230 MW/460 MWh battery energy storage project in Wales, United Kingdom. The battery energy storage system will be at the former Uskmouth coal-fired power station in South Wales, which closed in 2015. The project development rights were acquired from Simec Atlantis Energy, and the BESS is expected to be commissioned by the end of 2024.
9. What pricing options are available for accessing the report?
Pricing options include single-user, multi-user, and enterprise licenses priced at USD 3800, USD 4500, and USD 5800 respectively.
10. Is the market size provided in terms of value or volume?
The market size is provided in terms of value, measured in million and volume, measured in megawatt.
11. Are there any specific market keywords associated with the report?
Yes, the market keyword associated with the report is "Energy Storage in United Kingdom Market," which aids in identifying and referencing the specific market segment covered.
12. How do I determine which pricing option suits my needs best?
The pricing options vary based on user requirements and access needs. Individual users may opt for single-user licenses, while businesses requiring broader access may choose multi-user or enterprise licenses for cost-effective access to the report.
13. Are there any additional resources or data provided in the Energy Storage in United Kingdom Market report?
While the report offers comprehensive insights, it's advisable to review the specific contents or supplementary materials provided to ascertain if additional resources or data are available.
14. How can I stay updated on further developments or reports in the Energy Storage in United Kingdom Market?
To stay informed about further developments, trends, and reports in the Energy Storage in United Kingdom Market, consider subscribing to industry newsletters, following relevant companies and organizations, or regularly checking reputable industry news sources and publications.
Methodology
Step 1 - Identification of Relevant Samples Size from Population Database


Step 2 - Approaches for Defining Global Market Size (Value, Volume* & Price*)

Note*: In applicable scenarios
Step 3 - Data Sources
Primary Research
- Web Analytics
- Survey Reports
- Research Institute
- Latest Research Reports
- Opinion Leaders
Secondary Research
- Annual Reports
- White Paper
- Latest Press Release
- Industry Association
- Paid Database
- Investor Presentations

Step 4 - Data Triangulation
Involves using different sources of information in order to increase the validity of a study
These sources are likely to be stakeholders in a program - participants, other researchers, program staff, other community members, and so on.
Then we put all data in single framework & apply various statistical tools to find out the dynamic on the market.
During the analysis stage, feedback from the stakeholder groups would be compared to determine areas of agreement as well as areas of divergence