

Key Insights
The global edible packaging market is experiencing substantial growth, propelled by escalating consumer preference for sustainable and eco-friendly alternatives to traditional plastic packaging. This surge is directly linked to heightened environmental awareness and the increasing popularity of convenient, innovative food products. Consumers are actively seeking packaging solutions that integrate directly with food, thereby reducing waste and disposal needs. This trend is particularly pronounced in the food and beverage sector, where companies are prioritizing sustainability to attract environmentally conscious consumers. Key growth catalysts include the rising demand for ready-to-eat meals, expanding snack food markets, and the increasing adoption of e-commerce for food delivery. The market is segmented by material (e.g., seaweed, starch-based, protein-based), application (e.g., confectionery, bakery, meat and poultry), and geographic region. Leading market players are actively engaged in product innovation and strategic collaborations to enhance their competitive positioning.
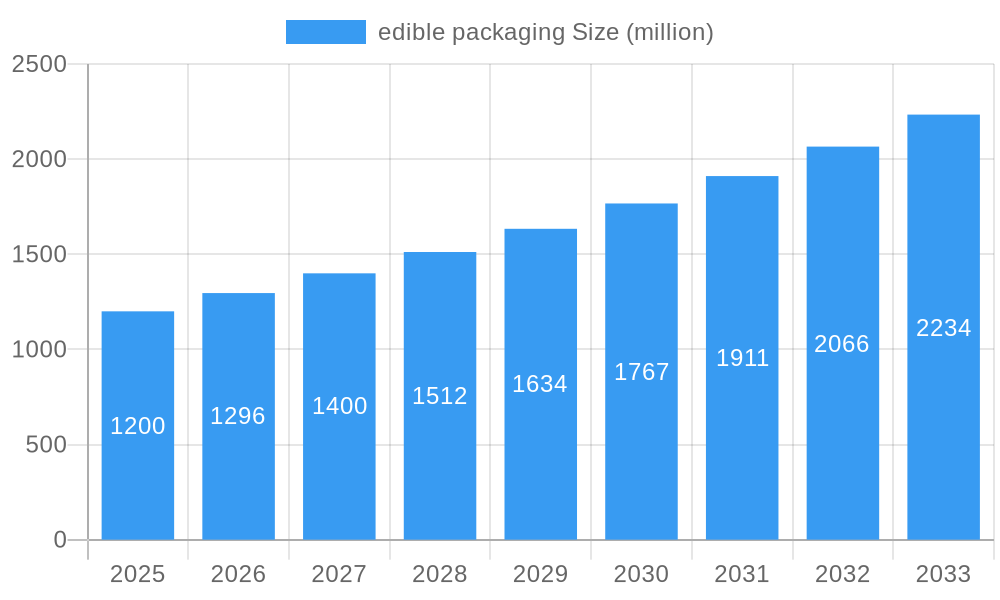
edible packaging Market Size (In Billion)
The edible packaging market is projected for significant expansion, with a Compound Annual Growth Rate (CAGR) of 14.2%. The market size was valued at $2.08 billion in the base year 2025 and is anticipated to reach substantial future valuations. While challenges such as higher production costs compared to conventional materials and concerns regarding shelf-life and product integrity persist, ongoing research and development are actively addressing these limitations. Innovations in cost-effective material development and refined manufacturing processes are expected to drive broader adoption across diverse food segments. Technological advancements in material properties, including enhanced barrier capabilities and printability, are further increasing the viability of edible packaging for a wider array of applications. Furthermore, companies are focusing on developing customized solutions to meet specific consumer needs, creating additional avenues for market growth.
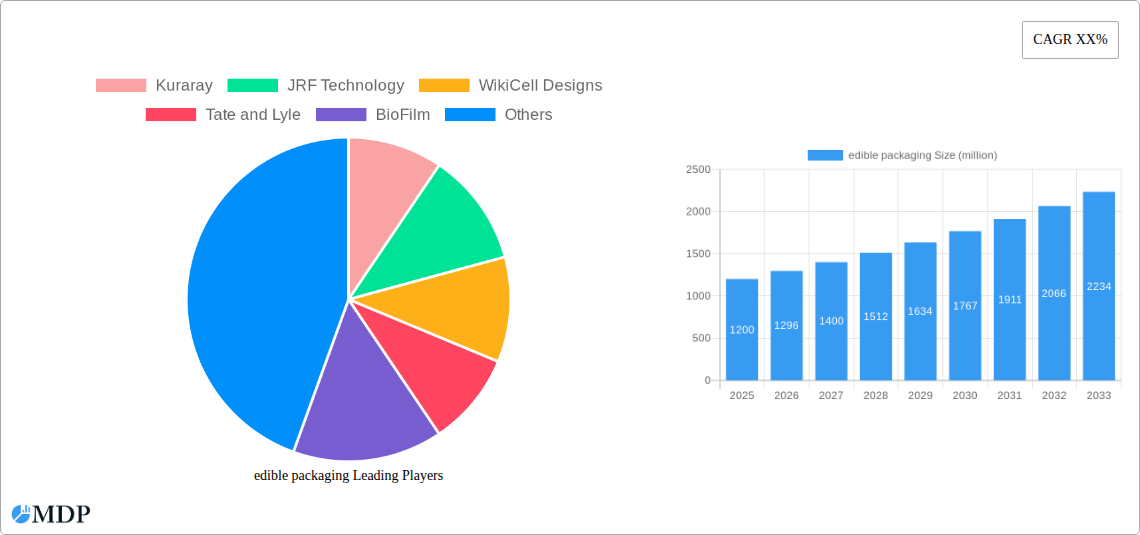
edible packaging Company Market Share
Edible Packaging Market Report: A Comprehensive Analysis of a $XX Billion Industry (2019-2033)
This comprehensive report provides an in-depth analysis of the global edible packaging market, projecting a value of $XX billion by 2033. It delves into market dynamics, industry trends, leading players, and future opportunities, offering actionable insights for stakeholders across the value chain. The report covers the period 2019-2033, with a focus on the forecast period 2025-2033 and a base year of 2025. This detailed study utilizes rigorous research methodologies and data analysis to provide a clear and concise understanding of this rapidly evolving market.
Edible Packaging Market Dynamics & Concentration
The edible packaging market is characterized by a moderately concentrated landscape, with key players such as Kuraray, JRF Technology, WikiCell Designs, Tate and Lyle, BioFilm, Devro, and Watson Inc. holding significant market share. The market concentration ratio (CR5) is estimated at XX% in 2025. Innovation is a primary driver, with companies investing heavily in research and development to create novel materials with enhanced functionalities like improved barrier properties, extended shelf life, and appealing textures. Stringent regulatory frameworks concerning food safety and biodegradability are shaping product development and market entry strategies. Substitutes like traditional packaging materials face increasing pressure due to growing consumer awareness of sustainability. Mergers and acquisitions (M&A) activity is expected to increase, with an estimated XX M&A deals projected during the forecast period. End-user trends towards convenience, sustainability, and health-conscious choices are further fueling market growth.
- Market Share: Kuraray (XX%), JRF Technology (XX%), WikiCell Designs (XX%), Others (XX%)
- M&A Activity (2019-2024): XX deals
- Projected M&A Activity (2025-2033): XX deals
- Key Innovation Drivers: Biodegradability, improved barrier properties, customized textures, and enhanced functionality.
- Regulatory Impact: Growing emphasis on food safety and environmental regulations.
Edible Packaging Industry Trends & Analysis
The edible packaging market is experiencing robust growth, driven by a CAGR of XX% during the forecast period (2025-2033). This growth is fueled by several factors: increasing consumer demand for sustainable and eco-friendly packaging solutions, technological advancements leading to the development of innovative materials (e.g., seaweed-based films, protein-based coatings), and rising consumer preference for convenient and on-the-go food products. The market penetration of edible packaging in various food segments, such as confectionery, bakery, and dairy, is steadily increasing. Competitive dynamics are intensifying, with companies focusing on product differentiation, strategic partnerships, and geographic expansion. Technological disruptions, such as advancements in 3D printing and nanotechnology, are expected to further revolutionize the edible packaging landscape. The market penetration rate is projected to reach XX% by 2033.
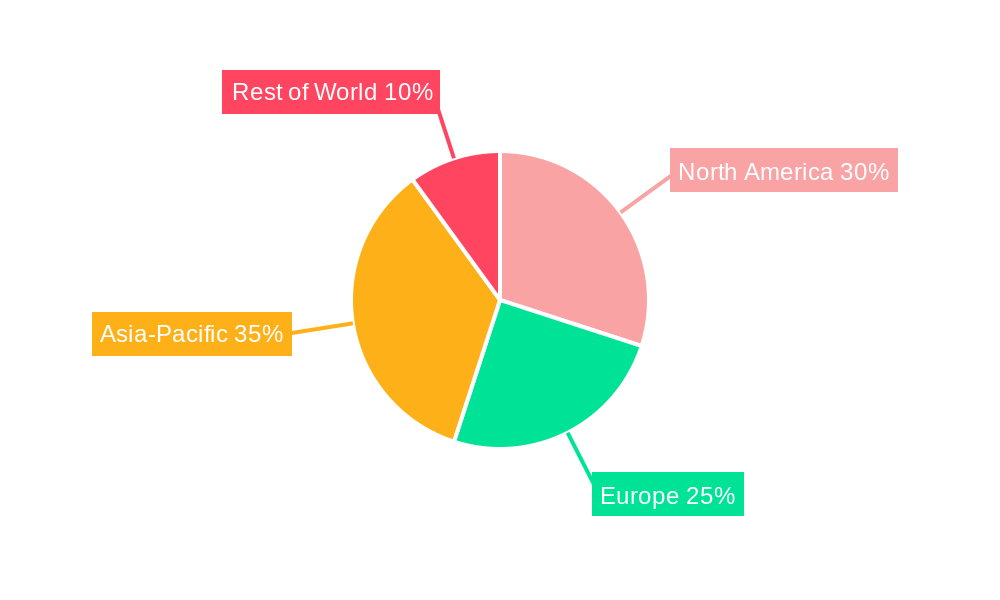
Leading Markets & Segments in Edible Packaging
The Asia-Pacific region is projected to dominate the edible packaging market throughout the forecast period, driven by factors such as rapid economic growth, increasing disposable incomes, a large and expanding population, and rising consumer awareness of sustainable packaging solutions. China and India are expected to be the key contributors to regional growth. Within segments, the confectionery and bakery sectors are leading the adoption of edible packaging due to consumer demand for innovative and visually appealing products.
- Key Drivers in Asia-Pacific: Rapid economic growth, rising disposable incomes, large population base, growing awareness of sustainability.
- Key Drivers in North America: Stringent environmental regulations, growing demand for convenient food products, high consumer spending.
- Dominant Segment: Confectionery and bakery products.
Edible Packaging Product Developments
Recent product innovations have focused on creating edible films and coatings with improved barrier properties, enhanced aesthetics, and tailored functionalities. Technological advancements in biopolymer processing, such as extrusion and casting, have allowed for the creation of flexible and customized edible packaging solutions. These developments cater to diverse applications, from individual food items to complex multi-layered packaging formats, offering competitive advantages through improved shelf-life, reduced waste, and enhanced brand appeal. The market is witnessing the adoption of bio-based polymers, nano-composites, and other innovative materials to increase the functionality and appeal of edible packaging.
Key Drivers of Edible Packaging Growth
The edible packaging market is propelled by a confluence of factors. Technological advancements leading to the creation of more sustainable, functional, and cost-effective packaging materials are significant. Growing consumer preference for eco-friendly packaging, driven by environmental awareness, is another key driver. Stringent environmental regulations and government initiatives promoting sustainable packaging solutions are further boosting market growth. Finally, the increasing demand for convenience foods and on-the-go snacks is creating new opportunities for edible packaging solutions.
Challenges in the Edible Packaging Market
Despite its promising growth trajectory, the edible packaging market faces challenges. The high cost of production compared to traditional packaging materials is a major barrier. Maintaining the quality and integrity of edible films and coatings during storage and transportation poses logistical and supply chain challenges. Furthermore, stringent regulatory approvals and standardization requirements can complicate market entry and expansion for new players. The competitive landscape also presents challenges, with existing players vying for market share. The variability of raw material costs presents another challenge for manufacturers.
Emerging Opportunities in Edible Packaging
The edible packaging market presents significant long-term growth opportunities. Continued technological breakthroughs in material science, particularly in the development of novel biopolymers and bio-composites, hold immense potential. Strategic partnerships between packaging companies, food manufacturers, and technology providers are likely to fuel innovation. Expanding into emerging markets with rising consumer demand for sustainable and innovative packaging solutions offers significant growth avenues. The development of personalized edible packaging is also creating significant growth opportunities.
Leading Players in the Edible Packaging Sector
- Kuraray
- JRF Technology
- WikiCell Designs
- Tate and Lyle
- BioFilm
- Devro
- Watson Inc
Key Milestones in Edible Packaging Industry
- 2020: Launch of seaweed-based edible films by X company.
- 2021: Introduction of biodegradable protein-based coatings by Y company.
- 2022: Acquisition of Z company specializing in edible packaging technology by A company.
- 2023: Implementation of new environmental regulations impacting edible packaging materials in the EU.
- 2024: Successful clinical trials on novel edible packaging material improving shelf-life.
Strategic Outlook for Edible Packaging Market
The edible packaging market is poised for significant growth in the coming years. The continued focus on sustainability, technological advancements, and strategic collaborations will be key growth accelerators. Expanding into new applications, such as pharmaceuticals and cosmetics, presents further opportunities. Companies that invest in research and development, embrace sustainable practices, and build strong partnerships are likely to gain a competitive edge in this rapidly evolving market. The market's future potential is significant, and proactive strategies are essential for capitalizing on this growth.
edible packaging Segmentation
-
1. Application
- 1.1. Food & Beverages
- 1.2. Pharmaceuticals
- 1.3. Others
-
2. Types
- 2.1. Polysaccharides
- 2.2. Lipid
- 2.3. Surfactant
- 2.4. Protein Films
- 2.5. Others
edible packaging Segmentation By Geography
-
1. North America
- 1.1. United States
- 1.2. Canada
- 1.3. Mexico
-
2. South America
- 2.1. Brazil
- 2.2. Argentina
- 2.3. Rest of South America
-
3. Europe
- 3.1. United Kingdom
- 3.2. Germany
- 3.3. France
- 3.4. Italy
- 3.5. Spain
- 3.6. Russia
- 3.7. Benelux
- 3.8. Nordics
- 3.9. Rest of Europe
-
4. Middle East & Africa
- 4.1. Turkey
- 4.2. Israel
- 4.3. GCC
- 4.4. North Africa
- 4.5. South Africa
- 4.6. Rest of Middle East & Africa
-
5. Asia Pacific
- 5.1. China
- 5.2. India
- 5.3. Japan
- 5.4. South Korea
- 5.5. ASEAN
- 5.6. Oceania
- 5.7. Rest of Asia Pacific
edible packaging Regional Market Share
Geographic Coverage of edible packaging
edible packaging REPORT HIGHLIGHTS
| Aspects | Details |
|---|---|
| Study Period | 2020-2034 |
| Base Year | 2025 |
| Estimated Year | 2026 |
| Forecast Period | 2026-2034 |
| Historical Period | 2020-2025 |
| Growth Rate | CAGR of 14.2% from 2020-2034 |
| Segmentation |
|
Table of Contents
- 1. Introduction
- 1.1. Research Scope
- 1.2. Market Segmentation
- 1.3. Research Objective
- 1.4. Definitions and Assumptions
- 2. Executive Summary
- 2.1. Market Snapshot
- 3. Market Dynamics
- 3.1. Market Drivers
- 3.2. Market Restrains
- 3.3. Market Trends
- 3.4. Market Opportunities
- 4. Market Factor Analysis
- 4.1. Porters Five Forces
- 4.1.1. Bargaining Power of Suppliers
- 4.1.2. Bargaining Power of Buyers
- 4.1.3. Threat of New Entrants
- 4.1.4. Threat of Substitutes
- 4.1.5. Competitive Rivalry
- 4.2. PESTEL analysis
- 4.3. BCG Analysis
- 4.3.1. Stars (High Growth, High Market Share)
- 4.3.2. Cash Cows (Low Growth, High Market Share)
- 4.3.3. Question Mark (High Growth, Low Market Share)
- 4.3.4. Dogs (Low Growth, Low Market Share)
- 4.4. Ansoff Matrix Analysis
- 4.5. Supply Chain Analysis
- 4.6. Regulatory Landscape
- 4.7. Current Market Potential and Opportunity Assessment (TAM–SAM–SOM Framework)
- 4.8. MDP Analyst Note
- 4.1. Porters Five Forces
- 5. Market Analysis, Insights and Forecast 2021-2033
- 5.1. Market Analysis, Insights and Forecast - by Application
- 5.1.1. Food & Beverages
- 5.1.2. Pharmaceuticals
- 5.1.3. Others
- 5.2. Market Analysis, Insights and Forecast - by Types
- 5.2.1. Polysaccharides
- 5.2.2. Lipid
- 5.2.3. Surfactant
- 5.2.4. Protein Films
- 5.2.5. Others
- 5.3. Market Analysis, Insights and Forecast - by Region
- 5.3.1. North America
- 5.3.2. South America
- 5.3.3. Europe
- 5.3.4. Middle East & Africa
- 5.3.5. Asia Pacific
- 5.1. Market Analysis, Insights and Forecast - by Application
- 6. Global edible packaging Analysis, Insights and Forecast, 2021-2033
- 6.1. Market Analysis, Insights and Forecast - by Application
- 6.1.1. Food & Beverages
- 6.1.2. Pharmaceuticals
- 6.1.3. Others
- 6.2. Market Analysis, Insights and Forecast - by Types
- 6.2.1. Polysaccharides
- 6.2.2. Lipid
- 6.2.3. Surfactant
- 6.2.4. Protein Films
- 6.2.5. Others
- 6.1. Market Analysis, Insights and Forecast - by Application
- 7. North America edible packaging Analysis, Insights and Forecast, 2020-2032
- 7.1. Market Analysis, Insights and Forecast - by Application
- 7.1.1. Food & Beverages
- 7.1.2. Pharmaceuticals
- 7.1.3. Others
- 7.2. Market Analysis, Insights and Forecast - by Types
- 7.2.1. Polysaccharides
- 7.2.2. Lipid
- 7.2.3. Surfactant
- 7.2.4. Protein Films
- 7.2.5. Others
- 7.1. Market Analysis, Insights and Forecast - by Application
- 8. South America edible packaging Analysis, Insights and Forecast, 2020-2032
- 8.1. Market Analysis, Insights and Forecast - by Application
- 8.1.1. Food & Beverages
- 8.1.2. Pharmaceuticals
- 8.1.3. Others
- 8.2. Market Analysis, Insights and Forecast - by Types
- 8.2.1. Polysaccharides
- 8.2.2. Lipid
- 8.2.3. Surfactant
- 8.2.4. Protein Films
- 8.2.5. Others
- 8.1. Market Analysis, Insights and Forecast - by Application
- 9. Europe edible packaging Analysis, Insights and Forecast, 2020-2032
- 9.1. Market Analysis, Insights and Forecast - by Application
- 9.1.1. Food & Beverages
- 9.1.2. Pharmaceuticals
- 9.1.3. Others
- 9.2. Market Analysis, Insights and Forecast - by Types
- 9.2.1. Polysaccharides
- 9.2.2. Lipid
- 9.2.3. Surfactant
- 9.2.4. Protein Films
- 9.2.5. Others
- 9.1. Market Analysis, Insights and Forecast - by Application
- 10. Middle East & Africa edible packaging Analysis, Insights and Forecast, 2020-2032
- 10.1. Market Analysis, Insights and Forecast - by Application
- 10.1.1. Food & Beverages
- 10.1.2. Pharmaceuticals
- 10.1.3. Others
- 10.2. Market Analysis, Insights and Forecast - by Types
- 10.2.1. Polysaccharides
- 10.2.2. Lipid
- 10.2.3. Surfactant
- 10.2.4. Protein Films
- 10.2.5. Others
- 10.1. Market Analysis, Insights and Forecast - by Application
- 11. Asia Pacific edible packaging Analysis, Insights and Forecast, 2020-2032
- 11.1. Market Analysis, Insights and Forecast - by Application
- 11.1.1. Food & Beverages
- 11.1.2. Pharmaceuticals
- 11.1.3. Others
- 11.2. Market Analysis, Insights and Forecast - by Types
- 11.2.1. Polysaccharides
- 11.2.2. Lipid
- 11.2.3. Surfactant
- 11.2.4. Protein Films
- 11.2.5. Others
- 11.1. Market Analysis, Insights and Forecast - by Application
- 12. Competitive Analysis
- 12.1. Company Profiles
- 12.1.1 Kuraray
- 12.1.1.1. Company Overview
- 12.1.1.2. Products
- 12.1.1.3. Company Financials
- 12.1.1.4. SWOT Analysis
- 12.1.2 JRF Technology
- 12.1.2.1. Company Overview
- 12.1.2.2. Products
- 12.1.2.3. Company Financials
- 12.1.2.4. SWOT Analysis
- 12.1.3 WikiCell Designs
- 12.1.3.1. Company Overview
- 12.1.3.2. Products
- 12.1.3.3. Company Financials
- 12.1.3.4. SWOT Analysis
- 12.1.4 Tate and Lyle
- 12.1.4.1. Company Overview
- 12.1.4.2. Products
- 12.1.4.3. Company Financials
- 12.1.4.4. SWOT Analysis
- 12.1.5 BioFilm
- 12.1.5.1. Company Overview
- 12.1.5.2. Products
- 12.1.5.3. Company Financials
- 12.1.5.4. SWOT Analysis
- 12.1.6 Devro
- 12.1.6.1. Company Overview
- 12.1.6.2. Products
- 12.1.6.3. Company Financials
- 12.1.6.4. SWOT Analysis
- 12.1.7 Watson Inc
- 12.1.7.1. Company Overview
- 12.1.7.2. Products
- 12.1.7.3. Company Financials
- 12.1.7.4. SWOT Analysis
- 12.1.1 Kuraray
- 12.2. Market Entropy
- 12.2.1 Company's Key Areas Served
- 12.2.2 Recent Developments
- 12.3. Company Market Share Analysis 2025
- 12.3.1 Top 5 Companies Market Share Analysis
- 12.3.2 Top 3 Companies Market Share Analysis
- 12.4. List of Potential Customers
- 13. Research Methodology
List of Figures
- Figure 1: Global edible packaging Revenue Breakdown (billion, %) by Region 2025 & 2033
- Figure 2: Global edible packaging Volume Breakdown (K, %) by Region 2025 & 2033
- Figure 3: North America edible packaging Revenue (billion), by Application 2025 & 2033
- Figure 4: North America edible packaging Volume (K), by Application 2025 & 2033
- Figure 5: North America edible packaging Revenue Share (%), by Application 2025 & 2033
- Figure 6: North America edible packaging Volume Share (%), by Application 2025 & 2033
- Figure 7: North America edible packaging Revenue (billion), by Types 2025 & 2033
- Figure 8: North America edible packaging Volume (K), by Types 2025 & 2033
- Figure 9: North America edible packaging Revenue Share (%), by Types 2025 & 2033
- Figure 10: North America edible packaging Volume Share (%), by Types 2025 & 2033
- Figure 11: North America edible packaging Revenue (billion), by Country 2025 & 2033
- Figure 12: North America edible packaging Volume (K), by Country 2025 & 2033
- Figure 13: North America edible packaging Revenue Share (%), by Country 2025 & 2033
- Figure 14: North America edible packaging Volume Share (%), by Country 2025 & 2033
- Figure 15: South America edible packaging Revenue (billion), by Application 2025 & 2033
- Figure 16: South America edible packaging Volume (K), by Application 2025 & 2033
- Figure 17: South America edible packaging Revenue Share (%), by Application 2025 & 2033
- Figure 18: South America edible packaging Volume Share (%), by Application 2025 & 2033
- Figure 19: South America edible packaging Revenue (billion), by Types 2025 & 2033
- Figure 20: South America edible packaging Volume (K), by Types 2025 & 2033
- Figure 21: South America edible packaging Revenue Share (%), by Types 2025 & 2033
- Figure 22: South America edible packaging Volume Share (%), by Types 2025 & 2033
- Figure 23: South America edible packaging Revenue (billion), by Country 2025 & 2033
- Figure 24: South America edible packaging Volume (K), by Country 2025 & 2033
- Figure 25: South America edible packaging Revenue Share (%), by Country 2025 & 2033
- Figure 26: South America edible packaging Volume Share (%), by Country 2025 & 2033
- Figure 27: Europe edible packaging Revenue (billion), by Application 2025 & 2033
- Figure 28: Europe edible packaging Volume (K), by Application 2025 & 2033
- Figure 29: Europe edible packaging Revenue Share (%), by Application 2025 & 2033
- Figure 30: Europe edible packaging Volume Share (%), by Application 2025 & 2033
- Figure 31: Europe edible packaging Revenue (billion), by Types 2025 & 2033
- Figure 32: Europe edible packaging Volume (K), by Types 2025 & 2033
- Figure 33: Europe edible packaging Revenue Share (%), by Types 2025 & 2033
- Figure 34: Europe edible packaging Volume Share (%), by Types 2025 & 2033
- Figure 35: Europe edible packaging Revenue (billion), by Country 2025 & 2033
- Figure 36: Europe edible packaging Volume (K), by Country 2025 & 2033
- Figure 37: Europe edible packaging Revenue Share (%), by Country 2025 & 2033
- Figure 38: Europe edible packaging Volume Share (%), by Country 2025 & 2033
- Figure 39: Middle East & Africa edible packaging Revenue (billion), by Application 2025 & 2033
- Figure 40: Middle East & Africa edible packaging Volume (K), by Application 2025 & 2033
- Figure 41: Middle East & Africa edible packaging Revenue Share (%), by Application 2025 & 2033
- Figure 42: Middle East & Africa edible packaging Volume Share (%), by Application 2025 & 2033
- Figure 43: Middle East & Africa edible packaging Revenue (billion), by Types 2025 & 2033
- Figure 44: Middle East & Africa edible packaging Volume (K), by Types 2025 & 2033
- Figure 45: Middle East & Africa edible packaging Revenue Share (%), by Types 2025 & 2033
- Figure 46: Middle East & Africa edible packaging Volume Share (%), by Types 2025 & 2033
- Figure 47: Middle East & Africa edible packaging Revenue (billion), by Country 2025 & 2033
- Figure 48: Middle East & Africa edible packaging Volume (K), by Country 2025 & 2033
- Figure 49: Middle East & Africa edible packaging Revenue Share (%), by Country 2025 & 2033
- Figure 50: Middle East & Africa edible packaging Volume Share (%), by Country 2025 & 2033
- Figure 51: Asia Pacific edible packaging Revenue (billion), by Application 2025 & 2033
- Figure 52: Asia Pacific edible packaging Volume (K), by Application 2025 & 2033
- Figure 53: Asia Pacific edible packaging Revenue Share (%), by Application 2025 & 2033
- Figure 54: Asia Pacific edible packaging Volume Share (%), by Application 2025 & 2033
- Figure 55: Asia Pacific edible packaging Revenue (billion), by Types 2025 & 2033
- Figure 56: Asia Pacific edible packaging Volume (K), by Types 2025 & 2033
- Figure 57: Asia Pacific edible packaging Revenue Share (%), by Types 2025 & 2033
- Figure 58: Asia Pacific edible packaging Volume Share (%), by Types 2025 & 2033
- Figure 59: Asia Pacific edible packaging Revenue (billion), by Country 2025 & 2033
- Figure 60: Asia Pacific edible packaging Volume (K), by Country 2025 & 2033
- Figure 61: Asia Pacific edible packaging Revenue Share (%), by Country 2025 & 2033
- Figure 62: Asia Pacific edible packaging Volume Share (%), by Country 2025 & 2033
List of Tables
- Table 1: Global edible packaging Revenue billion Forecast, by Application 2020 & 2033
- Table 2: Global edible packaging Volume K Forecast, by Application 2020 & 2033
- Table 3: Global edible packaging Revenue billion Forecast, by Types 2020 & 2033
- Table 4: Global edible packaging Volume K Forecast, by Types 2020 & 2033
- Table 5: Global edible packaging Revenue billion Forecast, by Region 2020 & 2033
- Table 6: Global edible packaging Volume K Forecast, by Region 2020 & 2033
- Table 7: Global edible packaging Revenue billion Forecast, by Application 2020 & 2033
- Table 8: Global edible packaging Volume K Forecast, by Application 2020 & 2033
- Table 9: Global edible packaging Revenue billion Forecast, by Types 2020 & 2033
- Table 10: Global edible packaging Volume K Forecast, by Types 2020 & 2033
- Table 11: Global edible packaging Revenue billion Forecast, by Country 2020 & 2033
- Table 12: Global edible packaging Volume K Forecast, by Country 2020 & 2033
- Table 13: United States edible packaging Revenue (billion) Forecast, by Application 2020 & 2033
- Table 14: United States edible packaging Volume (K) Forecast, by Application 2020 & 2033
- Table 15: Canada edible packaging Revenue (billion) Forecast, by Application 2020 & 2033
- Table 16: Canada edible packaging Volume (K) Forecast, by Application 2020 & 2033
- Table 17: Mexico edible packaging Revenue (billion) Forecast, by Application 2020 & 2033
- Table 18: Mexico edible packaging Volume (K) Forecast, by Application 2020 & 2033
- Table 19: Global edible packaging Revenue billion Forecast, by Application 2020 & 2033
- Table 20: Global edible packaging Volume K Forecast, by Application 2020 & 2033
- Table 21: Global edible packaging Revenue billion Forecast, by Types 2020 & 2033
- Table 22: Global edible packaging Volume K Forecast, by Types 2020 & 2033
- Table 23: Global edible packaging Revenue billion Forecast, by Country 2020 & 2033
- Table 24: Global edible packaging Volume K Forecast, by Country 2020 & 2033
- Table 25: Brazil edible packaging Revenue (billion) Forecast, by Application 2020 & 2033
- Table 26: Brazil edible packaging Volume (K) Forecast, by Application 2020 & 2033
- Table 27: Argentina edible packaging Revenue (billion) Forecast, by Application 2020 & 2033
- Table 28: Argentina edible packaging Volume (K) Forecast, by Application 2020 & 2033
- Table 29: Rest of South America edible packaging Revenue (billion) Forecast, by Application 2020 & 2033
- Table 30: Rest of South America edible packaging Volume (K) Forecast, by Application 2020 & 2033
- Table 31: Global edible packaging Revenue billion Forecast, by Application 2020 & 2033
- Table 32: Global edible packaging Volume K Forecast, by Application 2020 & 2033
- Table 33: Global edible packaging Revenue billion Forecast, by Types 2020 & 2033
- Table 34: Global edible packaging Volume K Forecast, by Types 2020 & 2033
- Table 35: Global edible packaging Revenue billion Forecast, by Country 2020 & 2033
- Table 36: Global edible packaging Volume K Forecast, by Country 2020 & 2033
- Table 37: United Kingdom edible packaging Revenue (billion) Forecast, by Application 2020 & 2033
- Table 38: United Kingdom edible packaging Volume (K) Forecast, by Application 2020 & 2033
- Table 39: Germany edible packaging Revenue (billion) Forecast, by Application 2020 & 2033
- Table 40: Germany edible packaging Volume (K) Forecast, by Application 2020 & 2033
- Table 41: France edible packaging Revenue (billion) Forecast, by Application 2020 & 2033
- Table 42: France edible packaging Volume (K) Forecast, by Application 2020 & 2033
- Table 43: Italy edible packaging Revenue (billion) Forecast, by Application 2020 & 2033
- Table 44: Italy edible packaging Volume (K) Forecast, by Application 2020 & 2033
- Table 45: Spain edible packaging Revenue (billion) Forecast, by Application 2020 & 2033
- Table 46: Spain edible packaging Volume (K) Forecast, by Application 2020 & 2033
- Table 47: Russia edible packaging Revenue (billion) Forecast, by Application 2020 & 2033
- Table 48: Russia edible packaging Volume (K) Forecast, by Application 2020 & 2033
- Table 49: Benelux edible packaging Revenue (billion) Forecast, by Application 2020 & 2033
- Table 50: Benelux edible packaging Volume (K) Forecast, by Application 2020 & 2033
- Table 51: Nordics edible packaging Revenue (billion) Forecast, by Application 2020 & 2033
- Table 52: Nordics edible packaging Volume (K) Forecast, by Application 2020 & 2033
- Table 53: Rest of Europe edible packaging Revenue (billion) Forecast, by Application 2020 & 2033
- Table 54: Rest of Europe edible packaging Volume (K) Forecast, by Application 2020 & 2033
- Table 55: Global edible packaging Revenue billion Forecast, by Application 2020 & 2033
- Table 56: Global edible packaging Volume K Forecast, by Application 2020 & 2033
- Table 57: Global edible packaging Revenue billion Forecast, by Types 2020 & 2033
- Table 58: Global edible packaging Volume K Forecast, by Types 2020 & 2033
- Table 59: Global edible packaging Revenue billion Forecast, by Country 2020 & 2033
- Table 60: Global edible packaging Volume K Forecast, by Country 2020 & 2033
- Table 61: Turkey edible packaging Revenue (billion) Forecast, by Application 2020 & 2033
- Table 62: Turkey edible packaging Volume (K) Forecast, by Application 2020 & 2033
- Table 63: Israel edible packaging Revenue (billion) Forecast, by Application 2020 & 2033
- Table 64: Israel edible packaging Volume (K) Forecast, by Application 2020 & 2033
- Table 65: GCC edible packaging Revenue (billion) Forecast, by Application 2020 & 2033
- Table 66: GCC edible packaging Volume (K) Forecast, by Application 2020 & 2033
- Table 67: North Africa edible packaging Revenue (billion) Forecast, by Application 2020 & 2033
- Table 68: North Africa edible packaging Volume (K) Forecast, by Application 2020 & 2033
- Table 69: South Africa edible packaging Revenue (billion) Forecast, by Application 2020 & 2033
- Table 70: South Africa edible packaging Volume (K) Forecast, by Application 2020 & 2033
- Table 71: Rest of Middle East & Africa edible packaging Revenue (billion) Forecast, by Application 2020 & 2033
- Table 72: Rest of Middle East & Africa edible packaging Volume (K) Forecast, by Application 2020 & 2033
- Table 73: Global edible packaging Revenue billion Forecast, by Application 2020 & 2033
- Table 74: Global edible packaging Volume K Forecast, by Application 2020 & 2033
- Table 75: Global edible packaging Revenue billion Forecast, by Types 2020 & 2033
- Table 76: Global edible packaging Volume K Forecast, by Types 2020 & 2033
- Table 77: Global edible packaging Revenue billion Forecast, by Country 2020 & 2033
- Table 78: Global edible packaging Volume K Forecast, by Country 2020 & 2033
- Table 79: China edible packaging Revenue (billion) Forecast, by Application 2020 & 2033
- Table 80: China edible packaging Volume (K) Forecast, by Application 2020 & 2033
- Table 81: India edible packaging Revenue (billion) Forecast, by Application 2020 & 2033
- Table 82: India edible packaging Volume (K) Forecast, by Application 2020 & 2033
- Table 83: Japan edible packaging Revenue (billion) Forecast, by Application 2020 & 2033
- Table 84: Japan edible packaging Volume (K) Forecast, by Application 2020 & 2033
- Table 85: South Korea edible packaging Revenue (billion) Forecast, by Application 2020 & 2033
- Table 86: South Korea edible packaging Volume (K) Forecast, by Application 2020 & 2033
- Table 87: ASEAN edible packaging Revenue (billion) Forecast, by Application 2020 & 2033
- Table 88: ASEAN edible packaging Volume (K) Forecast, by Application 2020 & 2033
- Table 89: Oceania edible packaging Revenue (billion) Forecast, by Application 2020 & 2033
- Table 90: Oceania edible packaging Volume (K) Forecast, by Application 2020 & 2033
- Table 91: Rest of Asia Pacific edible packaging Revenue (billion) Forecast, by Application 2020 & 2033
- Table 92: Rest of Asia Pacific edible packaging Volume (K) Forecast, by Application 2020 & 2033
Frequently Asked Questions
1. What is the projected Compound Annual Growth Rate (CAGR) of the edible packaging?
The projected CAGR is approximately 14.2%.
2. Which companies are prominent players in the edible packaging?
Key companies in the market include Kuraray, JRF Technology, WikiCell Designs, Tate and Lyle, BioFilm, Devro, Watson Inc.
3. What are the main segments of the edible packaging?
The market segments include Application, Types.
4. Can you provide details about the market size?
The market size is estimated to be USD 2.08 billion as of 2022.
5. What are some drivers contributing to market growth?
N/A
6. What are the notable trends driving market growth?
N/A
7. Are there any restraints impacting market growth?
N/A
8. Can you provide examples of recent developments in the market?
N/A
9. What pricing options are available for accessing the report?
Pricing options include single-user, multi-user, and enterprise licenses priced at USD 4350.00, USD 6525.00, and USD 8700.00 respectively.
10. Is the market size provided in terms of value or volume?
The market size is provided in terms of value, measured in billion and volume, measured in K.
11. Are there any specific market keywords associated with the report?
Yes, the market keyword associated with the report is "edible packaging," which aids in identifying and referencing the specific market segment covered.
12. How do I determine which pricing option suits my needs best?
The pricing options vary based on user requirements and access needs. Individual users may opt for single-user licenses, while businesses requiring broader access may choose multi-user or enterprise licenses for cost-effective access to the report.
13. Are there any additional resources or data provided in the edible packaging report?
While the report offers comprehensive insights, it's advisable to review the specific contents or supplementary materials provided to ascertain if additional resources or data are available.
14. How can I stay updated on further developments or reports in the edible packaging?
To stay informed about further developments, trends, and reports in the edible packaging, consider subscribing to industry newsletters, following relevant companies and organizations, or regularly checking reputable industry news sources and publications.
Methodology
Step 1 - Identification of Relevant Samples Size from Population Database


Step 2 - Approaches for Defining Global Market Size (Value, Volume* & Price*)

Note*: In applicable scenarios
Step 3 - Data Sources
Primary Research
- Web Analytics
- Survey Reports
- Research Institute
- Latest Research Reports
- Opinion Leaders
Secondary Research
- Annual Reports
- White Paper
- Latest Press Release
- Industry Association
- Paid Database
- Investor Presentations

Step 4 - Data Triangulation
Involves using different sources of information in order to increase the validity of a study
These sources are likely to be stakeholders in a program - participants, other researchers, program staff, other community members, and so on.
Then we put all data in single framework & apply various statistical tools to find out the dynamic on the market.
During the analysis stage, feedback from the stakeholder groups would be compared to determine areas of agreement as well as areas of divergence