

Key Insights
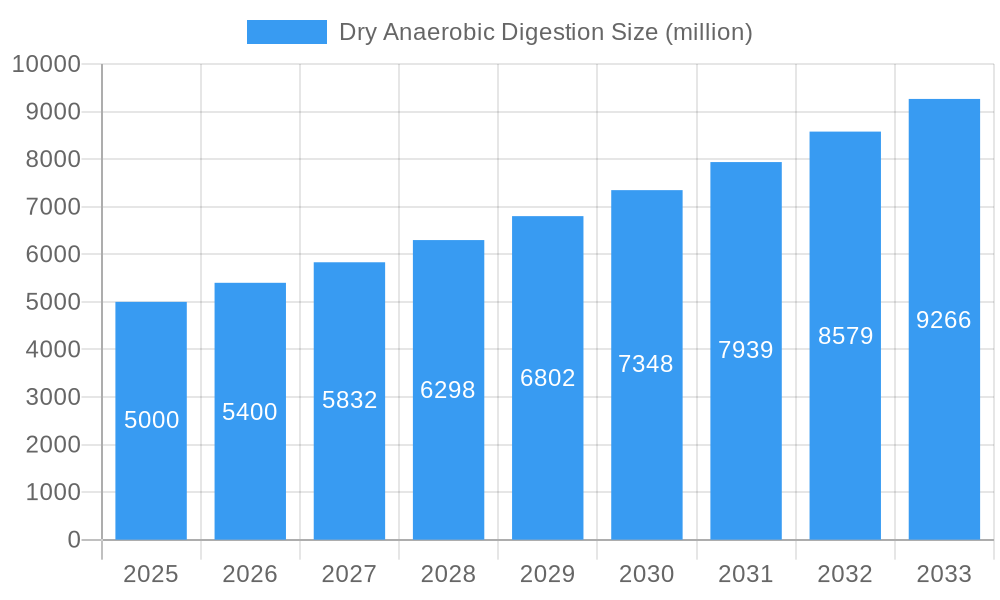
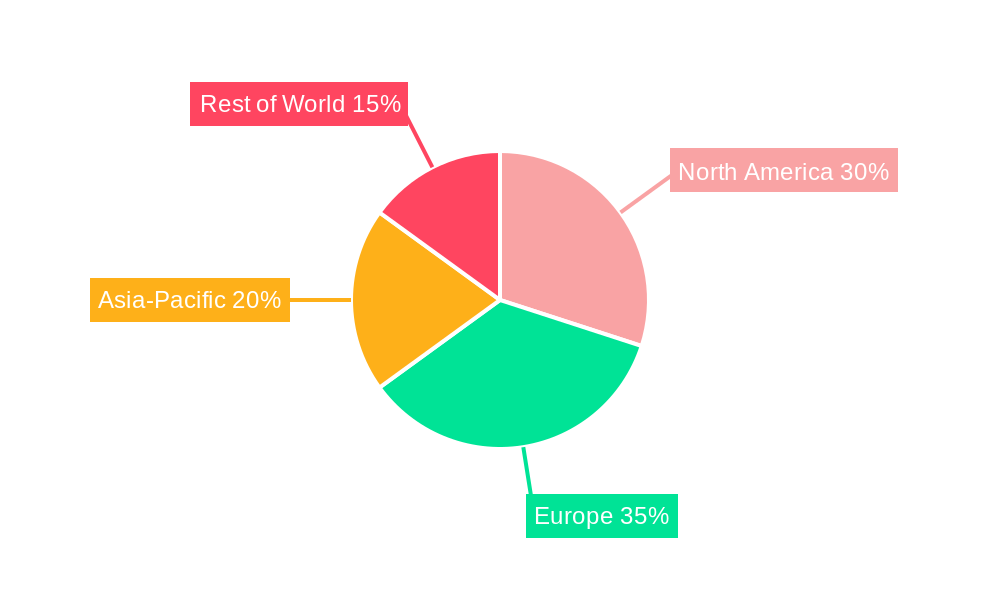
The dry anaerobic digestion (DAD) market is experiencing robust growth, driven by increasing environmental concerns and stringent regulations regarding waste management. The global market, while exhibiting a substantial size (estimated at $5 billion in 2025), is projected to grow at a Compound Annual Growth Rate (CAGR) of approximately 8% from 2025 to 2033. This growth is fueled by several key drivers: the escalating need for sustainable waste processing solutions, particularly for organic waste streams; the rising demand for renewable energy sources like biogas; and the increasing adoption of DAD technology in various sectors, including agriculture, food processing, and municipal waste management. The technology's advantages over traditional wet anaerobic digestion, such as reduced water usage and simpler infrastructure requirements, are further bolstering its adoption. However, the high initial investment costs associated with setting up DAD plants and the need for specialized expertise in system operation represent significant restraints to market expansion. Market segmentation reveals strong demand across diverse geographical regions, with Europe and North America currently leading in adoption, though developing economies in Asia-Pacific are showing significant potential for growth in the coming years. Key players like PlanET Biogas Global GmbH, EnviTec Biogas AG, and WELTEC BIOPOWER GmbH are actively shaping the market through technological advancements and strategic partnerships.
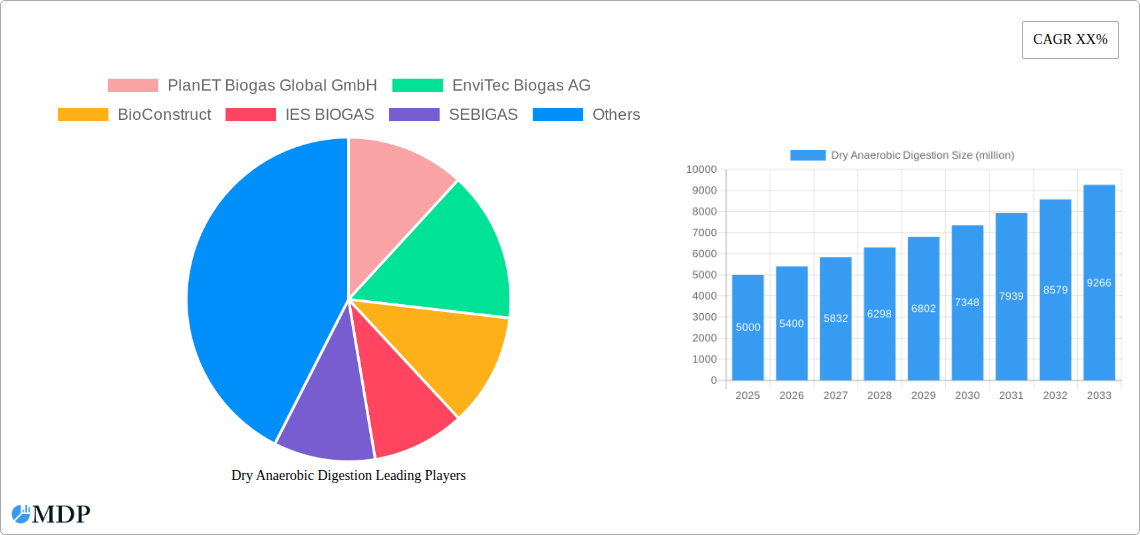
Dry Anaerobic Digestion Market Size (In Billion)
The future trajectory of the DAD market points toward increasing sophistication and optimization of technology. We anticipate significant advancements in digester design, process automation, and biogas upgrading, leading to enhanced efficiency and reduced operational costs. The integration of smart technologies and data analytics for real-time monitoring and process optimization will also play a vital role. Furthermore, the development of sustainable feedstock sourcing strategies and innovative approaches for biogas utilization (e.g., biomethane injection into natural gas grids) will be crucial in driving market expansion. Governmental incentives and supportive policies promoting renewable energy and sustainable waste management will continue to be catalysts for market growth. The competitive landscape is expected to remain dynamic, with ongoing innovation and consolidation amongst key players shaping the market's future trajectory.
Dry Anaerobic Digestion Company Market Share
Unlock the Potential of Dry Anaerobic Digestion: A Comprehensive Market Report (2019-2033)
This comprehensive report provides an in-depth analysis of the Dry Anaerobic Digestion market, offering invaluable insights for industry stakeholders, investors, and strategic decision-makers. With a detailed study period spanning 2019-2033, including a base year of 2025 and a forecast period of 2025-2033, this report unveils the market's dynamics, trends, and future potential. The report analyzes the market size exceeding $xx million in 2025, projected to reach $xx million by 2033, exhibiting a CAGR of xx%.
Dry Anaerobic Digestion Market Dynamics & Concentration
The global Dry Anaerobic Digestion market is characterized by a moderately concentrated landscape, with key players vying for market share. The market exhibits a dynamic interplay of innovation, regulation, and evolving end-user preferences. Significant M&A activity in the historical period (2019-2024) has shaped the competitive landscape, resulting in approximately xx M&A deals. Market leaders, such as PlanET Biogas Global GmbH and EnviTec Biogas AG, hold significant shares, estimated at xx% and xx%, respectively, in 2025. However, smaller players are actively contributing to innovation, driven by the increasing demand for sustainable waste management solutions. Stringent environmental regulations are driving market growth, while the availability of substitute technologies presents a challenge. End-user trends indicate a growing preference for efficient and cost-effective dry anaerobic digestion systems, particularly in the agricultural and municipal waste sectors.
- Market Concentration: Moderately concentrated, with top 5 players holding approximately xx% market share in 2025.
- Innovation Drivers: Stringent environmental regulations, increasing waste generation, and advancements in digester technology.
- Regulatory Frameworks: Vary across regions, impacting adoption rates and investment decisions.
- Product Substitutes: Incineration, composting, and landfilling present alternative waste management solutions.
- End-User Trends: Shifting preference towards efficient and cost-effective systems, particularly in the agricultural and municipal waste sectors.
- M&A Activity: Approximately xx M&A deals recorded during 2019-2024.
Dry Anaerobic Digestion Industry Trends & Analysis
The Dry Anaerobic Digestion market is experiencing robust growth, driven by several key factors. Technological advancements are improving efficiency, reducing operational costs, and expanding applications. Consumer preferences are increasingly favoring sustainable waste management solutions, aligning with global environmental goals. The market's competitive dynamics are characterized by continuous innovation, strategic partnerships, and expansion into new geographical markets. The CAGR for the forecast period (2025-2033) is estimated at xx%, reflecting strong market penetration in key regions. The increasing adoption of dry anaerobic digestion technologies across various sectors, including agriculture, municipal waste management, and industrial applications, fuels this growth. Furthermore, government incentives and supportive policies are also contributing to the market's expansion.
Leading Markets & Segments in Dry Anaerobic Digestion
The European region currently dominates the Dry Anaerobic Digestion market, primarily driven by stringent environmental regulations and supportive government policies promoting renewable energy generation. Germany, with its established biogas industry and strong policy support, is a key market within Europe. The agricultural sector stands out as the largest segment, owing to the significant availability of organic waste streams from livestock farming and crop production.
- Key Drivers in Europe:
- Stringent environmental regulations aimed at reducing greenhouse gas emissions and promoting renewable energy.
- Government subsidies and incentives for biogas production.
- Well-established biogas industry infrastructure.
- Key Drivers in the Agricultural Segment:
- Abundance of readily available organic waste streams from livestock and crop production.
- Economic benefits from biogas production and digestate utilization.
- Reduced reliance on fossil fuels.
Dry Anaerobic Digestion Product Developments
Recent product innovations focus on enhancing digester efficiency, reducing operational costs, and broadening the range of acceptable feedstocks. Advances in process control technologies, coupled with improvements in digester design, have led to increased biogas yields and reduced energy consumption. New applications are emerging, extending beyond traditional agricultural waste streams to include industrial by-products and municipal solid waste. These developments are enhancing the competitive advantage of Dry Anaerobic Digestion technologies in the broader waste management sector.
Key Drivers of Dry Anaerobic Digestion Growth
Several factors are propelling the growth of the Dry Anaerobic Digestion market. Technological advancements in digester design and process control are increasing efficiency and reducing operational costs. Favorable government policies and subsidies are incentivizing adoption, while the growing awareness of environmental sustainability is driving market demand. Furthermore, the increasing availability of suitable feedstocks and the potential for valuable byproduct utilization are significant growth catalysts.
Challenges in the Dry Anaerobic Digestion Market
Despite significant growth potential, the Dry Anaerobic Digestion market faces several challenges. High initial investment costs, coupled with potential operational complexities, can deter adoption, especially by smaller-scale operators. Fluctuating feedstock prices and logistical challenges can impact profitability. Competition from alternative waste management technologies also presents a considerable challenge, requiring continuous innovation and cost optimization to maintain a competitive edge. The market faces challenges from inconsistent regulatory frameworks across different regions which increases the complexity of expansion and investment decisions.
Emerging Opportunities in Dry Anaerobic Digestion
Significant opportunities exist for expanding the Dry Anaerobic Digestion market. Technological breakthroughs in enhancing digester performance and feedstock flexibility will open new avenues for growth. Strategic partnerships between technology providers, waste management companies, and energy producers can accelerate market penetration. Expansion into new geographical markets with supportive regulatory environments and ample feedstock availability holds significant potential for long-term growth.
Leading Players in the Dry Anaerobic Digestion Sector
- PlanET Biogas Global GmbH
- EnviTec Biogas AG
- BioConstruct
- IES BIOGAS
- SEBIGAS
- BEKON
- Organic Waste Systems (OWS)
- WELTEC BIOPOWER GmbH
- Xergi A/S
- BTS Biogas
- HoSt
- IG Biogas
- Zorg Biogas AG
- BTA International GmbH
- Lundsby Biogas A / S
- Finn Biogas
- Ludan Group
- Naskeo
- Agraferm GmbH
- Mitsui E&S Engineering Co., Ltd
- Hitachi Zosen Inova
- Strabag
- Thöni
Key Milestones in Dry Anaerobic Digestion Industry
- 2020: Launch of a new high-efficiency dry anaerobic digester by WELTEC BIOPOWER GmbH.
- 2021: EnviTec Biogas AG announces a major expansion project in Germany.
- 2022: PlanET Biogas Global GmbH and another major player announced a strategic partnership to develop advanced digester technologies.
- 2023: Significant policy changes in multiple European countries further incentivizing biogas production.
- 2024: Several mergers and acquisitions consolidated market share among leading players.
Strategic Outlook for Dry Anaerobic Digestion Market
The Dry Anaerobic Digestion market is poised for significant growth, driven by increasing environmental concerns, technological advancements, and supportive government policies. Strategic opportunities lie in developing innovative technologies, expanding into new markets, and fostering strategic partnerships to capture market share. The focus on optimizing digester performance, expanding feedstock flexibility, and integrating biogas production into broader energy systems will be key to success in this dynamic market.
Dry Anaerobic Digestion Segmentation
-
1. Application
- 1.1. Energy Crops
- 1.2. Bio Municipal Waste
- 1.3. Others
-
2. Types
- 2.1. Vertical Type
- 2.2. Horizontal Type
Dry Anaerobic Digestion Segmentation By Geography
-
1. North America
- 1.1. United States
- 1.2. Canada
- 1.3. Mexico
-
2. South America
- 2.1. Brazil
- 2.2. Argentina
- 2.3. Rest of South America
-
3. Europe
- 3.1. United Kingdom
- 3.2. Germany
- 3.3. France
- 3.4. Italy
- 3.5. Spain
- 3.6. Russia
- 3.7. Benelux
- 3.8. Nordics
- 3.9. Rest of Europe
-
4. Middle East & Africa
- 4.1. Turkey
- 4.2. Israel
- 4.3. GCC
- 4.4. North Africa
- 4.5. South Africa
- 4.6. Rest of Middle East & Africa
-
5. Asia Pacific
- 5.1. China
- 5.2. India
- 5.3. Japan
- 5.4. South Korea
- 5.5. ASEAN
- 5.6. Oceania
- 5.7. Rest of Asia Pacific
Dry Anaerobic Digestion Regional Market Share
Geographic Coverage of Dry Anaerobic Digestion
Dry Anaerobic Digestion REPORT HIGHLIGHTS
| Aspects | Details |
|---|---|
| Study Period | 2020-2034 |
| Base Year | 2025 |
| Estimated Year | 2026 |
| Forecast Period | 2026-2034 |
| Historical Period | 2020-2025 |
| Growth Rate | CAGR of 10.3% from 2020-2034 |
| Segmentation |
|
Table of Contents
- 1. Introduction
- 1.1. Research Scope
- 1.2. Market Segmentation
- 1.3. Research Objective
- 1.4. Definitions and Assumptions
- 2. Executive Summary
- 2.1. Market Snapshot
- 3. Market Dynamics
- 3.1. Market Drivers
- 3.2. Market Restrains
- 3.3. Market Trends
- 3.4. Market Opportunities
- 4. Market Factor Analysis
- 4.1. Porters Five Forces
- 4.1.1. Bargaining Power of Suppliers
- 4.1.2. Bargaining Power of Buyers
- 4.1.3. Threat of New Entrants
- 4.1.4. Threat of Substitutes
- 4.1.5. Competitive Rivalry
- 4.2. PESTEL analysis
- 4.3. BCG Analysis
- 4.3.1. Stars (High Growth, High Market Share)
- 4.3.2. Cash Cows (Low Growth, High Market Share)
- 4.3.3. Question Mark (High Growth, Low Market Share)
- 4.3.4. Dogs (Low Growth, Low Market Share)
- 4.4. Ansoff Matrix Analysis
- 4.5. Supply Chain Analysis
- 4.6. Regulatory Landscape
- 4.7. Current Market Potential and Opportunity Assessment (TAM–SAM–SOM Framework)
- 4.8. MDP Analyst Note
- 4.1. Porters Five Forces
- 5. Market Analysis, Insights and Forecast 2021-2033
- 5.1. Market Analysis, Insights and Forecast - by Application
- 5.1.1. Energy Crops
- 5.1.2. Bio Municipal Waste
- 5.1.3. Others
- 5.2. Market Analysis, Insights and Forecast - by Types
- 5.2.1. Vertical Type
- 5.2.2. Horizontal Type
- 5.3. Market Analysis, Insights and Forecast - by Region
- 5.3.1. North America
- 5.3.2. South America
- 5.3.3. Europe
- 5.3.4. Middle East & Africa
- 5.3.5. Asia Pacific
- 5.1. Market Analysis, Insights and Forecast - by Application
- 6. Global Dry Anaerobic Digestion Analysis, Insights and Forecast, 2021-2033
- 6.1. Market Analysis, Insights and Forecast - by Application
- 6.1.1. Energy Crops
- 6.1.2. Bio Municipal Waste
- 6.1.3. Others
- 6.2. Market Analysis, Insights and Forecast - by Types
- 6.2.1. Vertical Type
- 6.2.2. Horizontal Type
- 6.1. Market Analysis, Insights and Forecast - by Application
- 7. North America Dry Anaerobic Digestion Analysis, Insights and Forecast, 2020-2032
- 7.1. Market Analysis, Insights and Forecast - by Application
- 7.1.1. Energy Crops
- 7.1.2. Bio Municipal Waste
- 7.1.3. Others
- 7.2. Market Analysis, Insights and Forecast - by Types
- 7.2.1. Vertical Type
- 7.2.2. Horizontal Type
- 7.1. Market Analysis, Insights and Forecast - by Application
- 8. South America Dry Anaerobic Digestion Analysis, Insights and Forecast, 2020-2032
- 8.1. Market Analysis, Insights and Forecast - by Application
- 8.1.1. Energy Crops
- 8.1.2. Bio Municipal Waste
- 8.1.3. Others
- 8.2. Market Analysis, Insights and Forecast - by Types
- 8.2.1. Vertical Type
- 8.2.2. Horizontal Type
- 8.1. Market Analysis, Insights and Forecast - by Application
- 9. Europe Dry Anaerobic Digestion Analysis, Insights and Forecast, 2020-2032
- 9.1. Market Analysis, Insights and Forecast - by Application
- 9.1.1. Energy Crops
- 9.1.2. Bio Municipal Waste
- 9.1.3. Others
- 9.2. Market Analysis, Insights and Forecast - by Types
- 9.2.1. Vertical Type
- 9.2.2. Horizontal Type
- 9.1. Market Analysis, Insights and Forecast - by Application
- 10. Middle East & Africa Dry Anaerobic Digestion Analysis, Insights and Forecast, 2020-2032
- 10.1. Market Analysis, Insights and Forecast - by Application
- 10.1.1. Energy Crops
- 10.1.2. Bio Municipal Waste
- 10.1.3. Others
- 10.2. Market Analysis, Insights and Forecast - by Types
- 10.2.1. Vertical Type
- 10.2.2. Horizontal Type
- 10.1. Market Analysis, Insights and Forecast - by Application
- 11. Asia Pacific Dry Anaerobic Digestion Analysis, Insights and Forecast, 2020-2032
- 11.1. Market Analysis, Insights and Forecast - by Application
- 11.1.1. Energy Crops
- 11.1.2. Bio Municipal Waste
- 11.1.3. Others
- 11.2. Market Analysis, Insights and Forecast - by Types
- 11.2.1. Vertical Type
- 11.2.2. Horizontal Type
- 11.1. Market Analysis, Insights and Forecast - by Application
- 12. Competitive Analysis
- 12.1. Company Profiles
- 12.1.1 PlanET Biogas Global GmbH
- 12.1.1.1. Company Overview
- 12.1.1.2. Products
- 12.1.1.3. Company Financials
- 12.1.1.4. SWOT Analysis
- 12.1.2 EnviTec Biogas AG
- 12.1.2.1. Company Overview
- 12.1.2.2. Products
- 12.1.2.3. Company Financials
- 12.1.2.4. SWOT Analysis
- 12.1.3 BioConstruct
- 12.1.3.1. Company Overview
- 12.1.3.2. Products
- 12.1.3.3. Company Financials
- 12.1.3.4. SWOT Analysis
- 12.1.4 IES BIOGAS
- 12.1.4.1. Company Overview
- 12.1.4.2. Products
- 12.1.4.3. Company Financials
- 12.1.4.4. SWOT Analysis
- 12.1.5 SEBIGAS
- 12.1.5.1. Company Overview
- 12.1.5.2. Products
- 12.1.5.3. Company Financials
- 12.1.5.4. SWOT Analysis
- 12.1.6 BEKON
- 12.1.6.1. Company Overview
- 12.1.6.2. Products
- 12.1.6.3. Company Financials
- 12.1.6.4. SWOT Analysis
- 12.1.7 Organic Waste Systems (OWS)
- 12.1.7.1. Company Overview
- 12.1.7.2. Products
- 12.1.7.3. Company Financials
- 12.1.7.4. SWOT Analysis
- 12.1.8 WELTEC BIOPOWER GmbH
- 12.1.8.1. Company Overview
- 12.1.8.2. Products
- 12.1.8.3. Company Financials
- 12.1.8.4. SWOT Analysis
- 12.1.9 Xergi A/S
- 12.1.9.1. Company Overview
- 12.1.9.2. Products
- 12.1.9.3. Company Financials
- 12.1.9.4. SWOT Analysis
- 12.1.10 BTS Biogas
- 12.1.10.1. Company Overview
- 12.1.10.2. Products
- 12.1.10.3. Company Financials
- 12.1.10.4. SWOT Analysis
- 12.1.11 HoSt
- 12.1.11.1. Company Overview
- 12.1.11.2. Products
- 12.1.11.3. Company Financials
- 12.1.11.4. SWOT Analysis
- 12.1.12 IG Biogas
- 12.1.12.1. Company Overview
- 12.1.12.2. Products
- 12.1.12.3. Company Financials
- 12.1.12.4. SWOT Analysis
- 12.1.13 Zorg Biogas AG
- 12.1.13.1. Company Overview
- 12.1.13.2. Products
- 12.1.13.3. Company Financials
- 12.1.13.4. SWOT Analysis
- 12.1.14 BTA International GmbH
- 12.1.14.1. Company Overview
- 12.1.14.2. Products
- 12.1.14.3. Company Financials
- 12.1.14.4. SWOT Analysis
- 12.1.15 Lundsby Biogas A / S
- 12.1.15.1. Company Overview
- 12.1.15.2. Products
- 12.1.15.3. Company Financials
- 12.1.15.4. SWOT Analysis
- 12.1.16 Finn Biogas
- 12.1.16.1. Company Overview
- 12.1.16.2. Products
- 12.1.16.3. Company Financials
- 12.1.16.4. SWOT Analysis
- 12.1.17 Ludan Group
- 12.1.17.1. Company Overview
- 12.1.17.2. Products
- 12.1.17.3. Company Financials
- 12.1.17.4. SWOT Analysis
- 12.1.18 Naskeo
- 12.1.18.1. Company Overview
- 12.1.18.2. Products
- 12.1.18.3. Company Financials
- 12.1.18.4. SWOT Analysis
- 12.1.19 Agraferm GmbH
- 12.1.19.1. Company Overview
- 12.1.19.2. Products
- 12.1.19.3. Company Financials
- 12.1.19.4. SWOT Analysis
- 12.1.20 Mitsui E&S Engineering Co.
- 12.1.20.1. Company Overview
- 12.1.20.2. Products
- 12.1.20.3. Company Financials
- 12.1.20.4. SWOT Analysis
- 12.1.21 Ltd
- 12.1.21.1. Company Overview
- 12.1.21.2. Products
- 12.1.21.3. Company Financials
- 12.1.21.4. SWOT Analysis
- 12.1.22 Hitachi Zosen Inova
- 12.1.22.1. Company Overview
- 12.1.22.2. Products
- 12.1.22.3. Company Financials
- 12.1.22.4. SWOT Analysis
- 12.1.23 Strabag
- 12.1.23.1. Company Overview
- 12.1.23.2. Products
- 12.1.23.3. Company Financials
- 12.1.23.4. SWOT Analysis
- 12.1.24 Thöni
- 12.1.24.1. Company Overview
- 12.1.24.2. Products
- 12.1.24.3. Company Financials
- 12.1.24.4. SWOT Analysis
- 12.1.1 PlanET Biogas Global GmbH
- 12.2. Market Entropy
- 12.2.1 Company's Key Areas Served
- 12.2.2 Recent Developments
- 12.3. Company Market Share Analysis 2025
- 12.3.1 Top 5 Companies Market Share Analysis
- 12.3.2 Top 3 Companies Market Share Analysis
- 12.4. List of Potential Customers
- 13. Research Methodology
List of Figures
- Figure 1: Global Dry Anaerobic Digestion Revenue Breakdown (billion, %) by Region 2025 & 2033
- Figure 2: North America Dry Anaerobic Digestion Revenue (billion), by Application 2025 & 2033
- Figure 3: North America Dry Anaerobic Digestion Revenue Share (%), by Application 2025 & 2033
- Figure 4: North America Dry Anaerobic Digestion Revenue (billion), by Types 2025 & 2033
- Figure 5: North America Dry Anaerobic Digestion Revenue Share (%), by Types 2025 & 2033
- Figure 6: North America Dry Anaerobic Digestion Revenue (billion), by Country 2025 & 2033
- Figure 7: North America Dry Anaerobic Digestion Revenue Share (%), by Country 2025 & 2033
- Figure 8: South America Dry Anaerobic Digestion Revenue (billion), by Application 2025 & 2033
- Figure 9: South America Dry Anaerobic Digestion Revenue Share (%), by Application 2025 & 2033
- Figure 10: South America Dry Anaerobic Digestion Revenue (billion), by Types 2025 & 2033
- Figure 11: South America Dry Anaerobic Digestion Revenue Share (%), by Types 2025 & 2033
- Figure 12: South America Dry Anaerobic Digestion Revenue (billion), by Country 2025 & 2033
- Figure 13: South America Dry Anaerobic Digestion Revenue Share (%), by Country 2025 & 2033
- Figure 14: Europe Dry Anaerobic Digestion Revenue (billion), by Application 2025 & 2033
- Figure 15: Europe Dry Anaerobic Digestion Revenue Share (%), by Application 2025 & 2033
- Figure 16: Europe Dry Anaerobic Digestion Revenue (billion), by Types 2025 & 2033
- Figure 17: Europe Dry Anaerobic Digestion Revenue Share (%), by Types 2025 & 2033
- Figure 18: Europe Dry Anaerobic Digestion Revenue (billion), by Country 2025 & 2033
- Figure 19: Europe Dry Anaerobic Digestion Revenue Share (%), by Country 2025 & 2033
- Figure 20: Middle East & Africa Dry Anaerobic Digestion Revenue (billion), by Application 2025 & 2033
- Figure 21: Middle East & Africa Dry Anaerobic Digestion Revenue Share (%), by Application 2025 & 2033
- Figure 22: Middle East & Africa Dry Anaerobic Digestion Revenue (billion), by Types 2025 & 2033
- Figure 23: Middle East & Africa Dry Anaerobic Digestion Revenue Share (%), by Types 2025 & 2033
- Figure 24: Middle East & Africa Dry Anaerobic Digestion Revenue (billion), by Country 2025 & 2033
- Figure 25: Middle East & Africa Dry Anaerobic Digestion Revenue Share (%), by Country 2025 & 2033
- Figure 26: Asia Pacific Dry Anaerobic Digestion Revenue (billion), by Application 2025 & 2033
- Figure 27: Asia Pacific Dry Anaerobic Digestion Revenue Share (%), by Application 2025 & 2033
- Figure 28: Asia Pacific Dry Anaerobic Digestion Revenue (billion), by Types 2025 & 2033
- Figure 29: Asia Pacific Dry Anaerobic Digestion Revenue Share (%), by Types 2025 & 2033
- Figure 30: Asia Pacific Dry Anaerobic Digestion Revenue (billion), by Country 2025 & 2033
- Figure 31: Asia Pacific Dry Anaerobic Digestion Revenue Share (%), by Country 2025 & 2033
List of Tables
- Table 1: Global Dry Anaerobic Digestion Revenue billion Forecast, by Application 2020 & 2033
- Table 2: Global Dry Anaerobic Digestion Revenue billion Forecast, by Types 2020 & 2033
- Table 3: Global Dry Anaerobic Digestion Revenue billion Forecast, by Region 2020 & 2033
- Table 4: Global Dry Anaerobic Digestion Revenue billion Forecast, by Application 2020 & 2033
- Table 5: Global Dry Anaerobic Digestion Revenue billion Forecast, by Types 2020 & 2033
- Table 6: Global Dry Anaerobic Digestion Revenue billion Forecast, by Country 2020 & 2033
- Table 7: United States Dry Anaerobic Digestion Revenue (billion) Forecast, by Application 2020 & 2033
- Table 8: Canada Dry Anaerobic Digestion Revenue (billion) Forecast, by Application 2020 & 2033
- Table 9: Mexico Dry Anaerobic Digestion Revenue (billion) Forecast, by Application 2020 & 2033
- Table 10: Global Dry Anaerobic Digestion Revenue billion Forecast, by Application 2020 & 2033
- Table 11: Global Dry Anaerobic Digestion Revenue billion Forecast, by Types 2020 & 2033
- Table 12: Global Dry Anaerobic Digestion Revenue billion Forecast, by Country 2020 & 2033
- Table 13: Brazil Dry Anaerobic Digestion Revenue (billion) Forecast, by Application 2020 & 2033
- Table 14: Argentina Dry Anaerobic Digestion Revenue (billion) Forecast, by Application 2020 & 2033
- Table 15: Rest of South America Dry Anaerobic Digestion Revenue (billion) Forecast, by Application 2020 & 2033
- Table 16: Global Dry Anaerobic Digestion Revenue billion Forecast, by Application 2020 & 2033
- Table 17: Global Dry Anaerobic Digestion Revenue billion Forecast, by Types 2020 & 2033
- Table 18: Global Dry Anaerobic Digestion Revenue billion Forecast, by Country 2020 & 2033
- Table 19: United Kingdom Dry Anaerobic Digestion Revenue (billion) Forecast, by Application 2020 & 2033
- Table 20: Germany Dry Anaerobic Digestion Revenue (billion) Forecast, by Application 2020 & 2033
- Table 21: France Dry Anaerobic Digestion Revenue (billion) Forecast, by Application 2020 & 2033
- Table 22: Italy Dry Anaerobic Digestion Revenue (billion) Forecast, by Application 2020 & 2033
- Table 23: Spain Dry Anaerobic Digestion Revenue (billion) Forecast, by Application 2020 & 2033
- Table 24: Russia Dry Anaerobic Digestion Revenue (billion) Forecast, by Application 2020 & 2033
- Table 25: Benelux Dry Anaerobic Digestion Revenue (billion) Forecast, by Application 2020 & 2033
- Table 26: Nordics Dry Anaerobic Digestion Revenue (billion) Forecast, by Application 2020 & 2033
- Table 27: Rest of Europe Dry Anaerobic Digestion Revenue (billion) Forecast, by Application 2020 & 2033
- Table 28: Global Dry Anaerobic Digestion Revenue billion Forecast, by Application 2020 & 2033
- Table 29: Global Dry Anaerobic Digestion Revenue billion Forecast, by Types 2020 & 2033
- Table 30: Global Dry Anaerobic Digestion Revenue billion Forecast, by Country 2020 & 2033
- Table 31: Turkey Dry Anaerobic Digestion Revenue (billion) Forecast, by Application 2020 & 2033
- Table 32: Israel Dry Anaerobic Digestion Revenue (billion) Forecast, by Application 2020 & 2033
- Table 33: GCC Dry Anaerobic Digestion Revenue (billion) Forecast, by Application 2020 & 2033
- Table 34: North Africa Dry Anaerobic Digestion Revenue (billion) Forecast, by Application 2020 & 2033
- Table 35: South Africa Dry Anaerobic Digestion Revenue (billion) Forecast, by Application 2020 & 2033
- Table 36: Rest of Middle East & Africa Dry Anaerobic Digestion Revenue (billion) Forecast, by Application 2020 & 2033
- Table 37: Global Dry Anaerobic Digestion Revenue billion Forecast, by Application 2020 & 2033
- Table 38: Global Dry Anaerobic Digestion Revenue billion Forecast, by Types 2020 & 2033
- Table 39: Global Dry Anaerobic Digestion Revenue billion Forecast, by Country 2020 & 2033
- Table 40: China Dry Anaerobic Digestion Revenue (billion) Forecast, by Application 2020 & 2033
- Table 41: India Dry Anaerobic Digestion Revenue (billion) Forecast, by Application 2020 & 2033
- Table 42: Japan Dry Anaerobic Digestion Revenue (billion) Forecast, by Application 2020 & 2033
- Table 43: South Korea Dry Anaerobic Digestion Revenue (billion) Forecast, by Application 2020 & 2033
- Table 44: ASEAN Dry Anaerobic Digestion Revenue (billion) Forecast, by Application 2020 & 2033
- Table 45: Oceania Dry Anaerobic Digestion Revenue (billion) Forecast, by Application 2020 & 2033
- Table 46: Rest of Asia Pacific Dry Anaerobic Digestion Revenue (billion) Forecast, by Application 2020 & 2033
Frequently Asked Questions
1. What is the projected Compound Annual Growth Rate (CAGR) of the Dry Anaerobic Digestion?
The projected CAGR is approximately 10.3%.
2. Which companies are prominent players in the Dry Anaerobic Digestion?
Key companies in the market include PlanET Biogas Global GmbH, EnviTec Biogas AG, BioConstruct, IES BIOGAS, SEBIGAS, BEKON, Organic Waste Systems (OWS), WELTEC BIOPOWER GmbH, Xergi A/S, BTS Biogas, HoSt, IG Biogas, Zorg Biogas AG, BTA International GmbH, Lundsby Biogas A / S, Finn Biogas, Ludan Group, Naskeo, Agraferm GmbH, Mitsui E&S Engineering Co., Ltd, Hitachi Zosen Inova, Strabag, Thöni.
3. What are the main segments of the Dry Anaerobic Digestion?
The market segments include Application, Types.
4. Can you provide details about the market size?
The market size is estimated to be USD 18.07 billion as of 2022.
5. What are some drivers contributing to market growth?
N/A
6. What are the notable trends driving market growth?
N/A
7. Are there any restraints impacting market growth?
N/A
8. Can you provide examples of recent developments in the market?
N/A
9. What pricing options are available for accessing the report?
Pricing options include single-user, multi-user, and enterprise licenses priced at USD 4900.00, USD 7350.00, and USD 9800.00 respectively.
10. Is the market size provided in terms of value or volume?
The market size is provided in terms of value, measured in billion.
11. Are there any specific market keywords associated with the report?
Yes, the market keyword associated with the report is "Dry Anaerobic Digestion," which aids in identifying and referencing the specific market segment covered.
12. How do I determine which pricing option suits my needs best?
The pricing options vary based on user requirements and access needs. Individual users may opt for single-user licenses, while businesses requiring broader access may choose multi-user or enterprise licenses for cost-effective access to the report.
13. Are there any additional resources or data provided in the Dry Anaerobic Digestion report?
While the report offers comprehensive insights, it's advisable to review the specific contents or supplementary materials provided to ascertain if additional resources or data are available.
14. How can I stay updated on further developments or reports in the Dry Anaerobic Digestion?
To stay informed about further developments, trends, and reports in the Dry Anaerobic Digestion, consider subscribing to industry newsletters, following relevant companies and organizations, or regularly checking reputable industry news sources and publications.
Methodology
Step 1 - Identification of Relevant Samples Size from Population Database


Step 2 - Approaches for Defining Global Market Size (Value, Volume* & Price*)

Note*: In applicable scenarios
Step 3 - Data Sources
Primary Research
- Web Analytics
- Survey Reports
- Research Institute
- Latest Research Reports
- Opinion Leaders
Secondary Research
- Annual Reports
- White Paper
- Latest Press Release
- Industry Association
- Paid Database
- Investor Presentations

Step 4 - Data Triangulation
Involves using different sources of information in order to increase the validity of a study
These sources are likely to be stakeholders in a program - participants, other researchers, program staff, other community members, and so on.
Then we put all data in single framework & apply various statistical tools to find out the dynamic on the market.
During the analysis stage, feedback from the stakeholder groups would be compared to determine areas of agreement as well as areas of divergence