

Key Insights
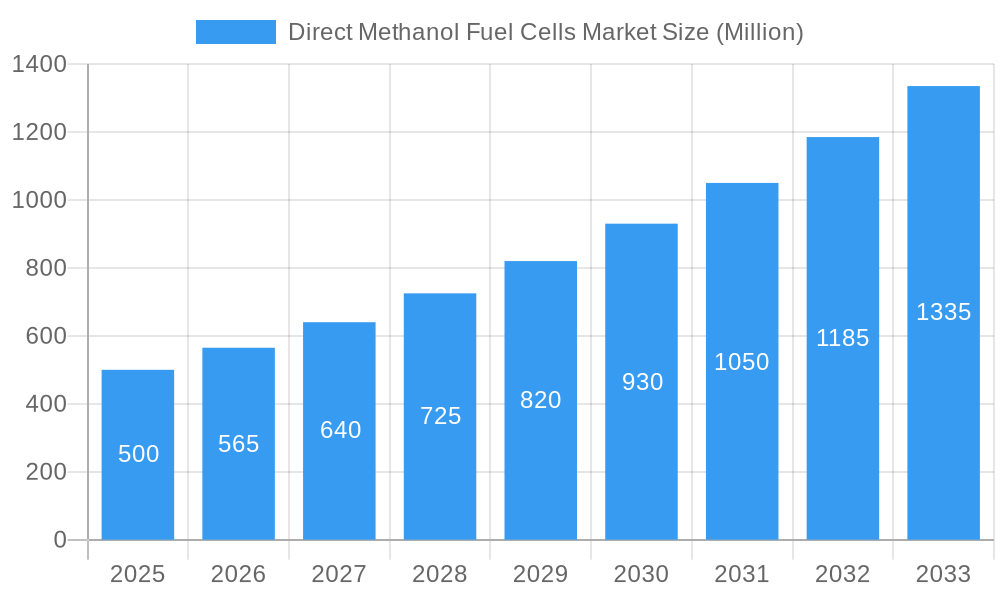
The Direct Methanol Fuel Cell (DMFC) market is poised for significant expansion, with a projected Compound Annual Growth Rate (CAGR) of 8.8%. This growth, estimated from 2025 to 2033, is propelled by the escalating demand for clean and efficient energy solutions across various sectors. Key drivers include the automotive and transportation industries, influenced by stringent emission mandates and the push for sustainable mobility. Portable DMFCs are gaining prominence in consumer electronics and mobile power due to their compact design and user-friendliness. Stationary DMFC applications, such as residential heating and backup power, are also substantial contributors. Ongoing technological innovations enhancing fuel efficiency, durability, and cost-effectiveness are accelerating market adoption. While challenges like methanol toxicity and catalyst improvements persist, research and development efforts are actively addressing these concerns. The market is segmented by product type (portable, stationary) and application (automotive, transportation, power generation, residential heating, backup power), offering diverse opportunities. North America and Asia-Pacific are anticipated to lead market growth, supported by robust government initiatives for renewable energy and increased investment in fuel cell technology.
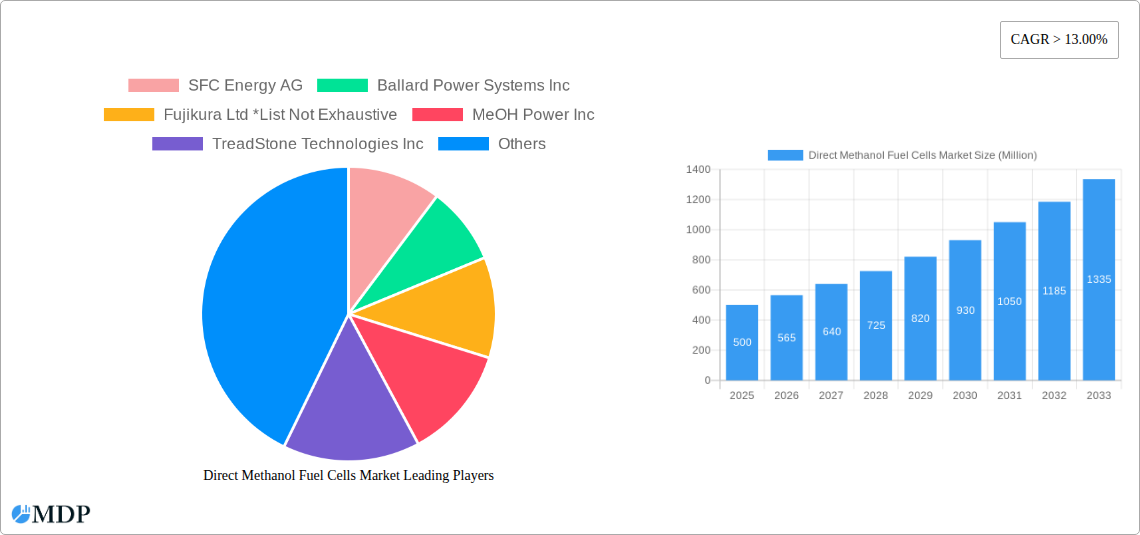
Direct Methanol Fuel Cells Market Market Size (In Billion)
The competitive environment features established industry leaders and dynamic emerging companies. Prominent players like SFC Energy AG, Ballard Power Systems Inc., and Johnson Matthey are capitalizing on their technological strengths. The market also welcomes innovative startups specializing in niche applications and DMFC advancements. Future market dynamics will be shaped by technological breakthroughs, favorable government policies, and heightened consumer awareness of environmental sustainability. Sustained investment in research and development is critical for overcoming existing hurdles and maximizing DMFC technology's potential across diverse applications. This will likely foster further market specialization and the emergence of niche players catering to specific applications and regions. The global DMFC market size is estimated at 3.9 billion in the base year of 2025.
Direct Methanol Fuel Cells Market Company Market Share
Direct Methanol Fuel Cells Market Report: 2019-2033 Forecast
This comprehensive report provides a detailed analysis of the Direct Methanol Fuel Cells (DMFC) market, offering invaluable insights for stakeholders seeking to navigate this dynamic sector. Covering the period 2019-2033, with a focus on 2025, this report unveils market dynamics, trends, leading players, and future growth opportunities. The report is meticulously researched and presents actionable data to aid strategic decision-making.
Direct Methanol Fuel Cells Market Dynamics & Concentration
The Direct Methanol Fuel Cells market exhibits a moderately concentrated landscape, with several key players vying for market share. Innovation, particularly in membrane electrode assembly (MEA) technology and catalyst development, is a crucial driver. Stringent environmental regulations, particularly in regions focused on reducing carbon emissions, are pushing adoption. While battery technology presents a substitute, DMFCs offer unique advantages in certain applications, such as portability and higher energy density. End-user preferences are shifting towards cleaner, more efficient power solutions, particularly in the portable and stationary power generation segments. The market has witnessed several M&A activities in recent years, with xx major deals recorded between 2019 and 2024. This consolidation is expected to continue as larger players seek to expand their market footprint and technology portfolios.
- Market Concentration: Moderately concentrated, with a top 5 market share of approximately xx%.
- Innovation Drivers: MEA technology advancements, catalyst improvements, and miniaturization.
- Regulatory Framework: Stringent emission norms driving market growth in specific regions.
- Product Substitutes: Battery technology, but DMFCs offer advantages in portability and energy density.
- End-User Trends: Increasing demand for portable power and cleaner energy solutions.
- M&A Activities: xx major mergers and acquisitions between 2019 and 2024.
Direct Methanol Fuel Cells Market Industry Trends & Analysis
The DMFC market is experiencing robust growth, driven by the increasing demand for portable power solutions and the need for cleaner energy alternatives. The market is projected to witness a CAGR of xx% during the forecast period (2025-2033), reaching a market value of xx Million by 2033. Technological advancements, such as improved catalyst efficiency and enhanced MEA durability, are significantly influencing market growth. Consumer preferences are shifting towards compact, reliable, and environmentally friendly power sources, fueling demand for DMFCs across diverse applications. Competitive dynamics are characterized by both established players and emerging startups vying for market share. Market penetration is highest in the portable fuel cell segment, particularly in consumer electronics and military applications, with a penetration rate of approximately xx% in 2025.
Leading Markets & Segments in Direct Methanol Fuel Cells Market
The Asia-Pacific region is expected to dominate the DMFC market during the forecast period, driven by rapid industrialization, increasing urbanization, and government initiatives promoting clean energy adoption. Within this region, China and Japan are key contributors due to favorable economic policies supporting renewable energy and robust infrastructure for technology adoption.
Product Type:
- Portable Fuel Cells: High market share due to increasing demand for portable electronics and consumer devices. Key drivers include growing disposable income, expanding consumer electronics market, and the need for compact power solutions.
- Stationary Fuel Cells: Growing adoption in backup power systems and residential heating applications. Key drivers include growing energy security concerns, increasing energy costs, and government incentives for distributed generation.
Application:
- Automotive Transportation: Limited market penetration currently but poised for growth with advancements in fuel cell technology.
- Power Generation: Significant growth potential, particularly in remote areas and backup power applications.
- Residential Heating: Emerging market with increasing interest in clean heating solutions.
- Backup Power Systems: Substantial growth due to increasing reliance on reliable power sources in critical infrastructure.
Direct Methanol Fuel Cells Market Product Developments
Recent advancements in DMFC technology focus on improving the efficiency and durability of MEAs, reducing methanol crossover, and enhancing the overall performance and lifespan of the fuel cells. These improvements have expanded the range of applications for DMFCs, from portable power solutions to stationary power generation and even niche transportation sectors. Companies are also focusing on reducing the cost of DMFC systems to make them more commercially competitive. This involves optimizing manufacturing processes and utilizing cost-effective materials.
Key Drivers of Direct Methanol Fuel Cells Market Growth
The growth of the DMFC market is propelled by several key factors:
- Technological advancements: Improvements in MEA technology, catalyst efficiency, and fuel cell design.
- Environmental regulations: Stringent emission standards driving the adoption of cleaner energy solutions.
- Economic factors: Rising energy costs and increasing demand for reliable power sources.
- Government incentives: Subsidies and tax benefits promoting the deployment of DMFC technology.
- Expanding applications: Growing demand in portable power, backup power, and distributed generation.
Challenges in the Direct Methanol Fuel Cells Market
The DMFC market faces several challenges hindering its widespread adoption:
- High cost of DMFC systems: Limiting their competitiveness compared to traditional power sources.
- Methanol storage and handling: Safety concerns and logistical challenges related to methanol transportation.
- Durability and performance issues: Limitations in the lifespan and operating temperature range of DMFCs.
- Limited infrastructure for methanol distribution: hindering widespread adoption in certain regions.
- Competition from other fuel cell technologies: including PEMFCs and SOFCs.
Emerging Opportunities in Direct Methanol Fuel Cells Market
Significant opportunities lie ahead for the DMFC market. Advancements in materials science are expected to further improve efficiency and reduce costs. Strategic partnerships between fuel cell manufacturers and energy companies will drive broader market penetration. Expanding the use of DMFCs in new applications, such as microgrids and mobile power solutions, represents a significant potential growth area. Government policies favoring cleaner energy technologies will continue to boost market adoption.
Leading Players in the Direct Methanol Fuel Cells Market Sector
- SFC Energy AG
- Ballard Power Systems Inc
- Fujikura Ltd
- MeOH Power Inc
- TreadStone Technologies Inc
- Blue World Technologies ApS
- Johnson Matthey
- Oorja Protonics Inc
- Horizon Fuel Cell Technologies
- Viaspace Inc
Key Milestones in Direct Methanol Fuel Cells Market Industry
- January 2021: Johnson Matthey secures a multi-million pound agreement with SFC Energy AG to supply 400,000 Direct Methanol MEA components, significantly boosting the production capacity for DMFCs and strengthening the collaboration between key players in the industry. This deal underscores the growing demand for DMFC technology and the increasing focus on improving MEA performance and manufacturing efficiency.
Strategic Outlook for Direct Methanol Fuel Cells Market Market
The future of the DMFC market is bright, with significant potential for growth driven by technological advancements, supportive government policies, and increasing demand for clean and efficient energy solutions. Strategic partnerships and investments in research and development will be key to unlocking this potential. Focus on reducing costs, improving durability, and expanding applications will be crucial for sustained market expansion and competitiveness. The DMFC market is well-positioned to capture significant market share in various sectors, particularly portable power and niche stationary applications, within the next decade.
Direct Methanol Fuel Cells Market Segmentation
- 1. Production Analysis
- 2. Consumption Analysis
- 3. Import Market Analysis (Value & Volume)
- 4. Export Market Analysis (Value & Volume)
- 5. Price Trend Analysis
Direct Methanol Fuel Cells Market Segmentation By Geography
- 1. North America
- 2. Europe
- 3. Asia Pacific
- 4. South America
- 5. Middle East and Africa
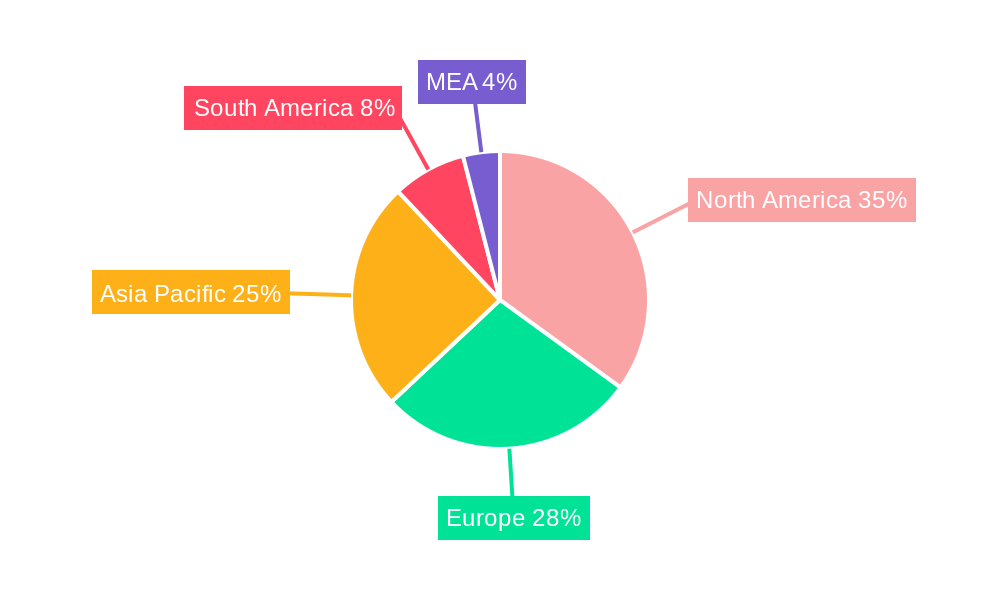
Direct Methanol Fuel Cells Market Regional Market Share
Geographic Coverage of Direct Methanol Fuel Cells Market
Direct Methanol Fuel Cells Market REPORT HIGHLIGHTS
| Aspects | Details |
|---|---|
| Study Period | 2020-2034 |
| Base Year | 2025 |
| Estimated Year | 2026 |
| Forecast Period | 2026-2034 |
| Historical Period | 2020-2025 |
| Growth Rate | CAGR of 8.8% from 2020-2034 |
| Segmentation |
|
Table of Contents
- 1. Introduction
- 1.1. Research Scope
- 1.2. Market Segmentation
- 1.3. Research Objective
- 1.4. Definitions and Assumptions
- 2. Executive Summary
- 2.1. Market Snapshot
- 3. Market Dynamics
- 3.1. Market Drivers
- 3.2. Market Restrains
- 3.3. Market Trends
- 3.4. Market Opportunities
- 4. Market Factor Analysis
- 4.1. Porters Five Forces
- 4.1.1. Bargaining Power of Suppliers
- 4.1.2. Bargaining Power of Buyers
- 4.1.3. Threat of New Entrants
- 4.1.4. Threat of Substitutes
- 4.1.5. Competitive Rivalry
- 4.2. PESTEL analysis
- 4.3. BCG Analysis
- 4.3.1. Stars (High Growth, High Market Share)
- 4.3.2. Cash Cows (Low Growth, High Market Share)
- 4.3.3. Question Mark (High Growth, Low Market Share)
- 4.3.4. Dogs (Low Growth, Low Market Share)
- 4.4. Ansoff Matrix Analysis
- 4.5. Supply Chain Analysis
- 4.6. Regulatory Landscape
- 4.7. Current Market Potential and Opportunity Assessment (TAM–SAM–SOM Framework)
- 4.8. MDP Analyst Note
- 4.1. Porters Five Forces
- 5. Market Analysis, Insights and Forecast 2021-2033
- 5.1. Market Analysis, Insights and Forecast - by Production Analysis
- 5.2. Market Analysis, Insights and Forecast - by Consumption Analysis
- 5.3. Market Analysis, Insights and Forecast - by Import Market Analysis (Value & Volume)
- 5.4. Market Analysis, Insights and Forecast - by Export Market Analysis (Value & Volume)
- 5.5. Market Analysis, Insights and Forecast - by Price Trend Analysis
- 5.6. Market Analysis, Insights and Forecast - by Region
- 5.6.1. North America
- 5.6.2. Europe
- 5.6.3. Asia Pacific
- 5.6.4. South America
- 5.6.5. Middle East and Africa
- 6. Global Direct Methanol Fuel Cells Market Analysis, Insights and Forecast, 2021-2033
- 6.1. Market Analysis, Insights and Forecast - by Production Analysis
- 6.2. Market Analysis, Insights and Forecast - by Consumption Analysis
- 6.3. Market Analysis, Insights and Forecast - by Import Market Analysis (Value & Volume)
- 6.4. Market Analysis, Insights and Forecast - by Export Market Analysis (Value & Volume)
- 6.5. Market Analysis, Insights and Forecast - by Price Trend Analysis
- 7. North America Direct Methanol Fuel Cells Market Analysis, Insights and Forecast, 2020-2032
- 7.1. Market Analysis, Insights and Forecast - by Production Analysis
- 7.2. Market Analysis, Insights and Forecast - by Consumption Analysis
- 7.3. Market Analysis, Insights and Forecast - by Import Market Analysis (Value & Volume)
- 7.4. Market Analysis, Insights and Forecast - by Export Market Analysis (Value & Volume)
- 7.5. Market Analysis, Insights and Forecast - by Price Trend Analysis
- 8. Europe Direct Methanol Fuel Cells Market Analysis, Insights and Forecast, 2020-2032
- 8.1. Market Analysis, Insights and Forecast - by Production Analysis
- 8.2. Market Analysis, Insights and Forecast - by Consumption Analysis
- 8.3. Market Analysis, Insights and Forecast - by Import Market Analysis (Value & Volume)
- 8.4. Market Analysis, Insights and Forecast - by Export Market Analysis (Value & Volume)
- 8.5. Market Analysis, Insights and Forecast - by Price Trend Analysis
- 9. Asia Pacific Direct Methanol Fuel Cells Market Analysis, Insights and Forecast, 2020-2032
- 9.1. Market Analysis, Insights and Forecast - by Production Analysis
- 9.2. Market Analysis, Insights and Forecast - by Consumption Analysis
- 9.3. Market Analysis, Insights and Forecast - by Import Market Analysis (Value & Volume)
- 9.4. Market Analysis, Insights and Forecast - by Export Market Analysis (Value & Volume)
- 9.5. Market Analysis, Insights and Forecast - by Price Trend Analysis
- 10. South America Direct Methanol Fuel Cells Market Analysis, Insights and Forecast, 2020-2032
- 10.1. Market Analysis, Insights and Forecast - by Production Analysis
- 10.2. Market Analysis, Insights and Forecast - by Consumption Analysis
- 10.3. Market Analysis, Insights and Forecast - by Import Market Analysis (Value & Volume)
- 10.4. Market Analysis, Insights and Forecast - by Export Market Analysis (Value & Volume)
- 10.5. Market Analysis, Insights and Forecast - by Price Trend Analysis
- 11. Middle East and Africa Direct Methanol Fuel Cells Market Analysis, Insights and Forecast, 2020-2032
- 11.1. Market Analysis, Insights and Forecast - by Production Analysis
- 11.2. Market Analysis, Insights and Forecast - by Consumption Analysis
- 11.3. Market Analysis, Insights and Forecast - by Import Market Analysis (Value & Volume)
- 11.4. Market Analysis, Insights and Forecast - by Export Market Analysis (Value & Volume)
- 11.5. Market Analysis, Insights and Forecast - by Price Trend Analysis
- 12. Competitive Analysis
- 12.1. Company Profiles
- 12.1.1 SFC Energy AG
- 12.1.1.1. Company Overview
- 12.1.1.2. Products
- 12.1.1.3. Company Financials
- 12.1.1.4. SWOT Analysis
- 12.1.2 Ballard Power Systems Inc
- 12.1.2.1. Company Overview
- 12.1.2.2. Products
- 12.1.2.3. Company Financials
- 12.1.2.4. SWOT Analysis
- 12.1.3 Fujikura Ltd *List Not Exhaustive
- 12.1.3.1. Company Overview
- 12.1.3.2. Products
- 12.1.3.3. Company Financials
- 12.1.3.4. SWOT Analysis
- 12.1.4 MeOH Power Inc
- 12.1.4.1. Company Overview
- 12.1.4.2. Products
- 12.1.4.3. Company Financials
- 12.1.4.4. SWOT Analysis
- 12.1.5 TreadStone Technologies Inc
- 12.1.5.1. Company Overview
- 12.1.5.2. Products
- 12.1.5.3. Company Financials
- 12.1.5.4. SWOT Analysis
- 12.1.6 Blue World Technologies ApS
- 12.1.6.1. Company Overview
- 12.1.6.2. Products
- 12.1.6.3. Company Financials
- 12.1.6.4. SWOT Analysis
- 12.1.7 Johnson Matthey
- 12.1.7.1. Company Overview
- 12.1.7.2. Products
- 12.1.7.3. Company Financials
- 12.1.7.4. SWOT Analysis
- 12.1.8 Oorja Protonics Inc
- 12.1.8.1. Company Overview
- 12.1.8.2. Products
- 12.1.8.3. Company Financials
- 12.1.8.4. SWOT Analysis
- 12.1.9 Horizon Fuel Cell Technologies
- 12.1.9.1. Company Overview
- 12.1.9.2. Products
- 12.1.9.3. Company Financials
- 12.1.9.4. SWOT Analysis
- 12.1.10 Viaspace Inc
- 12.1.10.1. Company Overview
- 12.1.10.2. Products
- 12.1.10.3. Company Financials
- 12.1.10.4. SWOT Analysis
- 12.1.1 SFC Energy AG
- 12.2. Market Entropy
- 12.2.1 Company's Key Areas Served
- 12.2.2 Recent Developments
- 12.3. Company Market Share Analysis 2025
- 12.3.1 Top 5 Companies Market Share Analysis
- 12.3.2 Top 3 Companies Market Share Analysis
- 12.4. List of Potential Customers
- 13. Research Methodology
List of Figures
- Figure 1: Global Direct Methanol Fuel Cells Market Revenue Breakdown (billion, %) by Region 2025 & 2033
- Figure 2: North America Direct Methanol Fuel Cells Market Revenue (billion), by Production Analysis 2025 & 2033
- Figure 3: North America Direct Methanol Fuel Cells Market Revenue Share (%), by Production Analysis 2025 & 2033
- Figure 4: North America Direct Methanol Fuel Cells Market Revenue (billion), by Consumption Analysis 2025 & 2033
- Figure 5: North America Direct Methanol Fuel Cells Market Revenue Share (%), by Consumption Analysis 2025 & 2033
- Figure 6: North America Direct Methanol Fuel Cells Market Revenue (billion), by Import Market Analysis (Value & Volume) 2025 & 2033
- Figure 7: North America Direct Methanol Fuel Cells Market Revenue Share (%), by Import Market Analysis (Value & Volume) 2025 & 2033
- Figure 8: North America Direct Methanol Fuel Cells Market Revenue (billion), by Export Market Analysis (Value & Volume) 2025 & 2033
- Figure 9: North America Direct Methanol Fuel Cells Market Revenue Share (%), by Export Market Analysis (Value & Volume) 2025 & 2033
- Figure 10: North America Direct Methanol Fuel Cells Market Revenue (billion), by Price Trend Analysis 2025 & 2033
- Figure 11: North America Direct Methanol Fuel Cells Market Revenue Share (%), by Price Trend Analysis 2025 & 2033
- Figure 12: North America Direct Methanol Fuel Cells Market Revenue (billion), by Country 2025 & 2033
- Figure 13: North America Direct Methanol Fuel Cells Market Revenue Share (%), by Country 2025 & 2033
- Figure 14: Europe Direct Methanol Fuel Cells Market Revenue (billion), by Production Analysis 2025 & 2033
- Figure 15: Europe Direct Methanol Fuel Cells Market Revenue Share (%), by Production Analysis 2025 & 2033
- Figure 16: Europe Direct Methanol Fuel Cells Market Revenue (billion), by Consumption Analysis 2025 & 2033
- Figure 17: Europe Direct Methanol Fuel Cells Market Revenue Share (%), by Consumption Analysis 2025 & 2033
- Figure 18: Europe Direct Methanol Fuel Cells Market Revenue (billion), by Import Market Analysis (Value & Volume) 2025 & 2033
- Figure 19: Europe Direct Methanol Fuel Cells Market Revenue Share (%), by Import Market Analysis (Value & Volume) 2025 & 2033
- Figure 20: Europe Direct Methanol Fuel Cells Market Revenue (billion), by Export Market Analysis (Value & Volume) 2025 & 2033
- Figure 21: Europe Direct Methanol Fuel Cells Market Revenue Share (%), by Export Market Analysis (Value & Volume) 2025 & 2033
- Figure 22: Europe Direct Methanol Fuel Cells Market Revenue (billion), by Price Trend Analysis 2025 & 2033
- Figure 23: Europe Direct Methanol Fuel Cells Market Revenue Share (%), by Price Trend Analysis 2025 & 2033
- Figure 24: Europe Direct Methanol Fuel Cells Market Revenue (billion), by Country 2025 & 2033
- Figure 25: Europe Direct Methanol Fuel Cells Market Revenue Share (%), by Country 2025 & 2033
- Figure 26: Asia Pacific Direct Methanol Fuel Cells Market Revenue (billion), by Production Analysis 2025 & 2033
- Figure 27: Asia Pacific Direct Methanol Fuel Cells Market Revenue Share (%), by Production Analysis 2025 & 2033
- Figure 28: Asia Pacific Direct Methanol Fuel Cells Market Revenue (billion), by Consumption Analysis 2025 & 2033
- Figure 29: Asia Pacific Direct Methanol Fuel Cells Market Revenue Share (%), by Consumption Analysis 2025 & 2033
- Figure 30: Asia Pacific Direct Methanol Fuel Cells Market Revenue (billion), by Import Market Analysis (Value & Volume) 2025 & 2033
- Figure 31: Asia Pacific Direct Methanol Fuel Cells Market Revenue Share (%), by Import Market Analysis (Value & Volume) 2025 & 2033
- Figure 32: Asia Pacific Direct Methanol Fuel Cells Market Revenue (billion), by Export Market Analysis (Value & Volume) 2025 & 2033
- Figure 33: Asia Pacific Direct Methanol Fuel Cells Market Revenue Share (%), by Export Market Analysis (Value & Volume) 2025 & 2033
- Figure 34: Asia Pacific Direct Methanol Fuel Cells Market Revenue (billion), by Price Trend Analysis 2025 & 2033
- Figure 35: Asia Pacific Direct Methanol Fuel Cells Market Revenue Share (%), by Price Trend Analysis 2025 & 2033
- Figure 36: Asia Pacific Direct Methanol Fuel Cells Market Revenue (billion), by Country 2025 & 2033
- Figure 37: Asia Pacific Direct Methanol Fuel Cells Market Revenue Share (%), by Country 2025 & 2033
- Figure 38: South America Direct Methanol Fuel Cells Market Revenue (billion), by Production Analysis 2025 & 2033
- Figure 39: South America Direct Methanol Fuel Cells Market Revenue Share (%), by Production Analysis 2025 & 2033
- Figure 40: South America Direct Methanol Fuel Cells Market Revenue (billion), by Consumption Analysis 2025 & 2033
- Figure 41: South America Direct Methanol Fuel Cells Market Revenue Share (%), by Consumption Analysis 2025 & 2033
- Figure 42: South America Direct Methanol Fuel Cells Market Revenue (billion), by Import Market Analysis (Value & Volume) 2025 & 2033
- Figure 43: South America Direct Methanol Fuel Cells Market Revenue Share (%), by Import Market Analysis (Value & Volume) 2025 & 2033
- Figure 44: South America Direct Methanol Fuel Cells Market Revenue (billion), by Export Market Analysis (Value & Volume) 2025 & 2033
- Figure 45: South America Direct Methanol Fuel Cells Market Revenue Share (%), by Export Market Analysis (Value & Volume) 2025 & 2033
- Figure 46: South America Direct Methanol Fuel Cells Market Revenue (billion), by Price Trend Analysis 2025 & 2033
- Figure 47: South America Direct Methanol Fuel Cells Market Revenue Share (%), by Price Trend Analysis 2025 & 2033
- Figure 48: South America Direct Methanol Fuel Cells Market Revenue (billion), by Country 2025 & 2033
- Figure 49: South America Direct Methanol Fuel Cells Market Revenue Share (%), by Country 2025 & 2033
- Figure 50: Middle East and Africa Direct Methanol Fuel Cells Market Revenue (billion), by Production Analysis 2025 & 2033
- Figure 51: Middle East and Africa Direct Methanol Fuel Cells Market Revenue Share (%), by Production Analysis 2025 & 2033
- Figure 52: Middle East and Africa Direct Methanol Fuel Cells Market Revenue (billion), by Consumption Analysis 2025 & 2033
- Figure 53: Middle East and Africa Direct Methanol Fuel Cells Market Revenue Share (%), by Consumption Analysis 2025 & 2033
- Figure 54: Middle East and Africa Direct Methanol Fuel Cells Market Revenue (billion), by Import Market Analysis (Value & Volume) 2025 & 2033
- Figure 55: Middle East and Africa Direct Methanol Fuel Cells Market Revenue Share (%), by Import Market Analysis (Value & Volume) 2025 & 2033
- Figure 56: Middle East and Africa Direct Methanol Fuel Cells Market Revenue (billion), by Export Market Analysis (Value & Volume) 2025 & 2033
- Figure 57: Middle East and Africa Direct Methanol Fuel Cells Market Revenue Share (%), by Export Market Analysis (Value & Volume) 2025 & 2033
- Figure 58: Middle East and Africa Direct Methanol Fuel Cells Market Revenue (billion), by Price Trend Analysis 2025 & 2033
- Figure 59: Middle East and Africa Direct Methanol Fuel Cells Market Revenue Share (%), by Price Trend Analysis 2025 & 2033
- Figure 60: Middle East and Africa Direct Methanol Fuel Cells Market Revenue (billion), by Country 2025 & 2033
- Figure 61: Middle East and Africa Direct Methanol Fuel Cells Market Revenue Share (%), by Country 2025 & 2033
List of Tables
- Table 1: Global Direct Methanol Fuel Cells Market Revenue billion Forecast, by Production Analysis 2020 & 2033
- Table 2: Global Direct Methanol Fuel Cells Market Revenue billion Forecast, by Consumption Analysis 2020 & 2033
- Table 3: Global Direct Methanol Fuel Cells Market Revenue billion Forecast, by Import Market Analysis (Value & Volume) 2020 & 2033
- Table 4: Global Direct Methanol Fuel Cells Market Revenue billion Forecast, by Export Market Analysis (Value & Volume) 2020 & 2033
- Table 5: Global Direct Methanol Fuel Cells Market Revenue billion Forecast, by Price Trend Analysis 2020 & 2033
- Table 6: Global Direct Methanol Fuel Cells Market Revenue billion Forecast, by Region 2020 & 2033
- Table 7: Global Direct Methanol Fuel Cells Market Revenue billion Forecast, by Production Analysis 2020 & 2033
- Table 8: Global Direct Methanol Fuel Cells Market Revenue billion Forecast, by Consumption Analysis 2020 & 2033
- Table 9: Global Direct Methanol Fuel Cells Market Revenue billion Forecast, by Import Market Analysis (Value & Volume) 2020 & 2033
- Table 10: Global Direct Methanol Fuel Cells Market Revenue billion Forecast, by Export Market Analysis (Value & Volume) 2020 & 2033
- Table 11: Global Direct Methanol Fuel Cells Market Revenue billion Forecast, by Price Trend Analysis 2020 & 2033
- Table 12: Global Direct Methanol Fuel Cells Market Revenue billion Forecast, by Country 2020 & 2033
- Table 13: Global Direct Methanol Fuel Cells Market Revenue billion Forecast, by Production Analysis 2020 & 2033
- Table 14: Global Direct Methanol Fuel Cells Market Revenue billion Forecast, by Consumption Analysis 2020 & 2033
- Table 15: Global Direct Methanol Fuel Cells Market Revenue billion Forecast, by Import Market Analysis (Value & Volume) 2020 & 2033
- Table 16: Global Direct Methanol Fuel Cells Market Revenue billion Forecast, by Export Market Analysis (Value & Volume) 2020 & 2033
- Table 17: Global Direct Methanol Fuel Cells Market Revenue billion Forecast, by Price Trend Analysis 2020 & 2033
- Table 18: Global Direct Methanol Fuel Cells Market Revenue billion Forecast, by Country 2020 & 2033
- Table 19: Global Direct Methanol Fuel Cells Market Revenue billion Forecast, by Production Analysis 2020 & 2033
- Table 20: Global Direct Methanol Fuel Cells Market Revenue billion Forecast, by Consumption Analysis 2020 & 2033
- Table 21: Global Direct Methanol Fuel Cells Market Revenue billion Forecast, by Import Market Analysis (Value & Volume) 2020 & 2033
- Table 22: Global Direct Methanol Fuel Cells Market Revenue billion Forecast, by Export Market Analysis (Value & Volume) 2020 & 2033
- Table 23: Global Direct Methanol Fuel Cells Market Revenue billion Forecast, by Price Trend Analysis 2020 & 2033
- Table 24: Global Direct Methanol Fuel Cells Market Revenue billion Forecast, by Country 2020 & 2033
- Table 25: Global Direct Methanol Fuel Cells Market Revenue billion Forecast, by Production Analysis 2020 & 2033
- Table 26: Global Direct Methanol Fuel Cells Market Revenue billion Forecast, by Consumption Analysis 2020 & 2033
- Table 27: Global Direct Methanol Fuel Cells Market Revenue billion Forecast, by Import Market Analysis (Value & Volume) 2020 & 2033
- Table 28: Global Direct Methanol Fuel Cells Market Revenue billion Forecast, by Export Market Analysis (Value & Volume) 2020 & 2033
- Table 29: Global Direct Methanol Fuel Cells Market Revenue billion Forecast, by Price Trend Analysis 2020 & 2033
- Table 30: Global Direct Methanol Fuel Cells Market Revenue billion Forecast, by Country 2020 & 2033
- Table 31: Global Direct Methanol Fuel Cells Market Revenue billion Forecast, by Production Analysis 2020 & 2033
- Table 32: Global Direct Methanol Fuel Cells Market Revenue billion Forecast, by Consumption Analysis 2020 & 2033
- Table 33: Global Direct Methanol Fuel Cells Market Revenue billion Forecast, by Import Market Analysis (Value & Volume) 2020 & 2033
- Table 34: Global Direct Methanol Fuel Cells Market Revenue billion Forecast, by Export Market Analysis (Value & Volume) 2020 & 2033
- Table 35: Global Direct Methanol Fuel Cells Market Revenue billion Forecast, by Price Trend Analysis 2020 & 2033
- Table 36: Global Direct Methanol Fuel Cells Market Revenue billion Forecast, by Country 2020 & 2033
Frequently Asked Questions
1. What is the projected Compound Annual Growth Rate (CAGR) of the Direct Methanol Fuel Cells Market?
The projected CAGR is approximately 8.8%.
2. Which companies are prominent players in the Direct Methanol Fuel Cells Market?
Key companies in the market include SFC Energy AG, Ballard Power Systems Inc, Fujikura Ltd *List Not Exhaustive, MeOH Power Inc, TreadStone Technologies Inc, Blue World Technologies ApS, Johnson Matthey, Oorja Protonics Inc, Horizon Fuel Cell Technologies, Viaspace Inc.
3. What are the main segments of the Direct Methanol Fuel Cells Market?
The market segments include Production Analysis, Consumption Analysis, Import Market Analysis (Value & Volume), Export Market Analysis (Value & Volume), Price Trend Analysis.
4. Can you provide details about the market size?
The market size is estimated to be USD 3.9 billion as of 2022.
5. What are some drivers contributing to market growth?
4.; Increase in Prices of Electricity Procured from Conventional Mechanisms 4.; Decline in Cost of Solar Energy Infrastructure.
6. What are the notable trends driving market growth?
Technological Advancements Expected to Drive the Market Demand.
7. Are there any restraints impacting market growth?
4.; Competition from Other Alternative Energy Sources.
8. Can you provide examples of recent developments in the market?
In Jaunuary 2021, Johnson Matthey (JM), has won a new multi-million pound agreement to provide 400,000 Direct Methanol MEA (Membrane Electrode Assemblies) fuel cell components to SFC Energy AG (SFC), a global leader of hydrogen and direct methanol fuel cells for stationary and mobile hybrid power solutions. The agreement is considered from February 2021 for a duration of over three years.
9. What pricing options are available for accessing the report?
Pricing options include single-user, multi-user, and enterprise licenses priced at USD 4750, USD 5250, and USD 8750 respectively.
10. Is the market size provided in terms of value or volume?
The market size is provided in terms of value, measured in billion.
11. Are there any specific market keywords associated with the report?
Yes, the market keyword associated with the report is "Direct Methanol Fuel Cells Market," which aids in identifying and referencing the specific market segment covered.
12. How do I determine which pricing option suits my needs best?
The pricing options vary based on user requirements and access needs. Individual users may opt for single-user licenses, while businesses requiring broader access may choose multi-user or enterprise licenses for cost-effective access to the report.
13. Are there any additional resources or data provided in the Direct Methanol Fuel Cells Market report?
While the report offers comprehensive insights, it's advisable to review the specific contents or supplementary materials provided to ascertain if additional resources or data are available.
14. How can I stay updated on further developments or reports in the Direct Methanol Fuel Cells Market?
To stay informed about further developments, trends, and reports in the Direct Methanol Fuel Cells Market, consider subscribing to industry newsletters, following relevant companies and organizations, or regularly checking reputable industry news sources and publications.
Methodology
Step 1 - Identification of Relevant Samples Size from Population Database


Step 2 - Approaches for Defining Global Market Size (Value, Volume* & Price*)

Note*: In applicable scenarios
Step 3 - Data Sources
Primary Research
- Web Analytics
- Survey Reports
- Research Institute
- Latest Research Reports
- Opinion Leaders
Secondary Research
- Annual Reports
- White Paper
- Latest Press Release
- Industry Association
- Paid Database
- Investor Presentations

Step 4 - Data Triangulation
Involves using different sources of information in order to increase the validity of a study
These sources are likely to be stakeholders in a program - participants, other researchers, program staff, other community members, and so on.
Then we put all data in single framework & apply various statistical tools to find out the dynamic on the market.
During the analysis stage, feedback from the stakeholder groups would be compared to determine areas of agreement as well as areas of divergence