

Key Insights
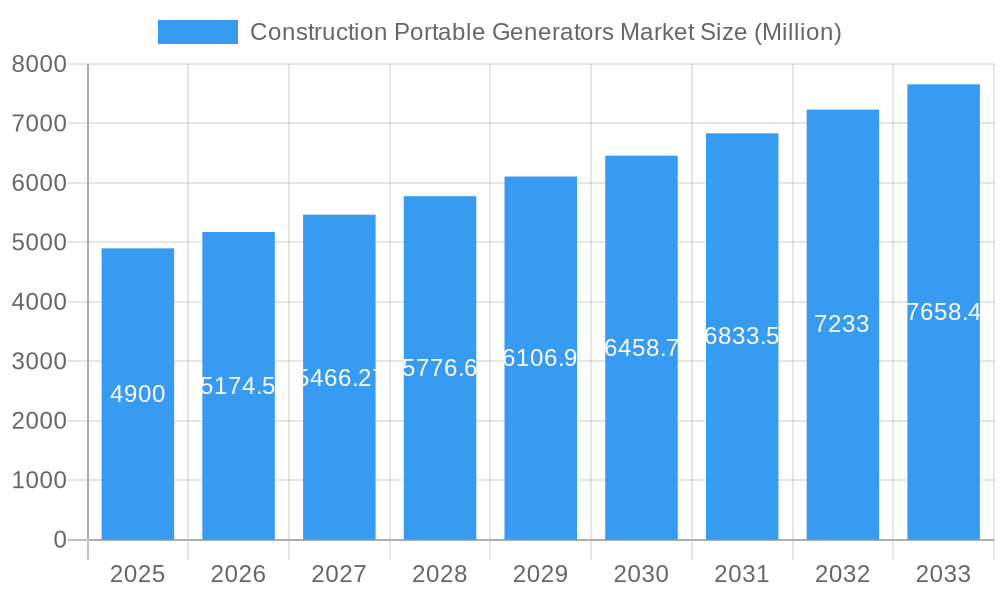
The Construction Portable Generators market, valued at $4.90 billion in 2025, is projected to experience robust growth, exhibiting a Compound Annual Growth Rate (CAGR) of 5.50% from 2025 to 2033. This expansion is driven by several key factors. The increasing urbanization and infrastructure development globally fuel demand for reliable power solutions at construction sites. Rising adoption of technologically advanced generators, offering improved fuel efficiency, reduced emissions, and enhanced safety features, further propels market growth. Moreover, stringent government regulations regarding workplace safety and environmental protection are influencing the shift towards cleaner and more efficient portable generators. The market is segmented by power rating (below 5 kW, 5-10 kW, above 10 kW) and fuel type (gas, diesel, other fuel types), with diesel generators currently dominating due to their higher power output and longer runtime. North America and Europe represent significant market shares, driven by established construction industries and infrastructure projects. However, the Asia-Pacific region is expected to witness significant growth in the coming years, fueled by rapid industrialization and infrastructure development in countries like China and India. Competitive pressures from established players like Briggs & Stratton, Atlas Copco, and Generac Holdings, coupled with the emergence of new entrants, contribute to market dynamism. Challenges include fluctuating fuel prices and increasing concerns about carbon emissions. Nevertheless, ongoing technological advancements and government initiatives promoting sustainable construction practices are expected to mitigate these challenges and sustain the market's positive growth trajectory.
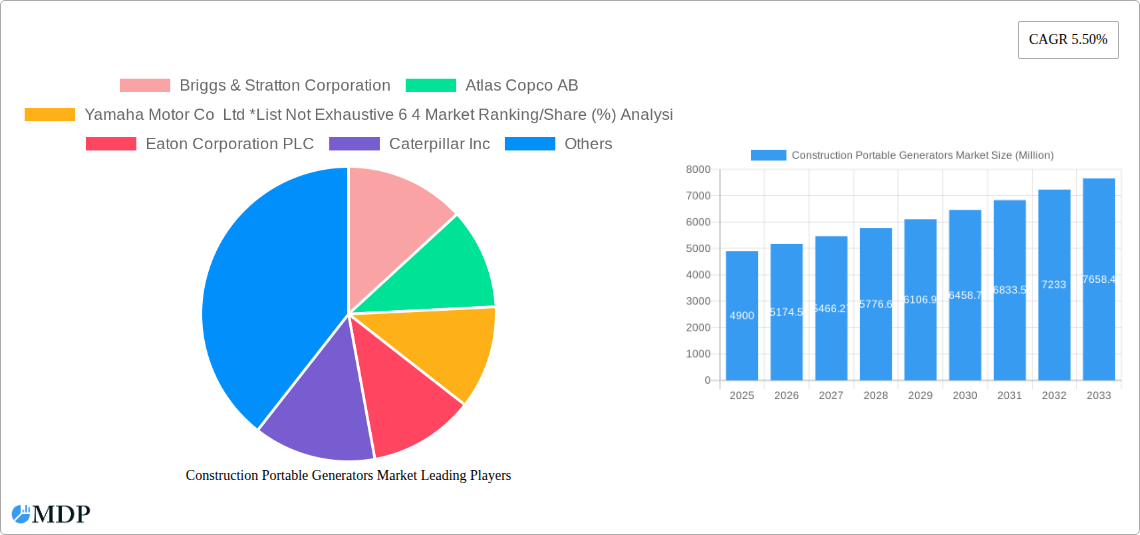
Construction Portable Generators Market Market Size (In Billion)
The market's growth will be influenced by several factors in the coming years. The expanding renewable energy sector and the integration of smart technologies in construction equipment are likely to create new opportunities. The growing adoption of hybrid and electric construction equipment may, however, present a challenge to traditional diesel-powered generators in the long term. Market players will need to adapt by offering more sustainable and efficient generator solutions, along with comprehensive service and maintenance packages, to maintain their competitive edge. Regional variations in economic growth, infrastructure spending, and environmental regulations will influence the market's performance across different geographical segments. Therefore, a nuanced understanding of these diverse regional dynamics is crucial for strategic market planning and investment decisions. The market's future trajectory depends on effectively navigating these opportunities and challenges.
Construction Portable Generators Market Company Market Share
Construction Portable Generators Market: A Comprehensive Report (2019-2033)
This in-depth report provides a comprehensive analysis of the global Construction Portable Generators market, offering invaluable insights for stakeholders across the value chain. From market dynamics and competitive landscapes to future growth opportunities, this report is your essential guide to navigating this dynamic sector. The study period spans 2019-2033, with 2025 serving as the base and estimated year. The forecast period covers 2025-2033, while the historical period encompasses 2019-2024. The market size is projected to reach xx Million by 2033, exhibiting a CAGR of xx% during the forecast period.
Construction Portable Generators Market Market Dynamics & Concentration
The Construction Portable Generators market is characterized by a moderately concentrated landscape, with key players like Generac Holdings Inc, Kohler Power Systems, and Caterpillar Inc holding significant market share. However, the market exhibits dynamic competitive forces driven by ongoing innovation, stringent regulatory frameworks, and the emergence of substitute technologies. Market concentration is estimated at xx%, with the top 5 players commanding approximately xx% of the market share in 2025. Innovation is primarily focused on enhancing fuel efficiency, reducing emissions, and improving durability. Regulatory pressures, particularly concerning emissions standards, are shaping product development and influencing market dynamics. The number of M&A deals in the sector has averaged xx per year over the past five years, reflecting the ongoing consolidation within the industry.
- Market Concentration: xx% (2025)
- Top 5 Players Market Share: xx% (2025)
- Average Annual M&A Deals (2020-2024): xx
- Key Regulatory Drivers: Emission standards, safety regulations
Construction Portable Generators Market Industry Trends & Analysis
The Construction Portable Generators market is experiencing robust growth driven by the expansion of the construction industry globally, particularly in developing economies. Technological advancements, such as the incorporation of smart features and improved power management systems, are enhancing product appeal. Consumer preference is shifting towards fuel-efficient, environmentally friendly, and durable generators. Competitive dynamics are intense, with manufacturers focusing on product differentiation, pricing strategies, and distribution networks. Market penetration for technologically advanced generators is increasing at a CAGR of xx% during the forecast period, reflecting the growing demand for superior performance and features. The market is witnessing increasing adoption of digital technologies for remote monitoring and control, further enhancing efficiency and user experience.
Leading Markets & Segments in Construction Portable Generators Market
North America currently dominates the Construction Portable Generators market, driven by robust construction activity and a well-established infrastructure. Within the power rating segment, the 5-10 kW category holds the largest market share, catering to the majority of construction applications. Diesel generators maintain a significant share in the fuel type segment due to their superior power output and extended runtime.
- Dominant Region: North America
- Leading Power Rating Segment: 5-10 kW
- Key Fuel Type: Diesel
- Drivers for North America: Strong construction sector, established infrastructure, high disposable income.
- Drivers for 5-10 kW segment: Wide range of applications, balance between power and portability.
- Drivers for Diesel fuel type: High power output, longer runtime, suitability for demanding applications.
Construction Portable Generators Market Product Developments
Recent product innovations focus on incorporating advanced technologies like digital control systems, improved fuel efficiency, and enhanced safety features. The market is witnessing a growing demand for quieter and more compact generators, aligning with the need for improved jobsite ergonomics and reduced noise pollution. These developments offer competitive advantages through improved performance, durability, and user-friendliness.
Key Drivers of Construction Portable Generators Market Growth
The growth of the Construction Portable Generators market is propelled by several factors:
- Rising construction activity: Global infrastructure development and urbanization are driving demand.
- Technological advancements: Improved fuel efficiency, enhanced power output, and smart features are boosting adoption.
- Government regulations: Stringent emission norms are pushing manufacturers to develop cleaner technologies.
Challenges in the Construction Portable Generators Market Market
Significant challenges impacting market growth include:
- Fluctuating raw material prices: Increases in the cost of raw materials, such as steel and metals, directly impact manufacturing costs.
- Supply chain disruptions: Global supply chain volatility can lead to production delays and increased costs.
- Intense competition: The presence of numerous established and emerging players creates a competitive landscape.
Emerging Opportunities in Construction Portable Generators Market
The Construction Portable Generators market offers significant long-term growth opportunities:
- Expansion into developing markets: Rapid infrastructure development in emerging economies presents a vast potential market.
- Strategic partnerships and collaborations: Joint ventures between manufacturers and technology providers can lead to innovative products and solutions.
- Development of eco-friendly generators: The increasing focus on sustainability will drive demand for greener technologies.
Leading Players in the Construction Portable Generators Market Sector
- Briggs & Stratton Corporation
- Atlas Copco AB
- Yamaha Motor Co Ltd
- Eaton Corporation PLC
- Caterpillar Inc
- Honda Siel Power Products Ltd
- Kohler Power Systems
- Wacker Neuson SE
- Generac Holdings Inc
Key Milestones in Construction Portable Generators Market Industry
- 2022 Q3: Generac Holdings Inc. launched a new line of portable generators with enhanced fuel efficiency.
- 2021 Q4: Kohler Power Systems introduced a smart generator with remote monitoring capabilities.
- 2020 Q1: A major merger occurred between two smaller portable generator manufacturers, leading to increased market concentration. (Specific details on the merger would be included in the full report)
Strategic Outlook for Construction Portable Generators Market Market
The Construction Portable Generators market is poised for significant growth driven by ongoing technological innovation, expanding infrastructure projects, and rising environmental concerns. Strategic opportunities lie in developing eco-friendly solutions, leveraging digital technologies, and expanding into high-growth markets. Companies that successfully adapt to evolving consumer preferences and regulatory requirements will be best positioned to capitalize on future market expansion.
Construction Portable Generators Market Segmentation
-
1. Power Rating
- 1.1. Below 5 KW
- 1.2. 5-10 KW
- 1.3. Above 10 KW
-
2. Fuel Type
- 2.1. Gas
- 2.2. Diesel
- 2.3. Other Fuel Types
Construction Portable Generators Market Segmentation By Geography
-
1. North America
- 1.1. United States
- 1.2. Canada
- 1.3. Rest of North America
-
2. Europe
- 2.1. Germany
- 2.2. France
- 2.3. United Kingdom
- 2.4. Spain
- 2.5. NORDIC
- 2.6. Turkey
- 2.7. Russia
- 2.8. Rest of Europe
-
3. Asia Pacific
- 3.1. China
- 3.2. India
- 3.3. Japan
- 3.4. South Korea
- 3.5. Malaysia
- 3.6. Thailand
- 3.7. Indonesia
- 3.8. Vietnam
- 3.9. Rest of Asia Pacific
-
4. South America
- 4.1. Brazil
- 4.2. Argentina
- 4.3. Colombia
- 4.4. Rest of South America
-
5. Middle East and Africa
- 5.1. Saudi Arabia
- 5.2. United Arab Emirates
- 5.3. South Africa
- 5.4. Egypt
- 5.5. Nigeria
- 5.6. Qatar
- 5.7. Rest of Middle East and Africa
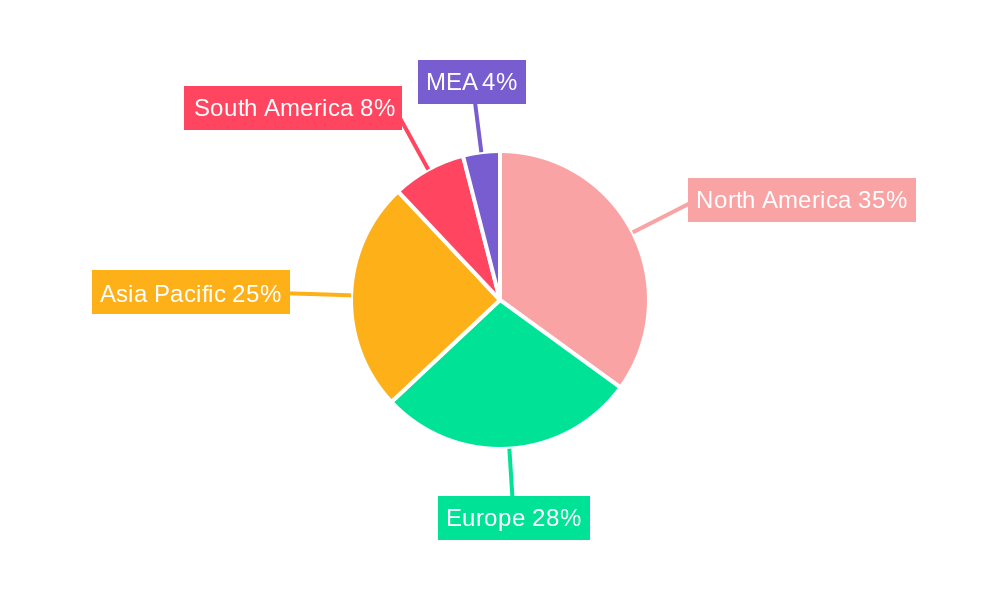
Construction Portable Generators Market Regional Market Share
Geographic Coverage of Construction Portable Generators Market
Construction Portable Generators Market REPORT HIGHLIGHTS
| Aspects | Details |
|---|---|
| Study Period | 2020-2034 |
| Base Year | 2025 |
| Estimated Year | 2026 |
| Forecast Period | 2026-2034 |
| Historical Period | 2020-2025 |
| Growth Rate | CAGR of 5.50% from 2020-2034 |
| Segmentation |
|
Table of Contents
- 1. Introduction
- 1.1. Research Scope
- 1.2. Market Segmentation
- 1.3. Research Objective
- 1.4. Definitions and Assumptions
- 2. Executive Summary
- 2.1. Market Snapshot
- 3. Market Dynamics
- 3.1. Market Drivers
- 3.2. Market Restrains
- 3.3. Market Trends
- 3.4. Market Opportunities
- 4. Market Factor Analysis
- 4.1. Porters Five Forces
- 4.1.1. Bargaining Power of Suppliers
- 4.1.2. Bargaining Power of Buyers
- 4.1.3. Threat of New Entrants
- 4.1.4. Threat of Substitutes
- 4.1.5. Competitive Rivalry
- 4.2. PESTEL analysis
- 4.3. BCG Analysis
- 4.3.1. Stars (High Growth, High Market Share)
- 4.3.2. Cash Cows (Low Growth, High Market Share)
- 4.3.3. Question Mark (High Growth, Low Market Share)
- 4.3.4. Dogs (Low Growth, Low Market Share)
- 4.4. Ansoff Matrix Analysis
- 4.5. Supply Chain Analysis
- 4.6. Regulatory Landscape
- 4.7. Current Market Potential and Opportunity Assessment (TAM–SAM–SOM Framework)
- 4.8. MDP Analyst Note
- 4.1. Porters Five Forces
- 5. Market Analysis, Insights and Forecast 2021-2033
- 5.1. Market Analysis, Insights and Forecast - by Power Rating
- 5.1.1. Below 5 KW
- 5.1.2. 5-10 KW
- 5.1.3. Above 10 KW
- 5.2. Market Analysis, Insights and Forecast - by Fuel Type
- 5.2.1. Gas
- 5.2.2. Diesel
- 5.2.3. Other Fuel Types
- 5.3. Market Analysis, Insights and Forecast - by Region
- 5.3.1. North America
- 5.3.2. Europe
- 5.3.3. Asia Pacific
- 5.3.4. South America
- 5.3.5. Middle East and Africa
- 5.1. Market Analysis, Insights and Forecast - by Power Rating
- 6. Global Construction Portable Generators Market Analysis, Insights and Forecast, 2021-2033
- 6.1. Market Analysis, Insights and Forecast - by Power Rating
- 6.1.1. Below 5 KW
- 6.1.2. 5-10 KW
- 6.1.3. Above 10 KW
- 6.2. Market Analysis, Insights and Forecast - by Fuel Type
- 6.2.1. Gas
- 6.2.2. Diesel
- 6.2.3. Other Fuel Types
- 6.1. Market Analysis, Insights and Forecast - by Power Rating
- 7. North America Construction Portable Generators Market Analysis, Insights and Forecast, 2020-2032
- 7.1. Market Analysis, Insights and Forecast - by Power Rating
- 7.1.1. Below 5 KW
- 7.1.2. 5-10 KW
- 7.1.3. Above 10 KW
- 7.2. Market Analysis, Insights and Forecast - by Fuel Type
- 7.2.1. Gas
- 7.2.2. Diesel
- 7.2.3. Other Fuel Types
- 7.1. Market Analysis, Insights and Forecast - by Power Rating
- 8. Europe Construction Portable Generators Market Analysis, Insights and Forecast, 2020-2032
- 8.1. Market Analysis, Insights and Forecast - by Power Rating
- 8.1.1. Below 5 KW
- 8.1.2. 5-10 KW
- 8.1.3. Above 10 KW
- 8.2. Market Analysis, Insights and Forecast - by Fuel Type
- 8.2.1. Gas
- 8.2.2. Diesel
- 8.2.3. Other Fuel Types
- 8.1. Market Analysis, Insights and Forecast - by Power Rating
- 9. Asia Pacific Construction Portable Generators Market Analysis, Insights and Forecast, 2020-2032
- 9.1. Market Analysis, Insights and Forecast - by Power Rating
- 9.1.1. Below 5 KW
- 9.1.2. 5-10 KW
- 9.1.3. Above 10 KW
- 9.2. Market Analysis, Insights and Forecast - by Fuel Type
- 9.2.1. Gas
- 9.2.2. Diesel
- 9.2.3. Other Fuel Types
- 9.1. Market Analysis, Insights and Forecast - by Power Rating
- 10. South America Construction Portable Generators Market Analysis, Insights and Forecast, 2020-2032
- 10.1. Market Analysis, Insights and Forecast - by Power Rating
- 10.1.1. Below 5 KW
- 10.1.2. 5-10 KW
- 10.1.3. Above 10 KW
- 10.2. Market Analysis, Insights and Forecast - by Fuel Type
- 10.2.1. Gas
- 10.2.2. Diesel
- 10.2.3. Other Fuel Types
- 10.1. Market Analysis, Insights and Forecast - by Power Rating
- 11. Middle East and Africa Construction Portable Generators Market Analysis, Insights and Forecast, 2020-2032
- 11.1. Market Analysis, Insights and Forecast - by Power Rating
- 11.1.1. Below 5 KW
- 11.1.2. 5-10 KW
- 11.1.3. Above 10 KW
- 11.2. Market Analysis, Insights and Forecast - by Fuel Type
- 11.2.1. Gas
- 11.2.2. Diesel
- 11.2.3. Other Fuel Types
- 11.1. Market Analysis, Insights and Forecast - by Power Rating
- 12. Competitive Analysis
- 12.1. Company Profiles
- 12.1.1 Briggs & Stratton Corporation
- 12.1.1.1. Company Overview
- 12.1.1.2. Products
- 12.1.1.3. Company Financials
- 12.1.1.4. SWOT Analysis
- 12.1.2 Atlas Copco AB
- 12.1.2.1. Company Overview
- 12.1.2.2. Products
- 12.1.2.3. Company Financials
- 12.1.2.4. SWOT Analysis
- 12.1.3 Yamaha Motor Co Ltd *List Not Exhaustive 6 4 Market Ranking/Share (%) Analysi
- 12.1.3.1. Company Overview
- 12.1.3.2. Products
- 12.1.3.3. Company Financials
- 12.1.3.4. SWOT Analysis
- 12.1.4 Eaton Corporation PLC
- 12.1.4.1. Company Overview
- 12.1.4.2. Products
- 12.1.4.3. Company Financials
- 12.1.4.4. SWOT Analysis
- 12.1.5 Caterpillar Inc
- 12.1.5.1. Company Overview
- 12.1.5.2. Products
- 12.1.5.3. Company Financials
- 12.1.5.4. SWOT Analysis
- 12.1.6 Honda Siel Power Products Ltd
- 12.1.6.1. Company Overview
- 12.1.6.2. Products
- 12.1.6.3. Company Financials
- 12.1.6.4. SWOT Analysis
- 12.1.7 Kohler Power Systems
- 12.1.7.1. Company Overview
- 12.1.7.2. Products
- 12.1.7.3. Company Financials
- 12.1.7.4. SWOT Analysis
- 12.1.8 Wacker Neuson SE
- 12.1.8.1. Company Overview
- 12.1.8.2. Products
- 12.1.8.3. Company Financials
- 12.1.8.4. SWOT Analysis
- 12.1.9 Generac Holdings Inc
- 12.1.9.1. Company Overview
- 12.1.9.2. Products
- 12.1.9.3. Company Financials
- 12.1.9.4. SWOT Analysis
- 12.1.1 Briggs & Stratton Corporation
- 12.2. Market Entropy
- 12.2.1 Company's Key Areas Served
- 12.2.2 Recent Developments
- 12.3. Company Market Share Analysis 2025
- 12.3.1 Top 5 Companies Market Share Analysis
- 12.3.2 Top 3 Companies Market Share Analysis
- 12.4. List of Potential Customers
- 13. Research Methodology
List of Figures
- Figure 1: Global Construction Portable Generators Market Revenue Breakdown (Million, %) by Region 2025 & 2033
- Figure 2: Global Construction Portable Generators Market Volume Breakdown (K Unit, %) by Region 2025 & 2033
- Figure 3: North America Construction Portable Generators Market Revenue (Million), by Power Rating 2025 & 2033
- Figure 4: North America Construction Portable Generators Market Volume (K Unit), by Power Rating 2025 & 2033
- Figure 5: North America Construction Portable Generators Market Revenue Share (%), by Power Rating 2025 & 2033
- Figure 6: North America Construction Portable Generators Market Volume Share (%), by Power Rating 2025 & 2033
- Figure 7: North America Construction Portable Generators Market Revenue (Million), by Fuel Type 2025 & 2033
- Figure 8: North America Construction Portable Generators Market Volume (K Unit), by Fuel Type 2025 & 2033
- Figure 9: North America Construction Portable Generators Market Revenue Share (%), by Fuel Type 2025 & 2033
- Figure 10: North America Construction Portable Generators Market Volume Share (%), by Fuel Type 2025 & 2033
- Figure 11: North America Construction Portable Generators Market Revenue (Million), by Country 2025 & 2033
- Figure 12: North America Construction Portable Generators Market Volume (K Unit), by Country 2025 & 2033
- Figure 13: North America Construction Portable Generators Market Revenue Share (%), by Country 2025 & 2033
- Figure 14: North America Construction Portable Generators Market Volume Share (%), by Country 2025 & 2033
- Figure 15: Europe Construction Portable Generators Market Revenue (Million), by Power Rating 2025 & 2033
- Figure 16: Europe Construction Portable Generators Market Volume (K Unit), by Power Rating 2025 & 2033
- Figure 17: Europe Construction Portable Generators Market Revenue Share (%), by Power Rating 2025 & 2033
- Figure 18: Europe Construction Portable Generators Market Volume Share (%), by Power Rating 2025 & 2033
- Figure 19: Europe Construction Portable Generators Market Revenue (Million), by Fuel Type 2025 & 2033
- Figure 20: Europe Construction Portable Generators Market Volume (K Unit), by Fuel Type 2025 & 2033
- Figure 21: Europe Construction Portable Generators Market Revenue Share (%), by Fuel Type 2025 & 2033
- Figure 22: Europe Construction Portable Generators Market Volume Share (%), by Fuel Type 2025 & 2033
- Figure 23: Europe Construction Portable Generators Market Revenue (Million), by Country 2025 & 2033
- Figure 24: Europe Construction Portable Generators Market Volume (K Unit), by Country 2025 & 2033
- Figure 25: Europe Construction Portable Generators Market Revenue Share (%), by Country 2025 & 2033
- Figure 26: Europe Construction Portable Generators Market Volume Share (%), by Country 2025 & 2033
- Figure 27: Asia Pacific Construction Portable Generators Market Revenue (Million), by Power Rating 2025 & 2033
- Figure 28: Asia Pacific Construction Portable Generators Market Volume (K Unit), by Power Rating 2025 & 2033
- Figure 29: Asia Pacific Construction Portable Generators Market Revenue Share (%), by Power Rating 2025 & 2033
- Figure 30: Asia Pacific Construction Portable Generators Market Volume Share (%), by Power Rating 2025 & 2033
- Figure 31: Asia Pacific Construction Portable Generators Market Revenue (Million), by Fuel Type 2025 & 2033
- Figure 32: Asia Pacific Construction Portable Generators Market Volume (K Unit), by Fuel Type 2025 & 2033
- Figure 33: Asia Pacific Construction Portable Generators Market Revenue Share (%), by Fuel Type 2025 & 2033
- Figure 34: Asia Pacific Construction Portable Generators Market Volume Share (%), by Fuel Type 2025 & 2033
- Figure 35: Asia Pacific Construction Portable Generators Market Revenue (Million), by Country 2025 & 2033
- Figure 36: Asia Pacific Construction Portable Generators Market Volume (K Unit), by Country 2025 & 2033
- Figure 37: Asia Pacific Construction Portable Generators Market Revenue Share (%), by Country 2025 & 2033
- Figure 38: Asia Pacific Construction Portable Generators Market Volume Share (%), by Country 2025 & 2033
- Figure 39: South America Construction Portable Generators Market Revenue (Million), by Power Rating 2025 & 2033
- Figure 40: South America Construction Portable Generators Market Volume (K Unit), by Power Rating 2025 & 2033
- Figure 41: South America Construction Portable Generators Market Revenue Share (%), by Power Rating 2025 & 2033
- Figure 42: South America Construction Portable Generators Market Volume Share (%), by Power Rating 2025 & 2033
- Figure 43: South America Construction Portable Generators Market Revenue (Million), by Fuel Type 2025 & 2033
- Figure 44: South America Construction Portable Generators Market Volume (K Unit), by Fuel Type 2025 & 2033
- Figure 45: South America Construction Portable Generators Market Revenue Share (%), by Fuel Type 2025 & 2033
- Figure 46: South America Construction Portable Generators Market Volume Share (%), by Fuel Type 2025 & 2033
- Figure 47: South America Construction Portable Generators Market Revenue (Million), by Country 2025 & 2033
- Figure 48: South America Construction Portable Generators Market Volume (K Unit), by Country 2025 & 2033
- Figure 49: South America Construction Portable Generators Market Revenue Share (%), by Country 2025 & 2033
- Figure 50: South America Construction Portable Generators Market Volume Share (%), by Country 2025 & 2033
- Figure 51: Middle East and Africa Construction Portable Generators Market Revenue (Million), by Power Rating 2025 & 2033
- Figure 52: Middle East and Africa Construction Portable Generators Market Volume (K Unit), by Power Rating 2025 & 2033
- Figure 53: Middle East and Africa Construction Portable Generators Market Revenue Share (%), by Power Rating 2025 & 2033
- Figure 54: Middle East and Africa Construction Portable Generators Market Volume Share (%), by Power Rating 2025 & 2033
- Figure 55: Middle East and Africa Construction Portable Generators Market Revenue (Million), by Fuel Type 2025 & 2033
- Figure 56: Middle East and Africa Construction Portable Generators Market Volume (K Unit), by Fuel Type 2025 & 2033
- Figure 57: Middle East and Africa Construction Portable Generators Market Revenue Share (%), by Fuel Type 2025 & 2033
- Figure 58: Middle East and Africa Construction Portable Generators Market Volume Share (%), by Fuel Type 2025 & 2033
- Figure 59: Middle East and Africa Construction Portable Generators Market Revenue (Million), by Country 2025 & 2033
- Figure 60: Middle East and Africa Construction Portable Generators Market Volume (K Unit), by Country 2025 & 2033
- Figure 61: Middle East and Africa Construction Portable Generators Market Revenue Share (%), by Country 2025 & 2033
- Figure 62: Middle East and Africa Construction Portable Generators Market Volume Share (%), by Country 2025 & 2033
List of Tables
- Table 1: Global Construction Portable Generators Market Revenue Million Forecast, by Power Rating 2020 & 2033
- Table 2: Global Construction Portable Generators Market Volume K Unit Forecast, by Power Rating 2020 & 2033
- Table 3: Global Construction Portable Generators Market Revenue Million Forecast, by Fuel Type 2020 & 2033
- Table 4: Global Construction Portable Generators Market Volume K Unit Forecast, by Fuel Type 2020 & 2033
- Table 5: Global Construction Portable Generators Market Revenue Million Forecast, by Region 2020 & 2033
- Table 6: Global Construction Portable Generators Market Volume K Unit Forecast, by Region 2020 & 2033
- Table 7: Global Construction Portable Generators Market Revenue Million Forecast, by Power Rating 2020 & 2033
- Table 8: Global Construction Portable Generators Market Volume K Unit Forecast, by Power Rating 2020 & 2033
- Table 9: Global Construction Portable Generators Market Revenue Million Forecast, by Fuel Type 2020 & 2033
- Table 10: Global Construction Portable Generators Market Volume K Unit Forecast, by Fuel Type 2020 & 2033
- Table 11: Global Construction Portable Generators Market Revenue Million Forecast, by Country 2020 & 2033
- Table 12: Global Construction Portable Generators Market Volume K Unit Forecast, by Country 2020 & 2033
- Table 13: United States Construction Portable Generators Market Revenue (Million) Forecast, by Application 2020 & 2033
- Table 14: United States Construction Portable Generators Market Volume (K Unit) Forecast, by Application 2020 & 2033
- Table 15: Canada Construction Portable Generators Market Revenue (Million) Forecast, by Application 2020 & 2033
- Table 16: Canada Construction Portable Generators Market Volume (K Unit) Forecast, by Application 2020 & 2033
- Table 17: Rest of North America Construction Portable Generators Market Revenue (Million) Forecast, by Application 2020 & 2033
- Table 18: Rest of North America Construction Portable Generators Market Volume (K Unit) Forecast, by Application 2020 & 2033
- Table 19: Global Construction Portable Generators Market Revenue Million Forecast, by Power Rating 2020 & 2033
- Table 20: Global Construction Portable Generators Market Volume K Unit Forecast, by Power Rating 2020 & 2033
- Table 21: Global Construction Portable Generators Market Revenue Million Forecast, by Fuel Type 2020 & 2033
- Table 22: Global Construction Portable Generators Market Volume K Unit Forecast, by Fuel Type 2020 & 2033
- Table 23: Global Construction Portable Generators Market Revenue Million Forecast, by Country 2020 & 2033
- Table 24: Global Construction Portable Generators Market Volume K Unit Forecast, by Country 2020 & 2033
- Table 25: Germany Construction Portable Generators Market Revenue (Million) Forecast, by Application 2020 & 2033
- Table 26: Germany Construction Portable Generators Market Volume (K Unit) Forecast, by Application 2020 & 2033
- Table 27: France Construction Portable Generators Market Revenue (Million) Forecast, by Application 2020 & 2033
- Table 28: France Construction Portable Generators Market Volume (K Unit) Forecast, by Application 2020 & 2033
- Table 29: United Kingdom Construction Portable Generators Market Revenue (Million) Forecast, by Application 2020 & 2033
- Table 30: United Kingdom Construction Portable Generators Market Volume (K Unit) Forecast, by Application 2020 & 2033
- Table 31: Spain Construction Portable Generators Market Revenue (Million) Forecast, by Application 2020 & 2033
- Table 32: Spain Construction Portable Generators Market Volume (K Unit) Forecast, by Application 2020 & 2033
- Table 33: NORDIC Construction Portable Generators Market Revenue (Million) Forecast, by Application 2020 & 2033
- Table 34: NORDIC Construction Portable Generators Market Volume (K Unit) Forecast, by Application 2020 & 2033
- Table 35: Turkey Construction Portable Generators Market Revenue (Million) Forecast, by Application 2020 & 2033
- Table 36: Turkey Construction Portable Generators Market Volume (K Unit) Forecast, by Application 2020 & 2033
- Table 37: Russia Construction Portable Generators Market Revenue (Million) Forecast, by Application 2020 & 2033
- Table 38: Russia Construction Portable Generators Market Volume (K Unit) Forecast, by Application 2020 & 2033
- Table 39: Rest of Europe Construction Portable Generators Market Revenue (Million) Forecast, by Application 2020 & 2033
- Table 40: Rest of Europe Construction Portable Generators Market Volume (K Unit) Forecast, by Application 2020 & 2033
- Table 41: Global Construction Portable Generators Market Revenue Million Forecast, by Power Rating 2020 & 2033
- Table 42: Global Construction Portable Generators Market Volume K Unit Forecast, by Power Rating 2020 & 2033
- Table 43: Global Construction Portable Generators Market Revenue Million Forecast, by Fuel Type 2020 & 2033
- Table 44: Global Construction Portable Generators Market Volume K Unit Forecast, by Fuel Type 2020 & 2033
- Table 45: Global Construction Portable Generators Market Revenue Million Forecast, by Country 2020 & 2033
- Table 46: Global Construction Portable Generators Market Volume K Unit Forecast, by Country 2020 & 2033
- Table 47: China Construction Portable Generators Market Revenue (Million) Forecast, by Application 2020 & 2033
- Table 48: China Construction Portable Generators Market Volume (K Unit) Forecast, by Application 2020 & 2033
- Table 49: India Construction Portable Generators Market Revenue (Million) Forecast, by Application 2020 & 2033
- Table 50: India Construction Portable Generators Market Volume (K Unit) Forecast, by Application 2020 & 2033
- Table 51: Japan Construction Portable Generators Market Revenue (Million) Forecast, by Application 2020 & 2033
- Table 52: Japan Construction Portable Generators Market Volume (K Unit) Forecast, by Application 2020 & 2033
- Table 53: South Korea Construction Portable Generators Market Revenue (Million) Forecast, by Application 2020 & 2033
- Table 54: South Korea Construction Portable Generators Market Volume (K Unit) Forecast, by Application 2020 & 2033
- Table 55: Malaysia Construction Portable Generators Market Revenue (Million) Forecast, by Application 2020 & 2033
- Table 56: Malaysia Construction Portable Generators Market Volume (K Unit) Forecast, by Application 2020 & 2033
- Table 57: Thailand Construction Portable Generators Market Revenue (Million) Forecast, by Application 2020 & 2033
- Table 58: Thailand Construction Portable Generators Market Volume (K Unit) Forecast, by Application 2020 & 2033
- Table 59: Indonesia Construction Portable Generators Market Revenue (Million) Forecast, by Application 2020 & 2033
- Table 60: Indonesia Construction Portable Generators Market Volume (K Unit) Forecast, by Application 2020 & 2033
- Table 61: Vietnam Construction Portable Generators Market Revenue (Million) Forecast, by Application 2020 & 2033
- Table 62: Vietnam Construction Portable Generators Market Volume (K Unit) Forecast, by Application 2020 & 2033
- Table 63: Rest of Asia Pacific Construction Portable Generators Market Revenue (Million) Forecast, by Application 2020 & 2033
- Table 64: Rest of Asia Pacific Construction Portable Generators Market Volume (K Unit) Forecast, by Application 2020 & 2033
- Table 65: Global Construction Portable Generators Market Revenue Million Forecast, by Power Rating 2020 & 2033
- Table 66: Global Construction Portable Generators Market Volume K Unit Forecast, by Power Rating 2020 & 2033
- Table 67: Global Construction Portable Generators Market Revenue Million Forecast, by Fuel Type 2020 & 2033
- Table 68: Global Construction Portable Generators Market Volume K Unit Forecast, by Fuel Type 2020 & 2033
- Table 69: Global Construction Portable Generators Market Revenue Million Forecast, by Country 2020 & 2033
- Table 70: Global Construction Portable Generators Market Volume K Unit Forecast, by Country 2020 & 2033
- Table 71: Brazil Construction Portable Generators Market Revenue (Million) Forecast, by Application 2020 & 2033
- Table 72: Brazil Construction Portable Generators Market Volume (K Unit) Forecast, by Application 2020 & 2033
- Table 73: Argentina Construction Portable Generators Market Revenue (Million) Forecast, by Application 2020 & 2033
- Table 74: Argentina Construction Portable Generators Market Volume (K Unit) Forecast, by Application 2020 & 2033
- Table 75: Colombia Construction Portable Generators Market Revenue (Million) Forecast, by Application 2020 & 2033
- Table 76: Colombia Construction Portable Generators Market Volume (K Unit) Forecast, by Application 2020 & 2033
- Table 77: Rest of South America Construction Portable Generators Market Revenue (Million) Forecast, by Application 2020 & 2033
- Table 78: Rest of South America Construction Portable Generators Market Volume (K Unit) Forecast, by Application 2020 & 2033
- Table 79: Global Construction Portable Generators Market Revenue Million Forecast, by Power Rating 2020 & 2033
- Table 80: Global Construction Portable Generators Market Volume K Unit Forecast, by Power Rating 2020 & 2033
- Table 81: Global Construction Portable Generators Market Revenue Million Forecast, by Fuel Type 2020 & 2033
- Table 82: Global Construction Portable Generators Market Volume K Unit Forecast, by Fuel Type 2020 & 2033
- Table 83: Global Construction Portable Generators Market Revenue Million Forecast, by Country 2020 & 2033
- Table 84: Global Construction Portable Generators Market Volume K Unit Forecast, by Country 2020 & 2033
- Table 85: Saudi Arabia Construction Portable Generators Market Revenue (Million) Forecast, by Application 2020 & 2033
- Table 86: Saudi Arabia Construction Portable Generators Market Volume (K Unit) Forecast, by Application 2020 & 2033
- Table 87: United Arab Emirates Construction Portable Generators Market Revenue (Million) Forecast, by Application 2020 & 2033
- Table 88: United Arab Emirates Construction Portable Generators Market Volume (K Unit) Forecast, by Application 2020 & 2033
- Table 89: South Africa Construction Portable Generators Market Revenue (Million) Forecast, by Application 2020 & 2033
- Table 90: South Africa Construction Portable Generators Market Volume (K Unit) Forecast, by Application 2020 & 2033
- Table 91: Egypt Construction Portable Generators Market Revenue (Million) Forecast, by Application 2020 & 2033
- Table 92: Egypt Construction Portable Generators Market Volume (K Unit) Forecast, by Application 2020 & 2033
- Table 93: Nigeria Construction Portable Generators Market Revenue (Million) Forecast, by Application 2020 & 2033
- Table 94: Nigeria Construction Portable Generators Market Volume (K Unit) Forecast, by Application 2020 & 2033
- Table 95: Qatar Construction Portable Generators Market Revenue (Million) Forecast, by Application 2020 & 2033
- Table 96: Qatar Construction Portable Generators Market Volume (K Unit) Forecast, by Application 2020 & 2033
- Table 97: Rest of Middle East and Africa Construction Portable Generators Market Revenue (Million) Forecast, by Application 2020 & 2033
- Table 98: Rest of Middle East and Africa Construction Portable Generators Market Volume (K Unit) Forecast, by Application 2020 & 2033
Frequently Asked Questions
1. What is the projected Compound Annual Growth Rate (CAGR) of the Construction Portable Generators Market?
The projected CAGR is approximately 5.50%.
2. Which companies are prominent players in the Construction Portable Generators Market?
Key companies in the market include Briggs & Stratton Corporation, Atlas Copco AB, Yamaha Motor Co Ltd *List Not Exhaustive 6 4 Market Ranking/Share (%) Analysi, Eaton Corporation PLC, Caterpillar Inc, Honda Siel Power Products Ltd, Kohler Power Systems, Wacker Neuson SE, Generac Holdings Inc.
3. What are the main segments of the Construction Portable Generators Market?
The market segments include Power Rating, Fuel Type.
4. Can you provide details about the market size?
The market size is estimated to be USD 4.90 Million as of 2022.
5. What are some drivers contributing to market growth?
4.; Increasing Demand for portable power source4.; Increasing investments in Construction Sector across the Globe.
6. What are the notable trends driving market growth?
Above 10 KW to be a Significant Market Segment.
7. Are there any restraints impacting market growth?
4.; Increasing Demand for Battery Storage Systems and other Cleaner Sources of Standby Power.
8. Can you provide examples of recent developments in the market?
N/A
9. What pricing options are available for accessing the report?
Pricing options include single-user, multi-user, and enterprise licenses priced at USD 4750, USD 5250, and USD 8750 respectively.
10. Is the market size provided in terms of value or volume?
The market size is provided in terms of value, measured in Million and volume, measured in K Unit.
11. Are there any specific market keywords associated with the report?
Yes, the market keyword associated with the report is "Construction Portable Generators Market," which aids in identifying and referencing the specific market segment covered.
12. How do I determine which pricing option suits my needs best?
The pricing options vary based on user requirements and access needs. Individual users may opt for single-user licenses, while businesses requiring broader access may choose multi-user or enterprise licenses for cost-effective access to the report.
13. Are there any additional resources or data provided in the Construction Portable Generators Market report?
While the report offers comprehensive insights, it's advisable to review the specific contents or supplementary materials provided to ascertain if additional resources or data are available.
14. How can I stay updated on further developments or reports in the Construction Portable Generators Market?
To stay informed about further developments, trends, and reports in the Construction Portable Generators Market, consider subscribing to industry newsletters, following relevant companies and organizations, or regularly checking reputable industry news sources and publications.
Methodology
Step 1 - Identification of Relevant Samples Size from Population Database


Step 2 - Approaches for Defining Global Market Size (Value, Volume* & Price*)

Note*: In applicable scenarios
Step 3 - Data Sources
Primary Research
- Web Analytics
- Survey Reports
- Research Institute
- Latest Research Reports
- Opinion Leaders
Secondary Research
- Annual Reports
- White Paper
- Latest Press Release
- Industry Association
- Paid Database
- Investor Presentations

Step 4 - Data Triangulation
Involves using different sources of information in order to increase the validity of a study
These sources are likely to be stakeholders in a program - participants, other researchers, program staff, other community members, and so on.
Then we put all data in single framework & apply various statistical tools to find out the dynamic on the market.
During the analysis stage, feedback from the stakeholder groups would be compared to determine areas of agreement as well as areas of divergence