

Key Insights
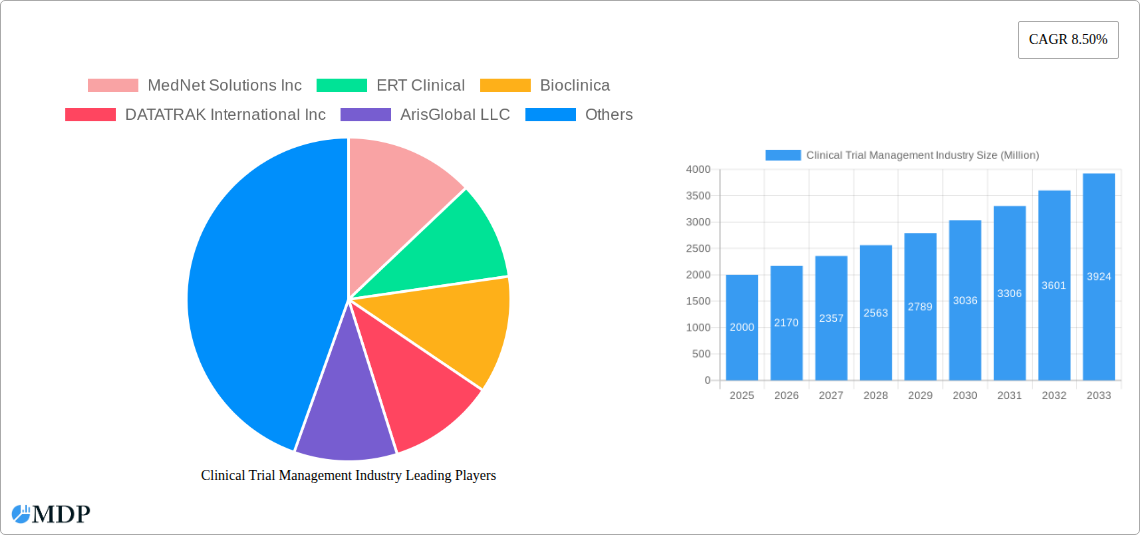
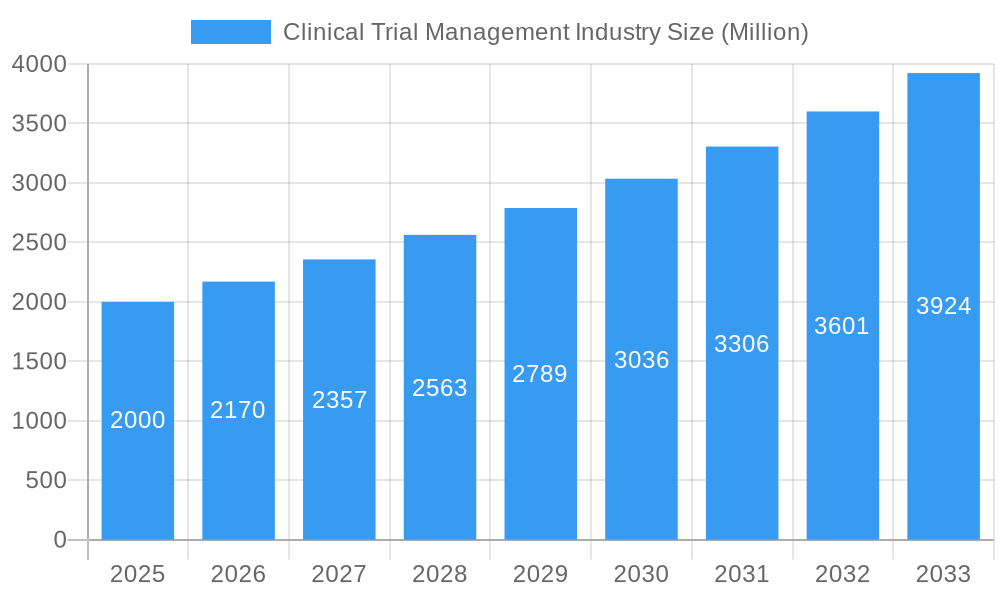
The Clinical Trial Management (CTM) market, projected to reach $21 billion by 2025, is set for substantial expansion at a CAGR of 5.9% from 2025 to 2033. This growth is propelled by the increasing complexity of clinical trials, heightened demand for efficient data management, and stringent regulatory compliance requirements. Global growth in clinical trial volume, particularly in the Asia Pacific region, alongside technological advancements like cloud-based platforms and AI, are key drivers. Pharmaceutical companies and Contract Research Organizations (CROs) are primary adopters, leveraging CTM for process optimization, data integrity, and cost reduction. While on-premise solutions currently dominate, cloud adoption is accelerating due to scalability and cost-effectiveness. Software components are expected to grow faster, driven by advanced analytics needs.
Clinical Trial Management Industry Market Size (In Billion)
Key challenges include high implementation and maintenance costs, data security and privacy concerns, and system integration complexities, particularly for smaller organizations. However, continuous technological investment and evolving regulatory landscapes are expected to sustain market growth across North America, Europe, and Asia Pacific. The competitive arena features established players such as Veeva Systems, Oracle Corporation, and Medidata Solutions (Dassault Systèmes), alongside specialized CTM providers.
Clinical Trial Management Industry Company Market Share
This report offers an in-depth analysis of the CTM industry, providing strategic insights for stakeholders. The study covers the period 2019-2033, with a base year of 2025 and a forecast period of 2025-2033.
Clinical Trial Management Industry Market Dynamics & Concentration
The Clinical Trial Management market is experiencing robust growth, driven by factors such as the increasing number of clinical trials globally, rising demand for efficient data management solutions, and the growing adoption of cloud-based technologies. Market concentration is relatively high, with a few major players controlling a significant market share. The top five companies—Veeva Systems, Medidata Solutions (Dassault Systèmes), Oracle Corporation, ERT Clinical, and ArisGlobal LLC— collectively hold an estimated xx% market share in 2025. However, the market also features several smaller, specialized players focusing on niche segments.
- Innovation Drivers: Advancements in AI, machine learning, and big data analytics are significantly impacting CTM processes, enhancing efficiency and reducing costs.
- Regulatory Frameworks: Stringent regulatory requirements and compliance standards are driving the demand for robust CTM solutions, particularly concerning data security and privacy.
- Product Substitutes: The emergence of alternative solutions, such as open-source platforms and specialized software applications, is increasing competition.
- End-User Trends: The increasing adoption of cloud-based solutions by pharmaceutical companies and Contract Research Organizations (CROs) is shaping market growth.
- M&A Activities: The industry has witnessed a surge in mergers and acquisitions (M&A) activities in recent years, indicating a trend toward consolidation and expansion. The number of M&A deals is estimated to be approximately xx in the historical period (2019-2024), with a further xx predicted during the forecast period.
Clinical Trial Management Industry Industry Trends & Analysis
The CTM industry demonstrates significant growth potential, propelled by several key trends. The rising prevalence of chronic diseases and the increasing demand for new therapies are fueling the growth of clinical trials globally. Technological disruptions, particularly in the realms of AI and cloud computing, are revolutionizing data management, analysis, and workflow automation. This is leading to enhanced efficiency, reduced costs, and improved decision-making in clinical trials. Market penetration of cloud-based solutions is expected to exceed xx% by 2033, driven by their scalability, accessibility, and cost-effectiveness. The increasing adoption of decentralized clinical trials (DCTs) is also contributing to significant market growth. Consumer preferences are shifting toward more patient-centric approaches, with remote monitoring and telehealth technologies becoming increasingly integrated into clinical trials. The competitive landscape is marked by both established players and emerging companies, resulting in continuous innovation and strategic partnerships.
Leading Markets & Segments in Clinical Trial Management Industry
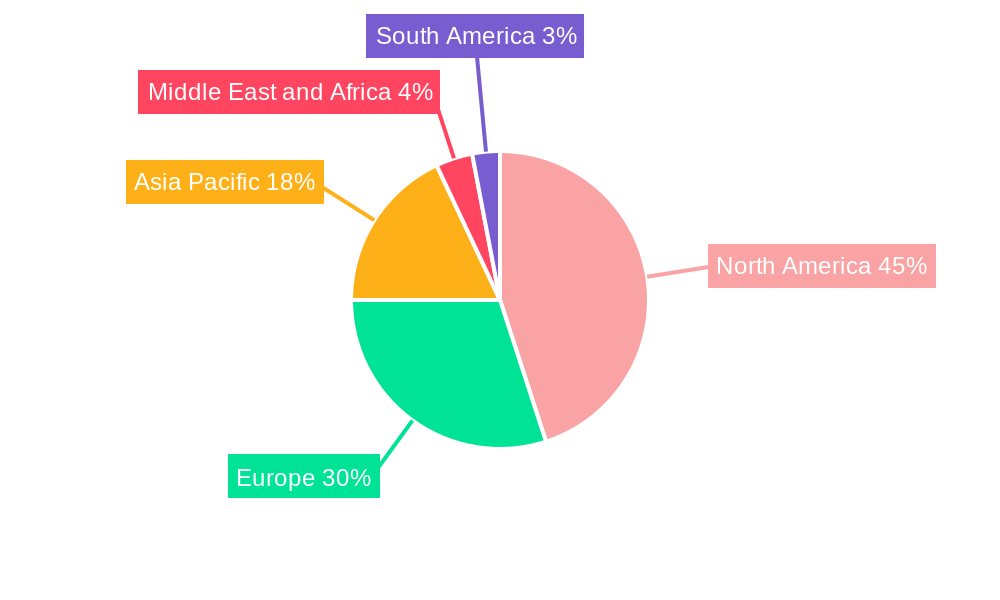
The North American region dominates the global CTM market, driven by factors including robust funding for research and development, a high density of pharmaceutical and biotechnology companies, and a well-established regulatory framework. The cloud-based delivery mode is witnessing rapid adoption, surpassing the on-premise model in terms of market share. Within components, the software segment holds the largest share, followed by services. The pharmaceutical industry is the largest end-user segment, followed by CROs.
- Key Drivers for North American Dominance:
- Strong pharmaceutical and biotech industry presence.
- High levels of venture capital investment in healthcare technology.
- Favorable regulatory environment supporting clinical research.
- Advanced technological infrastructure.
- Cloud-Based Delivery Mode Dominance:
- Enhanced scalability and flexibility.
- Reduced infrastructure costs for end-users.
- Increased accessibility and remote collaboration.
Clinical Trial Management Industry Product Developments
Recent product innovations focus on enhancing data integration, automation, and regulatory compliance. Companies are integrating AI and machine learning capabilities into their platforms to improve data analysis, patient recruitment, and trial management efficiency. These developments aim to address the challenges of managing large and complex datasets in clinical trials, offering significant competitive advantages to companies delivering solutions that align with these emerging trends. The emphasis on user-friendly interfaces and improved data visualization is also prominent.
Key Drivers of Clinical Trial Management Growth
The CTM market’s growth is fueled by several key factors: The increasing complexity and cost of clinical trials necessitates efficient management solutions. Technological advancements like AI and machine learning are optimizing trial processes. Stringent regulatory requirements drive demand for compliant solutions. Government initiatives to support clinical research and development further contribute to this growth. Growing adoption of cloud-based solutions ensures scalability and accessibility.
Challenges in the Clinical Trial Management Industry Market
The CTM industry faces several challenges, including: stringent regulatory compliance costs, the need for skilled personnel to implement and maintain these complex systems, data security and privacy concerns, competition from both large established players and new disruptive technologies, and integrating legacy systems with new technologies. These hurdles contribute to significant implementation and operational costs, impacting market growth. The average implementation cost for a major CTM system is approximately xx Million.
Emerging Opportunities in Clinical Trial Management Industry
The CTM market presents numerous opportunities, especially with the rise of decentralized clinical trials (DCTs). Strategic partnerships between technology providers and pharmaceutical/CRO companies are driving innovation and market expansion. The integration of AI and machine learning offers substantial potential for streamlining workflows and enhancing trial efficiency. The global reach of cloud-based platforms is expanding market accessibility. Furthermore, the increasing focus on patient-centric trials presents numerous opportunities for improved patient experience and data quality.
Leading Players in the Clinical Trial Management Industry Sector
Key Milestones in Clinical Trial Management Industry Industry
- March 2023: Assentia launched GrantPay and GrantPact, SaaS-based applications for clinical trial contract negotiation and payment services, improving efficiency and transparency in financial processes.
- February 2023: Vial partnered with Egnyte to integrate Egnyte's eTMF, enhancing eTMF management, compliance, and audit readiness for its clients, boosting their competitive advantage in eTMF solutions.
Strategic Outlook for Clinical Trial Management Market
The future of the CTM market is bright, with continued growth expected across all major segments. Strategic partnerships, technological innovation, and regulatory changes will shape the market landscape. Companies focusing on AI-powered solutions, cloud-based platforms, and decentralized trial technologies are poised for significant growth. The market's expansion into emerging economies also presents substantial opportunities for future development and market penetration.
Clinical Trial Management Industry Segmentation
-
1. Delivery Mode
- 1.1. On-premise
- 1.2. Cloud-based
-
2. Component
- 2.1. Software
- 2.2. Services
-
3. End User
- 3.1. Pharmaceuticals
- 3.2. Contract Research Organization
- 3.3. Other End Users
Clinical Trial Management Industry Segmentation By Geography
-
1. North America
- 1.1. United States
- 1.2. Canada
- 1.3. Mexico
-
2. Europe
- 2.1. Germany
- 2.2. United Kingdom
- 2.3. France
- 2.4. Italy
- 2.5. Spain
- 2.6. Rest of Europe
-
3. Asia Pacific
- 3.1. China
- 3.2. Japan
- 3.3. India
- 3.4. Australia
- 3.5. South Korea
- 3.6. Rest of Asia Pacific
-
4. Middle East and Africa
- 4.1. GCC
- 4.2. South Africa
- 4.3. Rest of Middle East and Africa
-
5. South America
- 5.1. Brazil
- 5.2. Argentina
- 5.3. Rest of South America
Clinical Trial Management Industry Regional Market Share
Geographic Coverage of Clinical Trial Management Industry
Clinical Trial Management Industry REPORT HIGHLIGHTS
| Aspects | Details |
|---|---|
| Study Period | 2020-2034 |
| Base Year | 2025 |
| Estimated Year | 2026 |
| Forecast Period | 2026-2034 |
| Historical Period | 2020-2025 |
| Growth Rate | CAGR of 5.9% from 2020-2034 |
| Segmentation |
|
Table of Contents
- 1. Introduction
- 1.1. Research Scope
- 1.2. Market Segmentation
- 1.3. Research Methodology
- 1.4. Definitions and Assumptions
- 2. Executive Summary
- 2.1. Introduction
- 3. Market Dynamics
- 3.1. Introduction
- 3.2. Market Drivers
- 3.2.1. Growing Number of Clinical Trials Due to Rising Chronic Diseases and Lifestyle-related Disorders; Rise in Outsourcing of Clinical Trials and Implementation by Contract Research Organizations
- 3.3. Market Restrains
- 3.3.1. Data Security Issues; High Cost Associated With Clinical Trial Management Systems
- 3.4. Market Trends
- 3.4.1. The Pharmaceutical Segment is Expected to Grow Over the Forecast Period
- 4. Market Factor Analysis
- 4.1. Porters Five Forces
- 4.2. Supply/Value Chain
- 4.3. PESTEL analysis
- 4.4. Market Entropy
- 4.5. Patent/Trademark Analysis
- 5. Global Clinical Trial Management Industry Analysis, Insights and Forecast, 2020-2032
- 5.1. Market Analysis, Insights and Forecast - by Delivery Mode
- 5.1.1. On-premise
- 5.1.2. Cloud-based
- 5.2. Market Analysis, Insights and Forecast - by Component
- 5.2.1. Software
- 5.2.2. Services
- 5.3. Market Analysis, Insights and Forecast - by End User
- 5.3.1. Pharmaceuticals
- 5.3.2. Contract Research Organization
- 5.3.3. Other End Users
- 5.4. Market Analysis, Insights and Forecast - by Region
- 5.4.1. North America
- 5.4.2. Europe
- 5.4.3. Asia Pacific
- 5.4.4. Middle East and Africa
- 5.4.5. South America
- 5.1. Market Analysis, Insights and Forecast - by Delivery Mode
- 6. North America Clinical Trial Management Industry Analysis, Insights and Forecast, 2020-2032
- 6.1. Market Analysis, Insights and Forecast - by Delivery Mode
- 6.1.1. On-premise
- 6.1.2. Cloud-based
- 6.2. Market Analysis, Insights and Forecast - by Component
- 6.2.1. Software
- 6.2.2. Services
- 6.3. Market Analysis, Insights and Forecast - by End User
- 6.3.1. Pharmaceuticals
- 6.3.2. Contract Research Organization
- 6.3.3. Other End Users
- 6.1. Market Analysis, Insights and Forecast - by Delivery Mode
- 7. Europe Clinical Trial Management Industry Analysis, Insights and Forecast, 2020-2032
- 7.1. Market Analysis, Insights and Forecast - by Delivery Mode
- 7.1.1. On-premise
- 7.1.2. Cloud-based
- 7.2. Market Analysis, Insights and Forecast - by Component
- 7.2.1. Software
- 7.2.2. Services
- 7.3. Market Analysis, Insights and Forecast - by End User
- 7.3.1. Pharmaceuticals
- 7.3.2. Contract Research Organization
- 7.3.3. Other End Users
- 7.1. Market Analysis, Insights and Forecast - by Delivery Mode
- 8. Asia Pacific Clinical Trial Management Industry Analysis, Insights and Forecast, 2020-2032
- 8.1. Market Analysis, Insights and Forecast - by Delivery Mode
- 8.1.1. On-premise
- 8.1.2. Cloud-based
- 8.2. Market Analysis, Insights and Forecast - by Component
- 8.2.1. Software
- 8.2.2. Services
- 8.3. Market Analysis, Insights and Forecast - by End User
- 8.3.1. Pharmaceuticals
- 8.3.2. Contract Research Organization
- 8.3.3. Other End Users
- 8.1. Market Analysis, Insights and Forecast - by Delivery Mode
- 9. Middle East and Africa Clinical Trial Management Industry Analysis, Insights and Forecast, 2020-2032
- 9.1. Market Analysis, Insights and Forecast - by Delivery Mode
- 9.1.1. On-premise
- 9.1.2. Cloud-based
- 9.2. Market Analysis, Insights and Forecast - by Component
- 9.2.1. Software
- 9.2.2. Services
- 9.3. Market Analysis, Insights and Forecast - by End User
- 9.3.1. Pharmaceuticals
- 9.3.2. Contract Research Organization
- 9.3.3. Other End Users
- 9.1. Market Analysis, Insights and Forecast - by Delivery Mode
- 10. South America Clinical Trial Management Industry Analysis, Insights and Forecast, 2020-2032
- 10.1. Market Analysis, Insights and Forecast - by Delivery Mode
- 10.1.1. On-premise
- 10.1.2. Cloud-based
- 10.2. Market Analysis, Insights and Forecast - by Component
- 10.2.1. Software
- 10.2.2. Services
- 10.3. Market Analysis, Insights and Forecast - by End User
- 10.3.1. Pharmaceuticals
- 10.3.2. Contract Research Organization
- 10.3.3. Other End Users
- 10.1. Market Analysis, Insights and Forecast - by Delivery Mode
- 11. Competitive Analysis
- 11.1. Global Market Share Analysis 2025
- 11.2. Company Profiles
- 11.2.1 MedNet Solutions Inc
- 11.2.1.1. Overview
- 11.2.1.2. Products
- 11.2.1.3. SWOT Analysis
- 11.2.1.4. Recent Developments
- 11.2.1.5. Financials (Based on Availability)
- 11.2.2 ERT Clinical
- 11.2.2.1. Overview
- 11.2.2.2. Products
- 11.2.2.3. SWOT Analysis
- 11.2.2.4. Recent Developments
- 11.2.2.5. Financials (Based on Availability)
- 11.2.3 Bioclinica
- 11.2.3.1. Overview
- 11.2.3.2. Products
- 11.2.3.3. SWOT Analysis
- 11.2.3.4. Recent Developments
- 11.2.3.5. Financials (Based on Availability)
- 11.2.4 DATATRAK International Inc
- 11.2.4.1. Overview
- 11.2.4.2. Products
- 11.2.4.3. SWOT Analysis
- 11.2.4.4. Recent Developments
- 11.2.4.5. Financials (Based on Availability)
- 11.2.5 ArisGlobal LLC
- 11.2.5.1. Overview
- 11.2.5.2. Products
- 11.2.5.3. SWOT Analysis
- 11.2.5.4. Recent Developments
- 11.2.5.5. Financials (Based on Availability)
- 11.2.6 RealTime Software Solutions LLC
- 11.2.6.1. Overview
- 11.2.6.2. Products
- 11.2.6.3. SWOT Analysis
- 11.2.6.4. Recent Developments
- 11.2.6.5. Financials (Based on Availability)
- 11.2.7 Advarra
- 11.2.7.1. Overview
- 11.2.7.2. Products
- 11.2.7.3. SWOT Analysis
- 11.2.7.4. Recent Developments
- 11.2.7.5. Financials (Based on Availability)
- 11.2.8 DZS Clinical Services
- 11.2.8.1. Overview
- 11.2.8.2. Products
- 11.2.8.3. SWOT Analysis
- 11.2.8.4. Recent Developments
- 11.2.8.5. Financials (Based on Availability)
- 11.2.9 Oracle Corporation
- 11.2.9.1. Overview
- 11.2.9.2. Products
- 11.2.9.3. SWOT Analysis
- 11.2.9.4. Recent Developments
- 11.2.9.5. Financials (Based on Availability)
- 11.2.10 Veeva Systems
- 11.2.10.1. Overview
- 11.2.10.2. Products
- 11.2.10.3. SWOT Analysis
- 11.2.10.4. Recent Developments
- 11.2.10.5. Financials (Based on Availability)
- 11.2.11 Calyx
- 11.2.11.1. Overview
- 11.2.11.2. Products
- 11.2.11.3. SWOT Analysis
- 11.2.11.4. Recent Developments
- 11.2.11.5. Financials (Based on Availability)
- 11.2.12 Dassault Systèmes (Medidata Solutions Inc )
- 11.2.12.1. Overview
- 11.2.12.2. Products
- 11.2.12.3. SWOT Analysis
- 11.2.12.4. Recent Developments
- 11.2.12.5. Financials (Based on Availability)
- 11.2.13 IBM
- 11.2.13.1. Overview
- 11.2.13.2. Products
- 11.2.13.3. SWOT Analysis
- 11.2.13.4. Recent Developments
- 11.2.13.5. Financials (Based on Availability)
- 11.2.1 MedNet Solutions Inc
List of Figures
- Figure 1: Global Clinical Trial Management Industry Revenue Breakdown (billion, %) by Region 2025 & 2033
- Figure 2: Global Clinical Trial Management Industry Volume Breakdown (K Unit, %) by Region 2025 & 2033
- Figure 3: North America Clinical Trial Management Industry Revenue (billion), by Delivery Mode 2025 & 2033
- Figure 4: North America Clinical Trial Management Industry Volume (K Unit), by Delivery Mode 2025 & 2033
- Figure 5: North America Clinical Trial Management Industry Revenue Share (%), by Delivery Mode 2025 & 2033
- Figure 6: North America Clinical Trial Management Industry Volume Share (%), by Delivery Mode 2025 & 2033
- Figure 7: North America Clinical Trial Management Industry Revenue (billion), by Component 2025 & 2033
- Figure 8: North America Clinical Trial Management Industry Volume (K Unit), by Component 2025 & 2033
- Figure 9: North America Clinical Trial Management Industry Revenue Share (%), by Component 2025 & 2033
- Figure 10: North America Clinical Trial Management Industry Volume Share (%), by Component 2025 & 2033
- Figure 11: North America Clinical Trial Management Industry Revenue (billion), by End User 2025 & 2033
- Figure 12: North America Clinical Trial Management Industry Volume (K Unit), by End User 2025 & 2033
- Figure 13: North America Clinical Trial Management Industry Revenue Share (%), by End User 2025 & 2033
- Figure 14: North America Clinical Trial Management Industry Volume Share (%), by End User 2025 & 2033
- Figure 15: North America Clinical Trial Management Industry Revenue (billion), by Country 2025 & 2033
- Figure 16: North America Clinical Trial Management Industry Volume (K Unit), by Country 2025 & 2033
- Figure 17: North America Clinical Trial Management Industry Revenue Share (%), by Country 2025 & 2033
- Figure 18: North America Clinical Trial Management Industry Volume Share (%), by Country 2025 & 2033
- Figure 19: Europe Clinical Trial Management Industry Revenue (billion), by Delivery Mode 2025 & 2033
- Figure 20: Europe Clinical Trial Management Industry Volume (K Unit), by Delivery Mode 2025 & 2033
- Figure 21: Europe Clinical Trial Management Industry Revenue Share (%), by Delivery Mode 2025 & 2033
- Figure 22: Europe Clinical Trial Management Industry Volume Share (%), by Delivery Mode 2025 & 2033
- Figure 23: Europe Clinical Trial Management Industry Revenue (billion), by Component 2025 & 2033
- Figure 24: Europe Clinical Trial Management Industry Volume (K Unit), by Component 2025 & 2033
- Figure 25: Europe Clinical Trial Management Industry Revenue Share (%), by Component 2025 & 2033
- Figure 26: Europe Clinical Trial Management Industry Volume Share (%), by Component 2025 & 2033
- Figure 27: Europe Clinical Trial Management Industry Revenue (billion), by End User 2025 & 2033
- Figure 28: Europe Clinical Trial Management Industry Volume (K Unit), by End User 2025 & 2033
- Figure 29: Europe Clinical Trial Management Industry Revenue Share (%), by End User 2025 & 2033
- Figure 30: Europe Clinical Trial Management Industry Volume Share (%), by End User 2025 & 2033
- Figure 31: Europe Clinical Trial Management Industry Revenue (billion), by Country 2025 & 2033
- Figure 32: Europe Clinical Trial Management Industry Volume (K Unit), by Country 2025 & 2033
- Figure 33: Europe Clinical Trial Management Industry Revenue Share (%), by Country 2025 & 2033
- Figure 34: Europe Clinical Trial Management Industry Volume Share (%), by Country 2025 & 2033
- Figure 35: Asia Pacific Clinical Trial Management Industry Revenue (billion), by Delivery Mode 2025 & 2033
- Figure 36: Asia Pacific Clinical Trial Management Industry Volume (K Unit), by Delivery Mode 2025 & 2033
- Figure 37: Asia Pacific Clinical Trial Management Industry Revenue Share (%), by Delivery Mode 2025 & 2033
- Figure 38: Asia Pacific Clinical Trial Management Industry Volume Share (%), by Delivery Mode 2025 & 2033
- Figure 39: Asia Pacific Clinical Trial Management Industry Revenue (billion), by Component 2025 & 2033
- Figure 40: Asia Pacific Clinical Trial Management Industry Volume (K Unit), by Component 2025 & 2033
- Figure 41: Asia Pacific Clinical Trial Management Industry Revenue Share (%), by Component 2025 & 2033
- Figure 42: Asia Pacific Clinical Trial Management Industry Volume Share (%), by Component 2025 & 2033
- Figure 43: Asia Pacific Clinical Trial Management Industry Revenue (billion), by End User 2025 & 2033
- Figure 44: Asia Pacific Clinical Trial Management Industry Volume (K Unit), by End User 2025 & 2033
- Figure 45: Asia Pacific Clinical Trial Management Industry Revenue Share (%), by End User 2025 & 2033
- Figure 46: Asia Pacific Clinical Trial Management Industry Volume Share (%), by End User 2025 & 2033
- Figure 47: Asia Pacific Clinical Trial Management Industry Revenue (billion), by Country 2025 & 2033
- Figure 48: Asia Pacific Clinical Trial Management Industry Volume (K Unit), by Country 2025 & 2033
- Figure 49: Asia Pacific Clinical Trial Management Industry Revenue Share (%), by Country 2025 & 2033
- Figure 50: Asia Pacific Clinical Trial Management Industry Volume Share (%), by Country 2025 & 2033
- Figure 51: Middle East and Africa Clinical Trial Management Industry Revenue (billion), by Delivery Mode 2025 & 2033
- Figure 52: Middle East and Africa Clinical Trial Management Industry Volume (K Unit), by Delivery Mode 2025 & 2033
- Figure 53: Middle East and Africa Clinical Trial Management Industry Revenue Share (%), by Delivery Mode 2025 & 2033
- Figure 54: Middle East and Africa Clinical Trial Management Industry Volume Share (%), by Delivery Mode 2025 & 2033
- Figure 55: Middle East and Africa Clinical Trial Management Industry Revenue (billion), by Component 2025 & 2033
- Figure 56: Middle East and Africa Clinical Trial Management Industry Volume (K Unit), by Component 2025 & 2033
- Figure 57: Middle East and Africa Clinical Trial Management Industry Revenue Share (%), by Component 2025 & 2033
- Figure 58: Middle East and Africa Clinical Trial Management Industry Volume Share (%), by Component 2025 & 2033
- Figure 59: Middle East and Africa Clinical Trial Management Industry Revenue (billion), by End User 2025 & 2033
- Figure 60: Middle East and Africa Clinical Trial Management Industry Volume (K Unit), by End User 2025 & 2033
- Figure 61: Middle East and Africa Clinical Trial Management Industry Revenue Share (%), by End User 2025 & 2033
- Figure 62: Middle East and Africa Clinical Trial Management Industry Volume Share (%), by End User 2025 & 2033
- Figure 63: Middle East and Africa Clinical Trial Management Industry Revenue (billion), by Country 2025 & 2033
- Figure 64: Middle East and Africa Clinical Trial Management Industry Volume (K Unit), by Country 2025 & 2033
- Figure 65: Middle East and Africa Clinical Trial Management Industry Revenue Share (%), by Country 2025 & 2033
- Figure 66: Middle East and Africa Clinical Trial Management Industry Volume Share (%), by Country 2025 & 2033
- Figure 67: South America Clinical Trial Management Industry Revenue (billion), by Delivery Mode 2025 & 2033
- Figure 68: South America Clinical Trial Management Industry Volume (K Unit), by Delivery Mode 2025 & 2033
- Figure 69: South America Clinical Trial Management Industry Revenue Share (%), by Delivery Mode 2025 & 2033
- Figure 70: South America Clinical Trial Management Industry Volume Share (%), by Delivery Mode 2025 & 2033
- Figure 71: South America Clinical Trial Management Industry Revenue (billion), by Component 2025 & 2033
- Figure 72: South America Clinical Trial Management Industry Volume (K Unit), by Component 2025 & 2033
- Figure 73: South America Clinical Trial Management Industry Revenue Share (%), by Component 2025 & 2033
- Figure 74: South America Clinical Trial Management Industry Volume Share (%), by Component 2025 & 2033
- Figure 75: South America Clinical Trial Management Industry Revenue (billion), by End User 2025 & 2033
- Figure 76: South America Clinical Trial Management Industry Volume (K Unit), by End User 2025 & 2033
- Figure 77: South America Clinical Trial Management Industry Revenue Share (%), by End User 2025 & 2033
- Figure 78: South America Clinical Trial Management Industry Volume Share (%), by End User 2025 & 2033
- Figure 79: South America Clinical Trial Management Industry Revenue (billion), by Country 2025 & 2033
- Figure 80: South America Clinical Trial Management Industry Volume (K Unit), by Country 2025 & 2033
- Figure 81: South America Clinical Trial Management Industry Revenue Share (%), by Country 2025 & 2033
- Figure 82: South America Clinical Trial Management Industry Volume Share (%), by Country 2025 & 2033
List of Tables
- Table 1: Global Clinical Trial Management Industry Revenue billion Forecast, by Delivery Mode 2020 & 2033
- Table 2: Global Clinical Trial Management Industry Volume K Unit Forecast, by Delivery Mode 2020 & 2033
- Table 3: Global Clinical Trial Management Industry Revenue billion Forecast, by Component 2020 & 2033
- Table 4: Global Clinical Trial Management Industry Volume K Unit Forecast, by Component 2020 & 2033
- Table 5: Global Clinical Trial Management Industry Revenue billion Forecast, by End User 2020 & 2033
- Table 6: Global Clinical Trial Management Industry Volume K Unit Forecast, by End User 2020 & 2033
- Table 7: Global Clinical Trial Management Industry Revenue billion Forecast, by Region 2020 & 2033
- Table 8: Global Clinical Trial Management Industry Volume K Unit Forecast, by Region 2020 & 2033
- Table 9: Global Clinical Trial Management Industry Revenue billion Forecast, by Delivery Mode 2020 & 2033
- Table 10: Global Clinical Trial Management Industry Volume K Unit Forecast, by Delivery Mode 2020 & 2033
- Table 11: Global Clinical Trial Management Industry Revenue billion Forecast, by Component 2020 & 2033
- Table 12: Global Clinical Trial Management Industry Volume K Unit Forecast, by Component 2020 & 2033
- Table 13: Global Clinical Trial Management Industry Revenue billion Forecast, by End User 2020 & 2033
- Table 14: Global Clinical Trial Management Industry Volume K Unit Forecast, by End User 2020 & 2033
- Table 15: Global Clinical Trial Management Industry Revenue billion Forecast, by Country 2020 & 2033
- Table 16: Global Clinical Trial Management Industry Volume K Unit Forecast, by Country 2020 & 2033
- Table 17: United States Clinical Trial Management Industry Revenue (billion) Forecast, by Application 2020 & 2033
- Table 18: United States Clinical Trial Management Industry Volume (K Unit) Forecast, by Application 2020 & 2033
- Table 19: Canada Clinical Trial Management Industry Revenue (billion) Forecast, by Application 2020 & 2033
- Table 20: Canada Clinical Trial Management Industry Volume (K Unit) Forecast, by Application 2020 & 2033
- Table 21: Mexico Clinical Trial Management Industry Revenue (billion) Forecast, by Application 2020 & 2033
- Table 22: Mexico Clinical Trial Management Industry Volume (K Unit) Forecast, by Application 2020 & 2033
- Table 23: Global Clinical Trial Management Industry Revenue billion Forecast, by Delivery Mode 2020 & 2033
- Table 24: Global Clinical Trial Management Industry Volume K Unit Forecast, by Delivery Mode 2020 & 2033
- Table 25: Global Clinical Trial Management Industry Revenue billion Forecast, by Component 2020 & 2033
- Table 26: Global Clinical Trial Management Industry Volume K Unit Forecast, by Component 2020 & 2033
- Table 27: Global Clinical Trial Management Industry Revenue billion Forecast, by End User 2020 & 2033
- Table 28: Global Clinical Trial Management Industry Volume K Unit Forecast, by End User 2020 & 2033
- Table 29: Global Clinical Trial Management Industry Revenue billion Forecast, by Country 2020 & 2033
- Table 30: Global Clinical Trial Management Industry Volume K Unit Forecast, by Country 2020 & 2033
- Table 31: Germany Clinical Trial Management Industry Revenue (billion) Forecast, by Application 2020 & 2033
- Table 32: Germany Clinical Trial Management Industry Volume (K Unit) Forecast, by Application 2020 & 2033
- Table 33: United Kingdom Clinical Trial Management Industry Revenue (billion) Forecast, by Application 2020 & 2033
- Table 34: United Kingdom Clinical Trial Management Industry Volume (K Unit) Forecast, by Application 2020 & 2033
- Table 35: France Clinical Trial Management Industry Revenue (billion) Forecast, by Application 2020 & 2033
- Table 36: France Clinical Trial Management Industry Volume (K Unit) Forecast, by Application 2020 & 2033
- Table 37: Italy Clinical Trial Management Industry Revenue (billion) Forecast, by Application 2020 & 2033
- Table 38: Italy Clinical Trial Management Industry Volume (K Unit) Forecast, by Application 2020 & 2033
- Table 39: Spain Clinical Trial Management Industry Revenue (billion) Forecast, by Application 2020 & 2033
- Table 40: Spain Clinical Trial Management Industry Volume (K Unit) Forecast, by Application 2020 & 2033
- Table 41: Rest of Europe Clinical Trial Management Industry Revenue (billion) Forecast, by Application 2020 & 2033
- Table 42: Rest of Europe Clinical Trial Management Industry Volume (K Unit) Forecast, by Application 2020 & 2033
- Table 43: Global Clinical Trial Management Industry Revenue billion Forecast, by Delivery Mode 2020 & 2033
- Table 44: Global Clinical Trial Management Industry Volume K Unit Forecast, by Delivery Mode 2020 & 2033
- Table 45: Global Clinical Trial Management Industry Revenue billion Forecast, by Component 2020 & 2033
- Table 46: Global Clinical Trial Management Industry Volume K Unit Forecast, by Component 2020 & 2033
- Table 47: Global Clinical Trial Management Industry Revenue billion Forecast, by End User 2020 & 2033
- Table 48: Global Clinical Trial Management Industry Volume K Unit Forecast, by End User 2020 & 2033
- Table 49: Global Clinical Trial Management Industry Revenue billion Forecast, by Country 2020 & 2033
- Table 50: Global Clinical Trial Management Industry Volume K Unit Forecast, by Country 2020 & 2033
- Table 51: China Clinical Trial Management Industry Revenue (billion) Forecast, by Application 2020 & 2033
- Table 52: China Clinical Trial Management Industry Volume (K Unit) Forecast, by Application 2020 & 2033
- Table 53: Japan Clinical Trial Management Industry Revenue (billion) Forecast, by Application 2020 & 2033
- Table 54: Japan Clinical Trial Management Industry Volume (K Unit) Forecast, by Application 2020 & 2033
- Table 55: India Clinical Trial Management Industry Revenue (billion) Forecast, by Application 2020 & 2033
- Table 56: India Clinical Trial Management Industry Volume (K Unit) Forecast, by Application 2020 & 2033
- Table 57: Australia Clinical Trial Management Industry Revenue (billion) Forecast, by Application 2020 & 2033
- Table 58: Australia Clinical Trial Management Industry Volume (K Unit) Forecast, by Application 2020 & 2033
- Table 59: South Korea Clinical Trial Management Industry Revenue (billion) Forecast, by Application 2020 & 2033
- Table 60: South Korea Clinical Trial Management Industry Volume (K Unit) Forecast, by Application 2020 & 2033
- Table 61: Rest of Asia Pacific Clinical Trial Management Industry Revenue (billion) Forecast, by Application 2020 & 2033
- Table 62: Rest of Asia Pacific Clinical Trial Management Industry Volume (K Unit) Forecast, by Application 2020 & 2033
- Table 63: Global Clinical Trial Management Industry Revenue billion Forecast, by Delivery Mode 2020 & 2033
- Table 64: Global Clinical Trial Management Industry Volume K Unit Forecast, by Delivery Mode 2020 & 2033
- Table 65: Global Clinical Trial Management Industry Revenue billion Forecast, by Component 2020 & 2033
- Table 66: Global Clinical Trial Management Industry Volume K Unit Forecast, by Component 2020 & 2033
- Table 67: Global Clinical Trial Management Industry Revenue billion Forecast, by End User 2020 & 2033
- Table 68: Global Clinical Trial Management Industry Volume K Unit Forecast, by End User 2020 & 2033
- Table 69: Global Clinical Trial Management Industry Revenue billion Forecast, by Country 2020 & 2033
- Table 70: Global Clinical Trial Management Industry Volume K Unit Forecast, by Country 2020 & 2033
- Table 71: GCC Clinical Trial Management Industry Revenue (billion) Forecast, by Application 2020 & 2033
- Table 72: GCC Clinical Trial Management Industry Volume (K Unit) Forecast, by Application 2020 & 2033
- Table 73: South Africa Clinical Trial Management Industry Revenue (billion) Forecast, by Application 2020 & 2033
- Table 74: South Africa Clinical Trial Management Industry Volume (K Unit) Forecast, by Application 2020 & 2033
- Table 75: Rest of Middle East and Africa Clinical Trial Management Industry Revenue (billion) Forecast, by Application 2020 & 2033
- Table 76: Rest of Middle East and Africa Clinical Trial Management Industry Volume (K Unit) Forecast, by Application 2020 & 2033
- Table 77: Global Clinical Trial Management Industry Revenue billion Forecast, by Delivery Mode 2020 & 2033
- Table 78: Global Clinical Trial Management Industry Volume K Unit Forecast, by Delivery Mode 2020 & 2033
- Table 79: Global Clinical Trial Management Industry Revenue billion Forecast, by Component 2020 & 2033
- Table 80: Global Clinical Trial Management Industry Volume K Unit Forecast, by Component 2020 & 2033
- Table 81: Global Clinical Trial Management Industry Revenue billion Forecast, by End User 2020 & 2033
- Table 82: Global Clinical Trial Management Industry Volume K Unit Forecast, by End User 2020 & 2033
- Table 83: Global Clinical Trial Management Industry Revenue billion Forecast, by Country 2020 & 2033
- Table 84: Global Clinical Trial Management Industry Volume K Unit Forecast, by Country 2020 & 2033
- Table 85: Brazil Clinical Trial Management Industry Revenue (billion) Forecast, by Application 2020 & 2033
- Table 86: Brazil Clinical Trial Management Industry Volume (K Unit) Forecast, by Application 2020 & 2033
- Table 87: Argentina Clinical Trial Management Industry Revenue (billion) Forecast, by Application 2020 & 2033
- Table 88: Argentina Clinical Trial Management Industry Volume (K Unit) Forecast, by Application 2020 & 2033
- Table 89: Rest of South America Clinical Trial Management Industry Revenue (billion) Forecast, by Application 2020 & 2033
- Table 90: Rest of South America Clinical Trial Management Industry Volume (K Unit) Forecast, by Application 2020 & 2033
Frequently Asked Questions
1. What is the projected Compound Annual Growth Rate (CAGR) of the Clinical Trial Management Industry?
The projected CAGR is approximately 5.9%.
2. Which companies are prominent players in the Clinical Trial Management Industry?
Key companies in the market include MedNet Solutions Inc, ERT Clinical, Bioclinica, DATATRAK International Inc, ArisGlobal LLC, RealTime Software Solutions LLC, Advarra, DZS Clinical Services, Oracle Corporation, Veeva Systems, Calyx, Dassault Systèmes (Medidata Solutions Inc ), IBM.
3. What are the main segments of the Clinical Trial Management Industry?
The market segments include Delivery Mode, Component, End User.
4. Can you provide details about the market size?
The market size is estimated to be USD 21 billion as of 2022.
5. What are some drivers contributing to market growth?
Growing Number of Clinical Trials Due to Rising Chronic Diseases and Lifestyle-related Disorders; Rise in Outsourcing of Clinical Trials and Implementation by Contract Research Organizations.
6. What are the notable trends driving market growth?
The Pharmaceutical Segment is Expected to Grow Over the Forecast Period.
7. Are there any restraints impacting market growth?
Data Security Issues; High Cost Associated With Clinical Trial Management Systems.
8. Can you provide examples of recent developments in the market?
March 2023: Assentia launched tech platforms to support payments in the clinical trial space. The company released two SaaS-based applications, GrantPay and GrantPact, to provide clinical trial contract negotiation and payment services.
9. What pricing options are available for accessing the report?
Pricing options include single-user, multi-user, and enterprise licenses priced at USD 4750, USD 5250, and USD 8750 respectively.
10. Is the market size provided in terms of value or volume?
The market size is provided in terms of value, measured in billion and volume, measured in K Unit.
11. Are there any specific market keywords associated with the report?
Yes, the market keyword associated with the report is "Clinical Trial Management Industry," which aids in identifying and referencing the specific market segment covered.
12. How do I determine which pricing option suits my needs best?
The pricing options vary based on user requirements and access needs. Individual users may opt for single-user licenses, while businesses requiring broader access may choose multi-user or enterprise licenses for cost-effective access to the report.
13. Are there any additional resources or data provided in the Clinical Trial Management Industry report?
While the report offers comprehensive insights, it's advisable to review the specific contents or supplementary materials provided to ascertain if additional resources or data are available.
14. How can I stay updated on further developments or reports in the Clinical Trial Management Industry?
To stay informed about further developments, trends, and reports in the Clinical Trial Management Industry, consider subscribing to industry newsletters, following relevant companies and organizations, or regularly checking reputable industry news sources and publications.
Methodology
Step 1 - Identification of Relevant Samples Size from Population Database


Step 2 - Approaches for Defining Global Market Size (Value, Volume* & Price*)

Note*: In applicable scenarios
Step 3 - Data Sources
Primary Research
- Web Analytics
- Survey Reports
- Research Institute
- Latest Research Reports
- Opinion Leaders
Secondary Research
- Annual Reports
- White Paper
- Latest Press Release
- Industry Association
- Paid Database
- Investor Presentations

Step 4 - Data Triangulation
Involves using different sources of information in order to increase the validity of a study
These sources are likely to be stakeholders in a program - participants, other researchers, program staff, other community members, and so on.
Then we put all data in single framework & apply various statistical tools to find out the dynamic on the market.
During the analysis stage, feedback from the stakeholder groups would be compared to determine areas of agreement as well as areas of divergence