

Key Insights
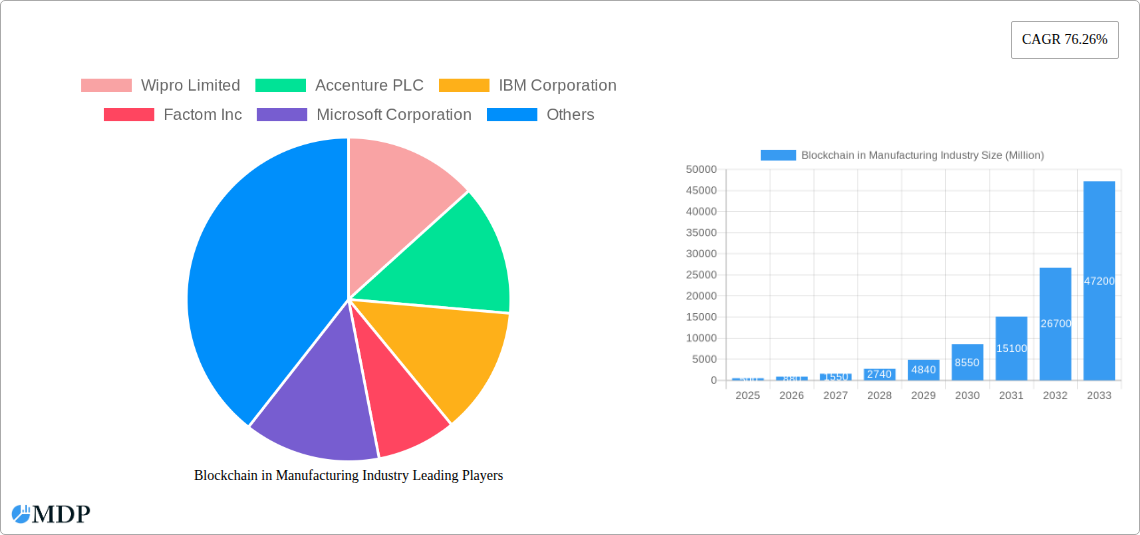
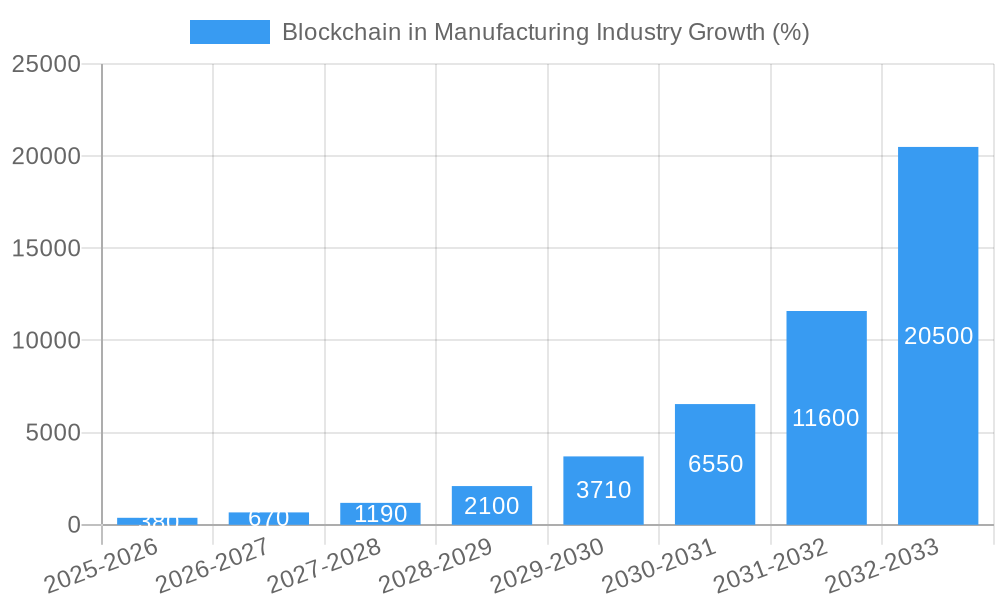
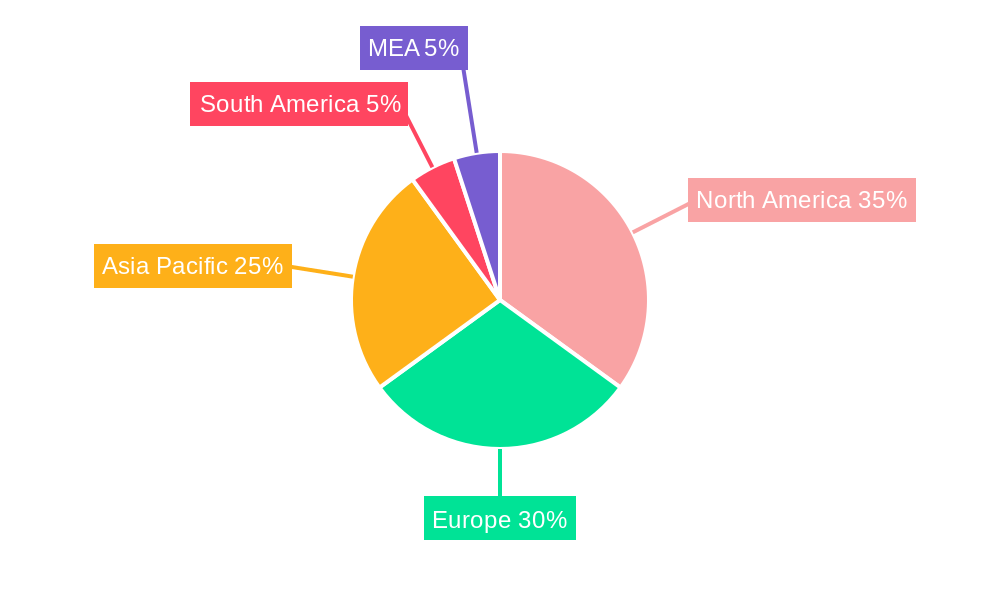
The Blockchain in Manufacturing market is experiencing explosive growth, projected to reach a substantial size by 2033. A compound annual growth rate (CAGR) of 76.26% from 2019 to 2024 suggests a significant market expansion fueled by several key drivers. The increasing need for enhanced supply chain transparency and traceability is a primary factor. Blockchain's inherent immutability and security features are proving invaluable in combating counterfeiting, ensuring product authenticity, and streamlining quality control processes across various industries. The automotive, aerospace and defense, and pharmaceutical sectors are early adopters, leveraging blockchain to improve operational efficiency, reduce risks, and enhance customer trust. Growing regulatory pressure for greater transparency and accountability further accelerates adoption. While initial implementation costs and a lack of standardized protocols represent challenges, the long-term benefits of improved efficiency, reduced fraud, and enhanced supply chain visibility outweigh the initial hurdles. The market segmentation, encompassing applications like logistics, counterfeit management, and quality control, across diverse end-user verticals, indicates a broad-based adoption pattern. This diverse application is driving the substantial growth projections. The competitive landscape includes both technology giants like Microsoft and IBM, and specialized blockchain solution providers, fostering innovation and competition. The geographical distribution of market share reflects a strong presence in North America and Europe, with Asia-Pacific emerging as a rapidly growing region.
The forecast period of 2025-2033 anticipates continued market expansion, driven by technological advancements, increasing industry awareness, and expanding regulatory frameworks. Strategic partnerships between technology companies and manufacturing firms are expected to accelerate integration and broaden the adoption of blockchain solutions. Further growth will likely be stimulated by the development of user-friendly interfaces and interoperable blockchain platforms. The market's success will depend on overcoming interoperability challenges, addressing scalability concerns, and fostering greater collaboration across the manufacturing ecosystem. Addressing data privacy and security concerns within the blockchain infrastructure will also be crucial to sustained growth. The significant investment in research and development across various segments points towards a future where blockchain plays a central role in revolutionizing manufacturing processes.
Blockchain in Manufacturing Industry: A Comprehensive Market Report (2019-2033)
This in-depth report provides a comprehensive analysis of the Blockchain in Manufacturing Industry market, projecting a robust growth trajectory fueled by technological advancements and increasing adoption across diverse segments. Valued at $XX Million in 2025, the market is poised for significant expansion, reaching $XX Million by 2033, exhibiting a CAGR of XX% during the forecast period (2025-2033). This report covers the historical period (2019-2024), with 2025 serving as the base year and estimated year. The analysis encompasses key market dynamics, leading players like Wipro Limited, Accenture PLC, IBM Corporation, and more, and emerging trends shaping this transformative technology's future within manufacturing.
Blockchain in Manufacturing Industry Market Dynamics & Concentration
The Blockchain in Manufacturing Industry market is experiencing moderate concentration, with several major players holding significant market share. Wipro Limited, Accenture PLC, and IBM Corporation are among the leading companies, driving innovation and market expansion through strategic partnerships and product development. However, the market also features a significant number of smaller, specialized firms contributing to its dynamic nature.
- Market Concentration: The Herfindahl-Hirschman Index (HHI) is estimated at XX, indicating a moderately concentrated market. The top 5 players account for approximately XX% of the total market share in 2025.
- Innovation Drivers: Increased focus on supply chain transparency, enhanced data security needs, and the rising demand for counterfeit prevention are key innovation drivers. Development of specialized blockchain platforms tailored for manufacturing applications is also contributing to growth.
- Regulatory Frameworks: Government regulations surrounding data privacy and security are influencing market adoption, with increasing emphasis on compliance standards driving demand for secure blockchain solutions.
- Product Substitutes: Traditional methods of tracking and managing supply chains, quality control, and authentication pose competition. However, the limitations of these methods in terms of security and transparency are gradually pushing manufacturers towards blockchain solutions.
- End-User Trends: The growing adoption of Industry 4.0 principles and the increasing focus on digital transformation are fueling the demand for blockchain solutions in manufacturing. Businesses are actively seeking ways to improve efficiency, reduce costs, and enhance transparency throughout their operations.
- M&A Activities: The number of mergers and acquisitions (M&A) deals in the Blockchain in Manufacturing Industry increased significantly in the past few years. A total of XX M&A deals were recorded between 2020 and 2024, indicating a growing interest among industry players in strategic partnerships and consolidation.
Blockchain in Manufacturing Industry Industry Trends & Analysis
The Blockchain in Manufacturing Industry is experiencing rapid growth, driven by a convergence of factors including increasing data security concerns, the need for improved supply chain transparency, and the growing adoption of Industry 4.0 technologies. Technological advancements in blockchain infrastructure, coupled with decreasing costs, are widening its applicability across various manufacturing sectors. Consumer preference for sustainably sourced products is also boosting demand for blockchain-based solutions that enable transparent tracking of product origins and environmental impacts. The competitive landscape is highly dynamic, with both established technology giants and emerging startups vying for market share. The market penetration of blockchain solutions in manufacturing is currently at XX%, but is expected to reach XX% by 2033 due to various factors. The compound annual growth rate (CAGR) during the forecast period (2025-2033) is estimated at XX%.
Leading Markets & Segments in Blockchain in Manufacturing Industry
The Logistics and Supply Chain Management segment dominates the Blockchain in Manufacturing Industry, driven by the need for enhanced transparency and traceability across complex global supply chains. The Automotive and Pharmaceutical end-user verticals also show significant potential for growth due to stringent regulatory compliance requirements and the critical nature of their products.
Dominant Region/Country: North America currently holds the largest market share, driven by early adoption and significant investments in blockchain technology. Asia-Pacific is expected to witness rapid growth in the coming years due to the increasing manufacturing activity and government support for technological innovation.
Key Drivers for Logistics and Supply Chain Management:
- Increased demand for real-time visibility and traceability of goods throughout the supply chain.
- Growing need to improve efficiency and reduce costs associated with logistics and transportation.
- Rising pressure to comply with regulatory requirements regarding supply chain transparency.
Key Drivers for Automotive:
- Need for enhanced security measures to prevent counterfeit parts and ensure product authenticity.
- Growing demand for real-time monitoring of vehicle performance and maintenance.
- Increasing regulatory requirements related to data privacy and security.
Key Drivers for Pharmaceuticals:
- Stringent regulatory requirements related to drug traceability and counterfeit prevention.
- Growing demand for transparent supply chains to ensure product authenticity and quality.
- Need to improve efficiency and reduce costs associated with drug distribution and logistics.
Blockchain in Manufacturing Industry Product Developments
Recent product innovations focus on developing user-friendly platforms and integrating blockchain with existing manufacturing systems. This includes the creation of specialized software solutions for supply chain management, quality control, and counterfeit prevention. The competitive advantage stems from offering scalable, secure, and cost-effective solutions that meet the specific needs of various manufacturing sectors. The trend is toward creating interoperable blockchain solutions that seamlessly integrate with existing enterprise systems.
Key Drivers of Blockchain in Manufacturing Industry Growth
Several factors contribute to the growth of the Blockchain in Manufacturing Industry. First, advancements in blockchain technology, resulting in improved scalability and security. Second, the increasing need for transparent and secure supply chains in response to globalization and consumer demand for ethical and sustainable products. Third, supportive government regulations and initiatives promoting the adoption of blockchain in various sectors. For instance, the increasing adoption of Industry 4.0 creates a large market opportunity.
Challenges in the Blockchain in Manufacturing Industry Market
The Blockchain in Manufacturing Industry faces several challenges. High initial investment costs for implementation, a lack of standardization and interoperability across various platforms, and concerns about data privacy and security can hinder widespread adoption. Regulatory uncertainty and complexities in integrating blockchain technology with legacy systems also pose significant obstacles. The estimated impact of these challenges on market growth is approximately XX% reduction in the adoption rate compared to a more favorable regulatory and technological environment.
Emerging Opportunities in Blockchain in Manufacturing Industry
Several emerging opportunities are poised to accelerate long-term growth. The development of more efficient and cost-effective blockchain platforms, coupled with strategic partnerships between technology providers and manufacturing companies, will lead to wider adoption. Expansion into new markets, particularly in developing economies, will also contribute to market expansion. The increasing focus on sustainable manufacturing practices creates substantial opportunities for blockchain-based solutions that enhance transparency and traceability throughout the supply chain.
Leading Players in the Blockchain in Manufacturing Industry Sector
- Wipro Limited
- Accenture PLC
- IBM Corporation
- Factom Inc
- Microsoft Corporation
- Advanced Micro Devices Inc
- Amazon Web Services Inc
- Oracle Corporation
- Infosys Ltd
- SAP SE
- Intel Corporation
Key Milestones in Blockchain in Manufacturing Industry Industry
- June 2022: Shell, Accenture, and American Express Global Business Travel launched Avelia, a blockchain-based platform for sustainable aviation fuel (SAF) tracking, demonstrating the potential for blockchain in supply chain transparency and sustainability.
- April 2022: Intel Corporation launched the Intel Blockscale ASIC, enhancing the scalability and sustainability of blockchain technology, particularly for energy-intensive applications like cryptocurrency mining. This potentially reduces the environmental impact of some blockchain operations.
Strategic Outlook for Blockchain in Manufacturing Industry Market
The Blockchain in Manufacturing Industry holds immense potential for growth driven by technological advancements, increasing adoption across various segments, and a growing focus on supply chain security and transparency. Strategic partnerships, technological innovation, and regulatory clarity will play a critical role in unlocking this potential and shaping the future of the industry. The market is anticipated to experience substantial expansion in the coming years, propelled by these positive market drivers and addressing existing challenges effectively.
Blockchain in Manufacturing Industry Segmentation
-
1. Application
- 1.1. Logistics and Supply Chain Management
- 1.2. Counterfeit Management
- 1.3. Quality Control and Compliance
- 1.4. Other Applications
-
2. End-user Vertical
- 2.1. Automotive
- 2.2. Aerospace and Defense
- 2.3. Pharmaceutical
- 2.4. Consumer Electronics
- 2.5. Other End-user Verticals
Blockchain in Manufacturing Industry Segmentation By Geography
- 1. North America
- 2. Europe
- 3. Asia Pacific
- 4. Rest of the World
Blockchain in Manufacturing Industry REPORT HIGHLIGHTS
| Aspects | Details |
|---|---|
| Study Period | 2019-2033 |
| Base Year | 2024 |
| Estimated Year | 2025 |
| Forecast Period | 2025-2033 |
| Historical Period | 2019-2024 |
| Growth Rate | CAGR of 76.26% from 2019-2033 |
| Segmentation |
|
Table of Contents
- 1. Introduction
- 1.1. Research Scope
- 1.2. Market Segmentation
- 1.3. Research Methodology
- 1.4. Definitions and Assumptions
- 2. Executive Summary
- 2.1. Introduction
- 3. Market Dynamics
- 3.1. Introduction
- 3.2. Market Drivers
- 3.2.1. Blockchain-as-a-Service Solutions for Enterprises; Simplifies Business Processes and Reduces Cost of Production
- 3.3. Market Restrains
- 3.3.1. Absence of Common Set of Standards and Regulatory Bodies
- 3.4. Market Trends
- 3.4.1. Automotive Vertical is to Witness the Significant Growth
- 4. Market Factor Analysis
- 4.1. Porters Five Forces
- 4.2. Supply/Value Chain
- 4.3. PESTEL analysis
- 4.4. Market Entropy
- 4.5. Patent/Trademark Analysis
- 5. Global Blockchain in Manufacturing Industry Analysis, Insights and Forecast, 2019-2031
- 5.1. Market Analysis, Insights and Forecast - by Application
- 5.1.1. Logistics and Supply Chain Management
- 5.1.2. Counterfeit Management
- 5.1.3. Quality Control and Compliance
- 5.1.4. Other Applications
- 5.2. Market Analysis, Insights and Forecast - by End-user Vertical
- 5.2.1. Automotive
- 5.2.2. Aerospace and Defense
- 5.2.3. Pharmaceutical
- 5.2.4. Consumer Electronics
- 5.2.5. Other End-user Verticals
- 5.3. Market Analysis, Insights and Forecast - by Region
- 5.3.1. North America
- 5.3.2. Europe
- 5.3.3. Asia Pacific
- 5.3.4. Rest of the World
- 5.1. Market Analysis, Insights and Forecast - by Application
- 6. North America Blockchain in Manufacturing Industry Analysis, Insights and Forecast, 2019-2031
- 6.1. Market Analysis, Insights and Forecast - by Application
- 6.1.1. Logistics and Supply Chain Management
- 6.1.2. Counterfeit Management
- 6.1.3. Quality Control and Compliance
- 6.1.4. Other Applications
- 6.2. Market Analysis, Insights and Forecast - by End-user Vertical
- 6.2.1. Automotive
- 6.2.2. Aerospace and Defense
- 6.2.3. Pharmaceutical
- 6.2.4. Consumer Electronics
- 6.2.5. Other End-user Verticals
- 6.1. Market Analysis, Insights and Forecast - by Application
- 7. Europe Blockchain in Manufacturing Industry Analysis, Insights and Forecast, 2019-2031
- 7.1. Market Analysis, Insights and Forecast - by Application
- 7.1.1. Logistics and Supply Chain Management
- 7.1.2. Counterfeit Management
- 7.1.3. Quality Control and Compliance
- 7.1.4. Other Applications
- 7.2. Market Analysis, Insights and Forecast - by End-user Vertical
- 7.2.1. Automotive
- 7.2.2. Aerospace and Defense
- 7.2.3. Pharmaceutical
- 7.2.4. Consumer Electronics
- 7.2.5. Other End-user Verticals
- 7.1. Market Analysis, Insights and Forecast - by Application
- 8. Asia Pacific Blockchain in Manufacturing Industry Analysis, Insights and Forecast, 2019-2031
- 8.1. Market Analysis, Insights and Forecast - by Application
- 8.1.1. Logistics and Supply Chain Management
- 8.1.2. Counterfeit Management
- 8.1.3. Quality Control and Compliance
- 8.1.4. Other Applications
- 8.2. Market Analysis, Insights and Forecast - by End-user Vertical
- 8.2.1. Automotive
- 8.2.2. Aerospace and Defense
- 8.2.3. Pharmaceutical
- 8.2.4. Consumer Electronics
- 8.2.5. Other End-user Verticals
- 8.1. Market Analysis, Insights and Forecast - by Application
- 9. Rest of the World Blockchain in Manufacturing Industry Analysis, Insights and Forecast, 2019-2031
- 9.1. Market Analysis, Insights and Forecast - by Application
- 9.1.1. Logistics and Supply Chain Management
- 9.1.2. Counterfeit Management
- 9.1.3. Quality Control and Compliance
- 9.1.4. Other Applications
- 9.2. Market Analysis, Insights and Forecast - by End-user Vertical
- 9.2.1. Automotive
- 9.2.2. Aerospace and Defense
- 9.2.3. Pharmaceutical
- 9.2.4. Consumer Electronics
- 9.2.5. Other End-user Verticals
- 9.1. Market Analysis, Insights and Forecast - by Application
- 10. North America Blockchain in Manufacturing Industry Analysis, Insights and Forecast, 2019-2031
- 10.1. Market Analysis, Insights and Forecast - By Country/Sub-region
- 10.1.1 United States
- 10.1.2 Canada
- 10.1.3 Mexico
- 11. Europe Blockchain in Manufacturing Industry Analysis, Insights and Forecast, 2019-2031
- 11.1. Market Analysis, Insights and Forecast - By Country/Sub-region
- 11.1.1 Germany
- 11.1.2 United Kingdom
- 11.1.3 France
- 11.1.4 Spain
- 11.1.5 Italy
- 11.1.6 Spain
- 11.1.7 Belgium
- 11.1.8 Netherland
- 11.1.9 Nordics
- 11.1.10 Rest of Europe
- 12. Asia Pacific Blockchain in Manufacturing Industry Analysis, Insights and Forecast, 2019-2031
- 12.1. Market Analysis, Insights and Forecast - By Country/Sub-region
- 12.1.1 China
- 12.1.2 Japan
- 12.1.3 India
- 12.1.4 South Korea
- 12.1.5 Southeast Asia
- 12.1.6 Australia
- 12.1.7 Indonesia
- 12.1.8 Phillipes
- 12.1.9 Singapore
- 12.1.10 Thailandc
- 12.1.11 Rest of Asia Pacific
- 13. South America Blockchain in Manufacturing Industry Analysis, Insights and Forecast, 2019-2031
- 13.1. Market Analysis, Insights and Forecast - By Country/Sub-region
- 13.1.1 Brazil
- 13.1.2 Argentina
- 13.1.3 Peru
- 13.1.4 Chile
- 13.1.5 Colombia
- 13.1.6 Ecuador
- 13.1.7 Venezuela
- 13.1.8 Rest of South America
- 14. North America Blockchain in Manufacturing Industry Analysis, Insights and Forecast, 2019-2031
- 14.1. Market Analysis, Insights and Forecast - By Country/Sub-region
- 14.1.1 United States
- 14.1.2 Canada
- 14.1.3 Mexico
- 15. MEA Blockchain in Manufacturing Industry Analysis, Insights and Forecast, 2019-2031
- 15.1. Market Analysis, Insights and Forecast - By Country/Sub-region
- 15.1.1 United Arab Emirates
- 15.1.2 Saudi Arabia
- 15.1.3 South Africa
- 15.1.4 Rest of Middle East and Africa
- 16. Competitive Analysis
- 16.1. Global Market Share Analysis 2024
- 16.2. Company Profiles
- 16.2.1 Wipro Limited
- 16.2.1.1. Overview
- 16.2.1.2. Products
- 16.2.1.3. SWOT Analysis
- 16.2.1.4. Recent Developments
- 16.2.1.5. Financials (Based on Availability)
- 16.2.2 Accenture PLC
- 16.2.2.1. Overview
- 16.2.2.2. Products
- 16.2.2.3. SWOT Analysis
- 16.2.2.4. Recent Developments
- 16.2.2.5. Financials (Based on Availability)
- 16.2.3 IBM Corporation
- 16.2.3.1. Overview
- 16.2.3.2. Products
- 16.2.3.3. SWOT Analysis
- 16.2.3.4. Recent Developments
- 16.2.3.5. Financials (Based on Availability)
- 16.2.4 Factom Inc
- 16.2.4.1. Overview
- 16.2.4.2. Products
- 16.2.4.3. SWOT Analysis
- 16.2.4.4. Recent Developments
- 16.2.4.5. Financials (Based on Availability)
- 16.2.5 Microsoft Corporation
- 16.2.5.1. Overview
- 16.2.5.2. Products
- 16.2.5.3. SWOT Analysis
- 16.2.5.4. Recent Developments
- 16.2.5.5. Financials (Based on Availability)
- 16.2.6 Advanced Micro Devices Inc
- 16.2.6.1. Overview
- 16.2.6.2. Products
- 16.2.6.3. SWOT Analysis
- 16.2.6.4. Recent Developments
- 16.2.6.5. Financials (Based on Availability)
- 16.2.7 Amazon Web Services Inc
- 16.2.7.1. Overview
- 16.2.7.2. Products
- 16.2.7.3. SWOT Analysis
- 16.2.7.4. Recent Developments
- 16.2.7.5. Financials (Based on Availability)
- 16.2.8 Oracle Corporation
- 16.2.8.1. Overview
- 16.2.8.2. Products
- 16.2.8.3. SWOT Analysis
- 16.2.8.4. Recent Developments
- 16.2.8.5. Financials (Based on Availability)
- 16.2.9 Infosys Ltd*List Not Exhaustive
- 16.2.9.1. Overview
- 16.2.9.2. Products
- 16.2.9.3. SWOT Analysis
- 16.2.9.4. Recent Developments
- 16.2.9.5. Financials (Based on Availability)
- 16.2.10 SAP SE
- 16.2.10.1. Overview
- 16.2.10.2. Products
- 16.2.10.3. SWOT Analysis
- 16.2.10.4. Recent Developments
- 16.2.10.5. Financials (Based on Availability)
- 16.2.11 Intel Corporation
- 16.2.11.1. Overview
- 16.2.11.2. Products
- 16.2.11.3. SWOT Analysis
- 16.2.11.4. Recent Developments
- 16.2.11.5. Financials (Based on Availability)
- 16.2.1 Wipro Limited
List of Figures
- Figure 1: Global Blockchain in Manufacturing Industry Revenue Breakdown (Million, %) by Region 2024 & 2032
- Figure 2: North America Blockchain in Manufacturing Industry Revenue (Million), by Country 2024 & 2032
- Figure 3: North America Blockchain in Manufacturing Industry Revenue Share (%), by Country 2024 & 2032
- Figure 4: Europe Blockchain in Manufacturing Industry Revenue (Million), by Country 2024 & 2032
- Figure 5: Europe Blockchain in Manufacturing Industry Revenue Share (%), by Country 2024 & 2032
- Figure 6: Asia Pacific Blockchain in Manufacturing Industry Revenue (Million), by Country 2024 & 2032
- Figure 7: Asia Pacific Blockchain in Manufacturing Industry Revenue Share (%), by Country 2024 & 2032
- Figure 8: South America Blockchain in Manufacturing Industry Revenue (Million), by Country 2024 & 2032
- Figure 9: South America Blockchain in Manufacturing Industry Revenue Share (%), by Country 2024 & 2032
- Figure 10: North America Blockchain in Manufacturing Industry Revenue (Million), by Country 2024 & 2032
- Figure 11: North America Blockchain in Manufacturing Industry Revenue Share (%), by Country 2024 & 2032
- Figure 12: MEA Blockchain in Manufacturing Industry Revenue (Million), by Country 2024 & 2032
- Figure 13: MEA Blockchain in Manufacturing Industry Revenue Share (%), by Country 2024 & 2032
- Figure 14: North America Blockchain in Manufacturing Industry Revenue (Million), by Application 2024 & 2032
- Figure 15: North America Blockchain in Manufacturing Industry Revenue Share (%), by Application 2024 & 2032
- Figure 16: North America Blockchain in Manufacturing Industry Revenue (Million), by End-user Vertical 2024 & 2032
- Figure 17: North America Blockchain in Manufacturing Industry Revenue Share (%), by End-user Vertical 2024 & 2032
- Figure 18: North America Blockchain in Manufacturing Industry Revenue (Million), by Country 2024 & 2032
- Figure 19: North America Blockchain in Manufacturing Industry Revenue Share (%), by Country 2024 & 2032
- Figure 20: Europe Blockchain in Manufacturing Industry Revenue (Million), by Application 2024 & 2032
- Figure 21: Europe Blockchain in Manufacturing Industry Revenue Share (%), by Application 2024 & 2032
- Figure 22: Europe Blockchain in Manufacturing Industry Revenue (Million), by End-user Vertical 2024 & 2032
- Figure 23: Europe Blockchain in Manufacturing Industry Revenue Share (%), by End-user Vertical 2024 & 2032
- Figure 24: Europe Blockchain in Manufacturing Industry Revenue (Million), by Country 2024 & 2032
- Figure 25: Europe Blockchain in Manufacturing Industry Revenue Share (%), by Country 2024 & 2032
- Figure 26: Asia Pacific Blockchain in Manufacturing Industry Revenue (Million), by Application 2024 & 2032
- Figure 27: Asia Pacific Blockchain in Manufacturing Industry Revenue Share (%), by Application 2024 & 2032
- Figure 28: Asia Pacific Blockchain in Manufacturing Industry Revenue (Million), by End-user Vertical 2024 & 2032
- Figure 29: Asia Pacific Blockchain in Manufacturing Industry Revenue Share (%), by End-user Vertical 2024 & 2032
- Figure 30: Asia Pacific Blockchain in Manufacturing Industry Revenue (Million), by Country 2024 & 2032
- Figure 31: Asia Pacific Blockchain in Manufacturing Industry Revenue Share (%), by Country 2024 & 2032
- Figure 32: Rest of the World Blockchain in Manufacturing Industry Revenue (Million), by Application 2024 & 2032
- Figure 33: Rest of the World Blockchain in Manufacturing Industry Revenue Share (%), by Application 2024 & 2032
- Figure 34: Rest of the World Blockchain in Manufacturing Industry Revenue (Million), by End-user Vertical 2024 & 2032
- Figure 35: Rest of the World Blockchain in Manufacturing Industry Revenue Share (%), by End-user Vertical 2024 & 2032
- Figure 36: Rest of the World Blockchain in Manufacturing Industry Revenue (Million), by Country 2024 & 2032
- Figure 37: Rest of the World Blockchain in Manufacturing Industry Revenue Share (%), by Country 2024 & 2032
List of Tables
- Table 1: Global Blockchain in Manufacturing Industry Revenue Million Forecast, by Region 2019 & 2032
- Table 2: Global Blockchain in Manufacturing Industry Revenue Million Forecast, by Application 2019 & 2032
- Table 3: Global Blockchain in Manufacturing Industry Revenue Million Forecast, by End-user Vertical 2019 & 2032
- Table 4: Global Blockchain in Manufacturing Industry Revenue Million Forecast, by Region 2019 & 2032
- Table 5: Global Blockchain in Manufacturing Industry Revenue Million Forecast, by Country 2019 & 2032
- Table 6: United States Blockchain in Manufacturing Industry Revenue (Million) Forecast, by Application 2019 & 2032
- Table 7: Canada Blockchain in Manufacturing Industry Revenue (Million) Forecast, by Application 2019 & 2032
- Table 8: Mexico Blockchain in Manufacturing Industry Revenue (Million) Forecast, by Application 2019 & 2032
- Table 9: Global Blockchain in Manufacturing Industry Revenue Million Forecast, by Country 2019 & 2032
- Table 10: Germany Blockchain in Manufacturing Industry Revenue (Million) Forecast, by Application 2019 & 2032
- Table 11: United Kingdom Blockchain in Manufacturing Industry Revenue (Million) Forecast, by Application 2019 & 2032
- Table 12: France Blockchain in Manufacturing Industry Revenue (Million) Forecast, by Application 2019 & 2032
- Table 13: Spain Blockchain in Manufacturing Industry Revenue (Million) Forecast, by Application 2019 & 2032
- Table 14: Italy Blockchain in Manufacturing Industry Revenue (Million) Forecast, by Application 2019 & 2032
- Table 15: Spain Blockchain in Manufacturing Industry Revenue (Million) Forecast, by Application 2019 & 2032
- Table 16: Belgium Blockchain in Manufacturing Industry Revenue (Million) Forecast, by Application 2019 & 2032
- Table 17: Netherland Blockchain in Manufacturing Industry Revenue (Million) Forecast, by Application 2019 & 2032
- Table 18: Nordics Blockchain in Manufacturing Industry Revenue (Million) Forecast, by Application 2019 & 2032
- Table 19: Rest of Europe Blockchain in Manufacturing Industry Revenue (Million) Forecast, by Application 2019 & 2032
- Table 20: Global Blockchain in Manufacturing Industry Revenue Million Forecast, by Country 2019 & 2032
- Table 21: China Blockchain in Manufacturing Industry Revenue (Million) Forecast, by Application 2019 & 2032
- Table 22: Japan Blockchain in Manufacturing Industry Revenue (Million) Forecast, by Application 2019 & 2032
- Table 23: India Blockchain in Manufacturing Industry Revenue (Million) Forecast, by Application 2019 & 2032
- Table 24: South Korea Blockchain in Manufacturing Industry Revenue (Million) Forecast, by Application 2019 & 2032
- Table 25: Southeast Asia Blockchain in Manufacturing Industry Revenue (Million) Forecast, by Application 2019 & 2032
- Table 26: Australia Blockchain in Manufacturing Industry Revenue (Million) Forecast, by Application 2019 & 2032
- Table 27: Indonesia Blockchain in Manufacturing Industry Revenue (Million) Forecast, by Application 2019 & 2032
- Table 28: Phillipes Blockchain in Manufacturing Industry Revenue (Million) Forecast, by Application 2019 & 2032
- Table 29: Singapore Blockchain in Manufacturing Industry Revenue (Million) Forecast, by Application 2019 & 2032
- Table 30: Thailandc Blockchain in Manufacturing Industry Revenue (Million) Forecast, by Application 2019 & 2032
- Table 31: Rest of Asia Pacific Blockchain in Manufacturing Industry Revenue (Million) Forecast, by Application 2019 & 2032
- Table 32: Global Blockchain in Manufacturing Industry Revenue Million Forecast, by Country 2019 & 2032
- Table 33: Brazil Blockchain in Manufacturing Industry Revenue (Million) Forecast, by Application 2019 & 2032
- Table 34: Argentina Blockchain in Manufacturing Industry Revenue (Million) Forecast, by Application 2019 & 2032
- Table 35: Peru Blockchain in Manufacturing Industry Revenue (Million) Forecast, by Application 2019 & 2032
- Table 36: Chile Blockchain in Manufacturing Industry Revenue (Million) Forecast, by Application 2019 & 2032
- Table 37: Colombia Blockchain in Manufacturing Industry Revenue (Million) Forecast, by Application 2019 & 2032
- Table 38: Ecuador Blockchain in Manufacturing Industry Revenue (Million) Forecast, by Application 2019 & 2032
- Table 39: Venezuela Blockchain in Manufacturing Industry Revenue (Million) Forecast, by Application 2019 & 2032
- Table 40: Rest of South America Blockchain in Manufacturing Industry Revenue (Million) Forecast, by Application 2019 & 2032
- Table 41: Global Blockchain in Manufacturing Industry Revenue Million Forecast, by Country 2019 & 2032
- Table 42: United States Blockchain in Manufacturing Industry Revenue (Million) Forecast, by Application 2019 & 2032
- Table 43: Canada Blockchain in Manufacturing Industry Revenue (Million) Forecast, by Application 2019 & 2032
- Table 44: Mexico Blockchain in Manufacturing Industry Revenue (Million) Forecast, by Application 2019 & 2032
- Table 45: Global Blockchain in Manufacturing Industry Revenue Million Forecast, by Country 2019 & 2032
- Table 46: United Arab Emirates Blockchain in Manufacturing Industry Revenue (Million) Forecast, by Application 2019 & 2032
- Table 47: Saudi Arabia Blockchain in Manufacturing Industry Revenue (Million) Forecast, by Application 2019 & 2032
- Table 48: South Africa Blockchain in Manufacturing Industry Revenue (Million) Forecast, by Application 2019 & 2032
- Table 49: Rest of Middle East and Africa Blockchain in Manufacturing Industry Revenue (Million) Forecast, by Application 2019 & 2032
- Table 50: Global Blockchain in Manufacturing Industry Revenue Million Forecast, by Application 2019 & 2032
- Table 51: Global Blockchain in Manufacturing Industry Revenue Million Forecast, by End-user Vertical 2019 & 2032
- Table 52: Global Blockchain in Manufacturing Industry Revenue Million Forecast, by Country 2019 & 2032
- Table 53: Global Blockchain in Manufacturing Industry Revenue Million Forecast, by Application 2019 & 2032
- Table 54: Global Blockchain in Manufacturing Industry Revenue Million Forecast, by End-user Vertical 2019 & 2032
- Table 55: Global Blockchain in Manufacturing Industry Revenue Million Forecast, by Country 2019 & 2032
- Table 56: Global Blockchain in Manufacturing Industry Revenue Million Forecast, by Application 2019 & 2032
- Table 57: Global Blockchain in Manufacturing Industry Revenue Million Forecast, by End-user Vertical 2019 & 2032
- Table 58: Global Blockchain in Manufacturing Industry Revenue Million Forecast, by Country 2019 & 2032
- Table 59: Global Blockchain in Manufacturing Industry Revenue Million Forecast, by Application 2019 & 2032
- Table 60: Global Blockchain in Manufacturing Industry Revenue Million Forecast, by End-user Vertical 2019 & 2032
- Table 61: Global Blockchain in Manufacturing Industry Revenue Million Forecast, by Country 2019 & 2032
Frequently Asked Questions
1. What is the projected Compound Annual Growth Rate (CAGR) of the Blockchain in Manufacturing Industry?
The projected CAGR is approximately 76.26%.
2. Which companies are prominent players in the Blockchain in Manufacturing Industry?
Key companies in the market include Wipro Limited, Accenture PLC, IBM Corporation, Factom Inc, Microsoft Corporation, Advanced Micro Devices Inc, Amazon Web Services Inc, Oracle Corporation, Infosys Ltd*List Not Exhaustive, SAP SE, Intel Corporation.
3. What are the main segments of the Blockchain in Manufacturing Industry?
The market segments include Application, End-user Vertical.
4. Can you provide details about the market size?
The market size is estimated to be USD XX Million as of 2022.
5. What are some drivers contributing to market growth?
Blockchain-as-a-Service Solutions for Enterprises; Simplifies Business Processes and Reduces Cost of Production.
6. What are the notable trends driving market growth?
Automotive Vertical is to Witness the Significant Growth.
7. Are there any restraints impacting market growth?
Absence of Common Set of Standards and Regulatory Bodies.
8. Can you provide examples of recent developments in the market?
June 2022: Shell, Accenture, and American Express Global Business Travel collaborated to launch Avelia, one of the first digital book-and-claim services for sustainable aviation fuel (SAF) backed by blockchain for business travel. The program's pilot phase intends to show the validity of the book-and-claim concept by securing the distribution of SAF's environmental qualities to businesses and airlines after the fuel has been supplied into the fuel network using blockchain technology.
9. What pricing options are available for accessing the report?
Pricing options include single-user, multi-user, and enterprise licenses priced at USD 4750, USD 5250, and USD 8750 respectively.
10. Is the market size provided in terms of value or volume?
The market size is provided in terms of value, measured in Million.
11. Are there any specific market keywords associated with the report?
Yes, the market keyword associated with the report is "Blockchain in Manufacturing Industry," which aids in identifying and referencing the specific market segment covered.
12. How do I determine which pricing option suits my needs best?
The pricing options vary based on user requirements and access needs. Individual users may opt for single-user licenses, while businesses requiring broader access may choose multi-user or enterprise licenses for cost-effective access to the report.
13. Are there any additional resources or data provided in the Blockchain in Manufacturing Industry report?
While the report offers comprehensive insights, it's advisable to review the specific contents or supplementary materials provided to ascertain if additional resources or data are available.
14. How can I stay updated on further developments or reports in the Blockchain in Manufacturing Industry?
To stay informed about further developments, trends, and reports in the Blockchain in Manufacturing Industry, consider subscribing to industry newsletters, following relevant companies and organizations, or regularly checking reputable industry news sources and publications.
Methodology
Step 1 - Identification of Relevant Samples Size from Population Database


Step 2 - Approaches for Defining Global Market Size (Value, Volume* & Price*)

Note*: In applicable scenarios
Step 3 - Data Sources
Primary Research
- Web Analytics
- Survey Reports
- Research Institute
- Latest Research Reports
- Opinion Leaders
Secondary Research
- Annual Reports
- White Paper
- Latest Press Release
- Industry Association
- Paid Database
- Investor Presentations

Step 4 - Data Triangulation
Involves using different sources of information in order to increase the validity of a study
These sources are likely to be stakeholders in a program - participants, other researchers, program staff, other community members, and so on.
Then we put all data in single framework & apply various statistical tools to find out the dynamic on the market.
During the analysis stage, feedback from the stakeholder groups would be compared to determine areas of agreement as well as areas of divergence
