

Key Insights into the Biomass Electric Power Generation Market
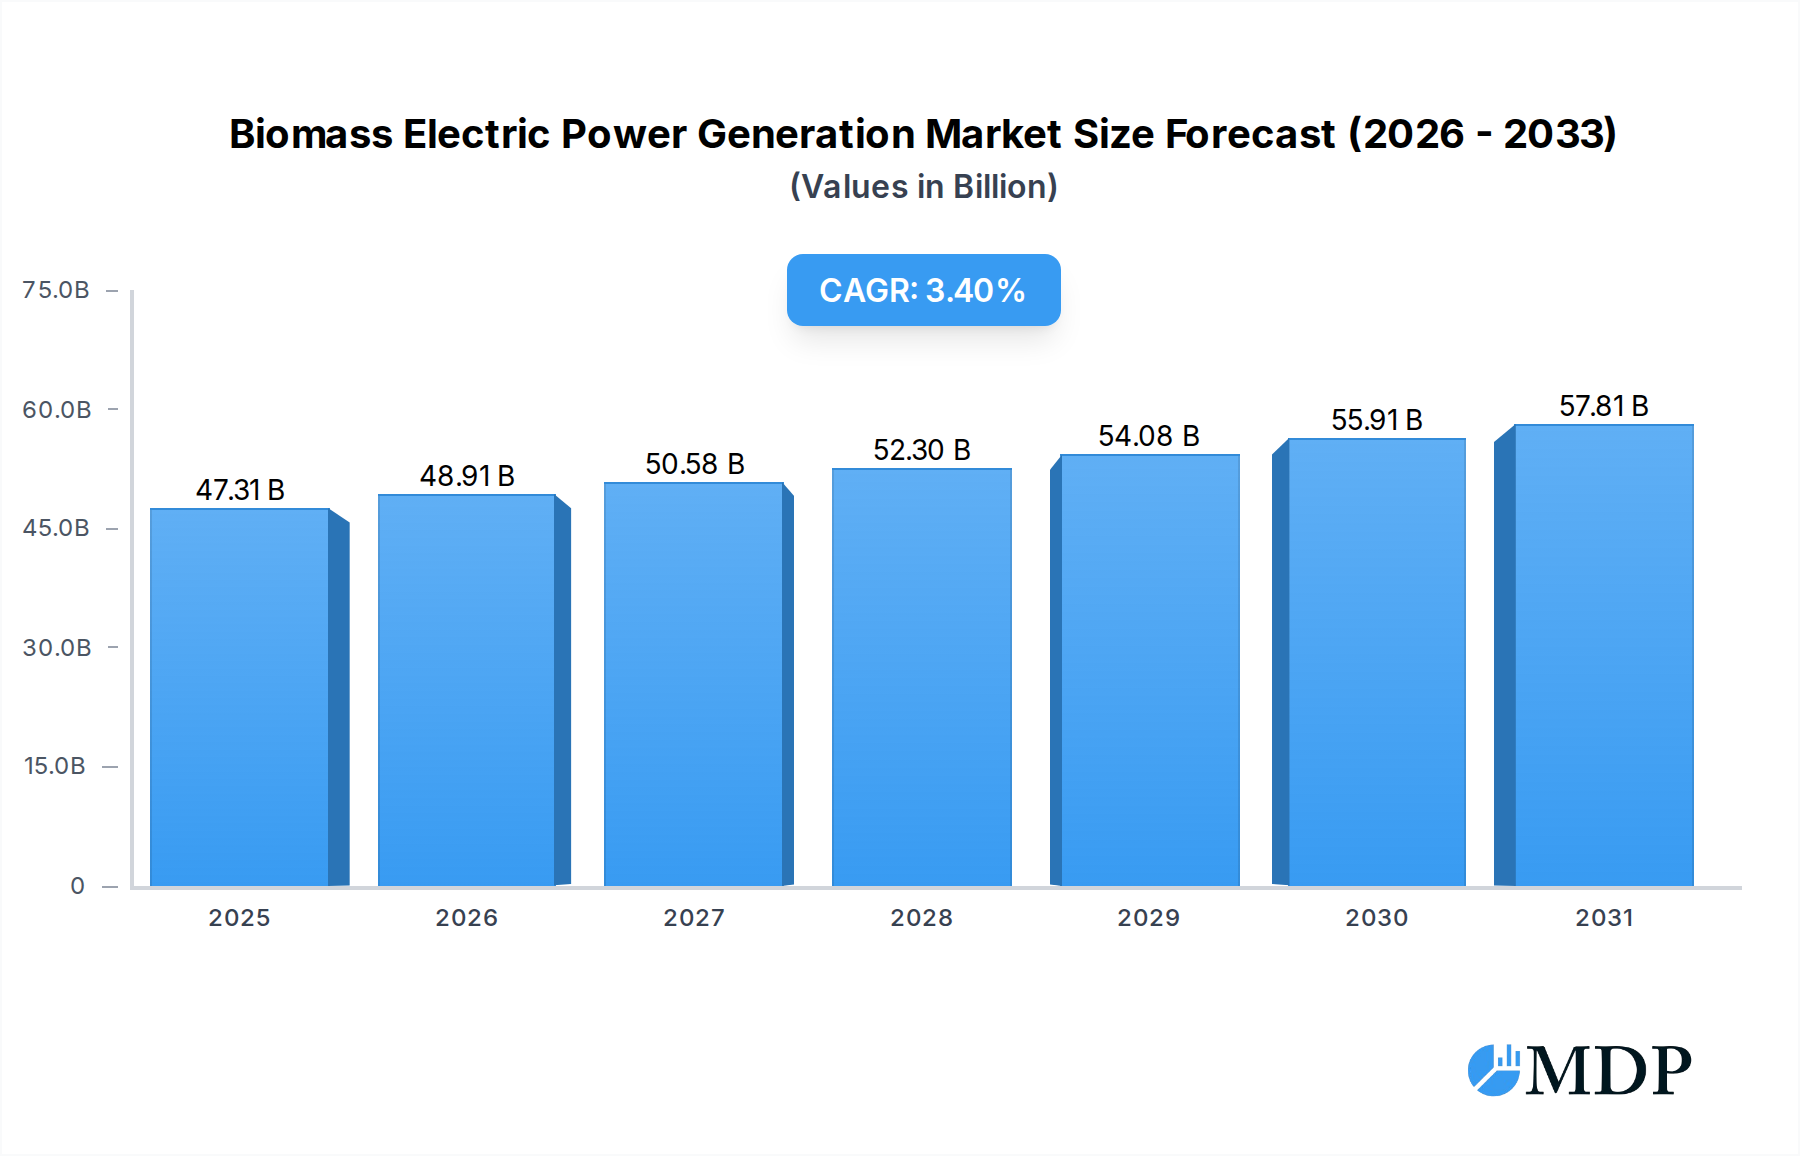
The global Biomass Electric Power Generation Market is poised for sustained expansion, driven by an escalating focus on decarbonization, waste management solutions, and energy security. Valued at an estimated $45,750 million in 2025, the market is projected to reach approximately $61,811 million by 2034, expanding at a Compound Annual Growth Rate (CAGR) of 3.4% during the forecast period. This growth trajectory is underpinned by robust government incentives, increasing demand for sustainable power sources, and technological advancements enhancing conversion efficiencies across diverse biomass feedstocks.

Biomass Electric Power Generation Market Size (In Billion)
Key demand drivers include the implementation of stringent environmental regulations aimed at reducing greenhouse gas emissions and the imperative to diversify energy portfolios away from fossil fuels. Biomass offers a unique advantage as a dispatchable renewable energy source, providing stability to grids increasingly reliant on intermittent renewables. Furthermore, the market benefits from a synergistic relationship with the broader Waste-to-Energy Market, where the conversion of municipal solid waste, agricultural residues, and industrial organic waste into electricity addresses both energy needs and critical waste disposal challenges. The availability and sustainable sourcing of raw materials remain central to the market's dynamics, making the Bioenergy Feedstock Market a critical area of focus for investment and innovation.
Biomass Electric Power Generation Company Market Share
Macro tailwinds such as global climate change commitments, the pursuit of circular economy principles, and efforts to foster rural economic development through localized energy production significantly bolster market prospects. Innovations in biomass processing technologies, including advanced gasification, pyrolysis, and co-firing techniques, are continually improving the economic viability and environmental performance of biomass power generation. The ongoing push for the Renewable Energy Market at large ensures that biomass remains a vital component of the global energy transition, providing a baseline power source that complements other renewable technologies and contributes to a resilient energy infrastructure. The outlook remains positive, with continued investment in infrastructure, research, and policy support expected to solidify biomass's role in the future energy landscape.
Dominant Segment: Combustion Technology in Biomass Electric Power Generation Market
Within the diverse technological landscape of the Biomass Electric Power Generation Market, the combustion segment consistently maintains its position as the largest by revenue share. This dominance stems from its long history, proven reliability, and broad applicability across various scales and feedstock types. Direct combustion involves burning biomass in boilers to produce high-pressure steam, which then drives turbines to generate electricity. This method is well-established, offering high conversion efficiencies for a wide range of solid biomass, including wood chips, agricultural residues, and energy crops.
The ubiquity of combustion technology is further supported by its ability to handle diverse and sometimes heterogeneous feedstocks, a flexibility that other advanced technologies may struggle with. Facilities utilizing direct combustion can range from small-scale combined heat and power (CHP) plants providing energy to an Industrial Power Generation Market to large-scale utility operations integrated into the wider Utilities Power Generation Market. The mature nature of the Combustion Technology Market means that associated infrastructure, operational expertise, and supply chains are well-developed, contributing to lower perceived risk for investors and project developers.
Key players with significant contributions to this segment include established power generation equipment manufacturers and energy companies such as Babcock & Wilcox Enterprises, Inc., Siemens Energy, General Electric, EDF, and RWE. These companies provide everything from boiler systems and turbines to full plant engineering, procurement, and construction (EPC) services. While the direct combustion market is mature, it is far from stagnant. Innovations focus on improving efficiency, reducing emissions (e.g., advanced flue gas treatment), and enhancing fuel flexibility, including co-firing with other fuels like coal or natural gas to optimize performance and reduce environmental impact. Though other technologies like gasification and pyrolysis are gaining traction for their potential to produce higher-value bioproducts or more efficient energy conversion, the capital intensity and operational complexities often limit their immediate widespread adoption compared to the dependable nature of direct combustion. Similarly, the Anaerobic Digestion Market, while crucial for biogas production, typically addresses specific organic waste streams at a smaller scale compared to the bulk power generation capabilities of combustion plants. The enduring reliability and widespread application of direct combustion ensures its continued preeminence in the Biomass Electric Power Generation Market for the foreseeable future, albeit with continuous technological refinements to meet evolving environmental standards.
Key Market Drivers and Constraints in Biomass Electric Power Generation Market
The trajectory of the Biomass Electric Power Generation Market is significantly influenced by a confluence of potent drivers and inherent constraints, shaping its growth and innovation landscape.
Market Drivers:
- Global Decarbonization Mandates and Renewable Energy Targets: The worldwide push to mitigate climate change is a primary driver. For instance, the European Union's target to achieve at least 42.5% renewable energy share by 2030, with an ambition to reach 45%, directly fuels demand for dispatchable renewable sources like biomass. Such mandates provide long-term policy certainty and financial incentives for new project development in the Renewable Energy Market.
- Sustainable Waste Management Solutions: Rapid urbanization and industrial growth have led to an increase in organic waste generation. Global municipal solid waste generation is projected to reach 3.4 billion tons by 2050, creating a strong imperative for sustainable disposal methods. Biomass electric power generation, particularly the Waste-to-Energy Market segment, offers a dual solution by converting waste into energy while reducing landfill volumes and associated methane emissions.
- Enhanced Energy Security and Grid Stability: As countries seek to reduce reliance on volatile fossil fuel imports, biomass provides a domestically sourced, baseload-capable power option. Its ability to provide continuous power, unlike intermittent solar or wind, makes it valuable for grid stability, a critical factor for the Utilities Power Generation Market, ensuring a reliable power supply.
Market Constraints:
- Feedstock Availability, Sustainability, and Logistics Challenges: The primary constraint revolves around ensuring a consistent, economically viable, and sustainably sourced Bioenergy Feedstock Market. Competition for land use, ethical sourcing concerns related to deforestation, and the complex logistics of collecting, transporting, and pre-processing diverse biomass materials (such as agricultural and forest residues or Energy Crops Market) add significant operational costs and can impact project feasibility.
- High Capital Intensity and Operational Expenses: The initial capital expenditure (CAPEX) for developing biomass power plants can be substantial, often higher per megawatt than for some other renewable technologies. Additionally, ongoing operational costs are influenced by fluctuating feedstock prices, specialized maintenance requirements, and the need for sophisticated emissions control systems, impacting overall project economics.
- Public Perception and Environmental Scrutiny: Despite its renewable classification, biomass power generation faces scrutiny regarding its true carbon neutrality, especially for forest-derived feedstocks, and concerns over local air quality impacts from combustion emissions. Addressing these perceptions and ensuring robust life-cycle assessments are crucial for gaining public acceptance and securing regulatory support.
Competitive Ecosystem of Biomass Electric Power Generation Market
- SUEZ Group: A global leader in environmental services, SUEZ Group is significantly active in the waste-to-energy sector, leveraging its expertise in waste management to convert municipal and industrial organic waste into electricity and heat, particularly through biomass and anaerobic digestion processes.
- ENGIE: This multinational utility company is committed to accelerating the energy transition, with substantial investments in diverse renewable energy projects, including the development and operation of biomass power plants across its global portfolio.
- ACCIONA: A Spanish conglomerate with a strong and growing presence in renewable energy infrastructure, ACCIONA designs, builds, and operates biomass power facilities, contributing to its broad sustainable energy production capacity.
- EPH: As a prominent European energy group, EPH specializes in a balanced mix of conventional and renewable power generation, holding significant assets in biomass and waste-to-energy facilities throughout Central and Eastern Europe.
- Xcel Energy Inc.: A major U.S. utility company, Xcel Energy is actively pursuing a clean energy transition, integrating various renewable sources, including the strategic use of biomass power, into its expansive generation mix to serve its vast customer base.
- Ramboll Group A/S: A global engineering, architecture, and consultancy firm, Ramboll Group A/S provides comprehensive technical and strategic expertise for the development, optimization, and environmental assessment of biomass power projects worldwide.
- EDF: A leading global electricity company, EDF is actively engaged in renewable energy development, including large-scale biomass co-firing and dedicated biomass plants, diversifying its power generation assets to meet sustainability goals.
- Babcock & Wilcox Enterprises, Inc.: A prominent provider of advanced technologies and services for the power and environmental industries, Babcock & Wilcox is renowned for its expertise in biomass combustion systems, boilers, and associated equipment.
- Orsted A/S: While primarily known for offshore wind, Orsted has also undertaken significant projects in converting former coal-fired power plants into large-scale biomass facilities, contributing to sustainable energy supply in Europe.
- Ameresco: As a cleantech integrator, Ameresco specializes in energy efficiency and renewable energy solutions, including the development and operation of biomass and landfill gas-to-energy projects for various clients.
- Siemens Energy: A global energy technology company, Siemens Energy offers a broad portfolio of products and solutions for power generation, including steam turbines and integrated plant solutions adaptable for biomass-fired power facilities.
- Statkraft: Europe's largest generator of renewable energy, Statkraft maintains a diverse portfolio that encompasses hydropower, wind, solar, and a growing commitment to biomass energy production in its various operational regions.
- General Electric: A multinational conglomerate, General Electric provides advanced power generation technologies, including efficient steam turbines and overall plant solutions that are essential components for large-scale biomass power plants.
- RWE: A major German energy company, RWE is strategically expanding its renewable energy business, with extensive operations in biomass co-firing and dedicated biomass power generation as part of its decarbonization efforts.
- AXIS Tech: An innovative technology company, AXIS Tech likely focuses on specialized solutions for biomass energy, potentially offering advanced processing technologies or optimized system integration for various biomass-to-energy applications.
- Veolia: A global leader in optimized resource management, Veolia boasts extensive operations in waste management and waste-to-energy, converting various forms of biomass and urban waste into electricity and heat.
- Vattenfall: A Swedish state-owned power company, Vattenfall is committed to transitioning to fossil-free energy, operating several biomass-fueled combined heat and power plants that play a crucial role in district heating solutions.
- Infinite Energy Pvt. Ltd.: An emerging player, likely focused on developing smaller-scale or localized renewable energy projects, including those utilizing diverse biomass resources for power generation in specific markets.
Recent Developments & Milestones in Biomass Electric Power Generation Market
- January 2024: A major utility in Germany announced the successful conversion of a 200 MW coal-fired power plant to 100% sustainable biomass feedstock. This initiative is projected to reduce the plant's annual carbon footprint by an estimated 1.5 million tons and aligns with the nation's ambitious climate targets within the broader Renewable Energy Market.
- April 2023: A consortium comprising private equity investors and a leading European energy firm completed a $120 million investment round for a new advanced pyrolysis facility in Finland. The plant aims to produce high-value bio-oil and biocoal from forest residues, significantly enhancing energy recovery from sustainable forestry operations.
- August 2022: The U.S. Department of Energy awarded a $30 million grant to multiple research institutions. The funding is dedicated to optimizing the supply chain and logistics for agricultural residues, aiming to enhance the economic viability and scalability of new biomass electric power generation projects across the nation.
- November 2023: A significant strategic partnership was forged between a leading waste management company and an independent power producer in Southeast Asia. The collaboration focuses on developing multiple waste-to-energy plants with an aggregate capacity of 75 MW, utilizing municipal solid waste to address both energy demand and critical waste disposal challenges in urban areas.
- March 2024: New regulatory frameworks came into effect in Canada, providing enhanced incentives and long-term contracts for biomass co-firing projects. These policies are designed to promote the sustainable sourcing of woody biomass and further integrate dispatchable renewable energy into the national grid.
Regional Market Breakdown for Biomass Electric Power Generation Market
The Biomass Electric Power Generation Market exhibits distinct growth patterns and drivers across key global regions, reflecting diverse energy policies, resource availability, and economic conditions.
Asia Pacific stands out as the fastest-growing region, propelled by soaring energy demand, rapid urbanization, and persistent challenges in waste management. Countries like China, India, and those in ASEAN are heavily investing in biomass to manage agricultural and forest residues, alleviate energy poverty, and meet ambitious renewable energy targets. The region's vast agricultural output provides an abundant Bioenergy Feedstock Market, leading to significant growth in both large-scale industrial projects and smaller, decentralized power generation facilities. The imperative to address the growing volume of municipal solid waste also fuels expansion in the Waste-to-Energy Market segment across densely populated areas.
Europe represents a mature yet continually evolving market, characterized by strong policy support and an established infrastructure for biomass energy. Nations such as the UK, Germany, and the Nordics have substantial installed capacities, driven by ambitious decarbonization goals and the need for dispatchable renewable heat and power. The region leads in advanced biomass technologies, including combined heat and power (CHP) systems, and is a key market for the Anaerobic Digestion Market, converting organic waste into biogas. Sustainability criteria for biomass feedstock are particularly stringent here, influencing global trade flows.
North America holds a significant share, largely attributed to abundant forest resources and a focus on both utility-scale power generation and Industrial Power Generation Market applications, particularly in the forestry and pulp and paper industries. The market here is influenced by a patchwork of state and federal policies, with robust activity in states with strong renewable portfolio standards. Co-firing with coal remains a transitional strategy, while dedicated biomass plants utilize a mix of wood waste, agricultural residues, and increasingly, Energy Crops Market initiatives, though the latter face ongoing debates regarding land use and economic viability.
Middle East & Africa (MEA), while currently smaller, is an emerging market with substantial untapped potential. The region's growth is primarily driven by the need for energy access, waste management solutions in rapidly expanding cities, and diversification away from fossil fuels. Opportunities exist for developing waste-to-energy projects and utilizing agricultural residues, particularly in countries with significant agricultural sectors or large urban populations. Investment in biomass solutions here often targets rural electrification and sustainable development goals, attracting international funding and expertise.
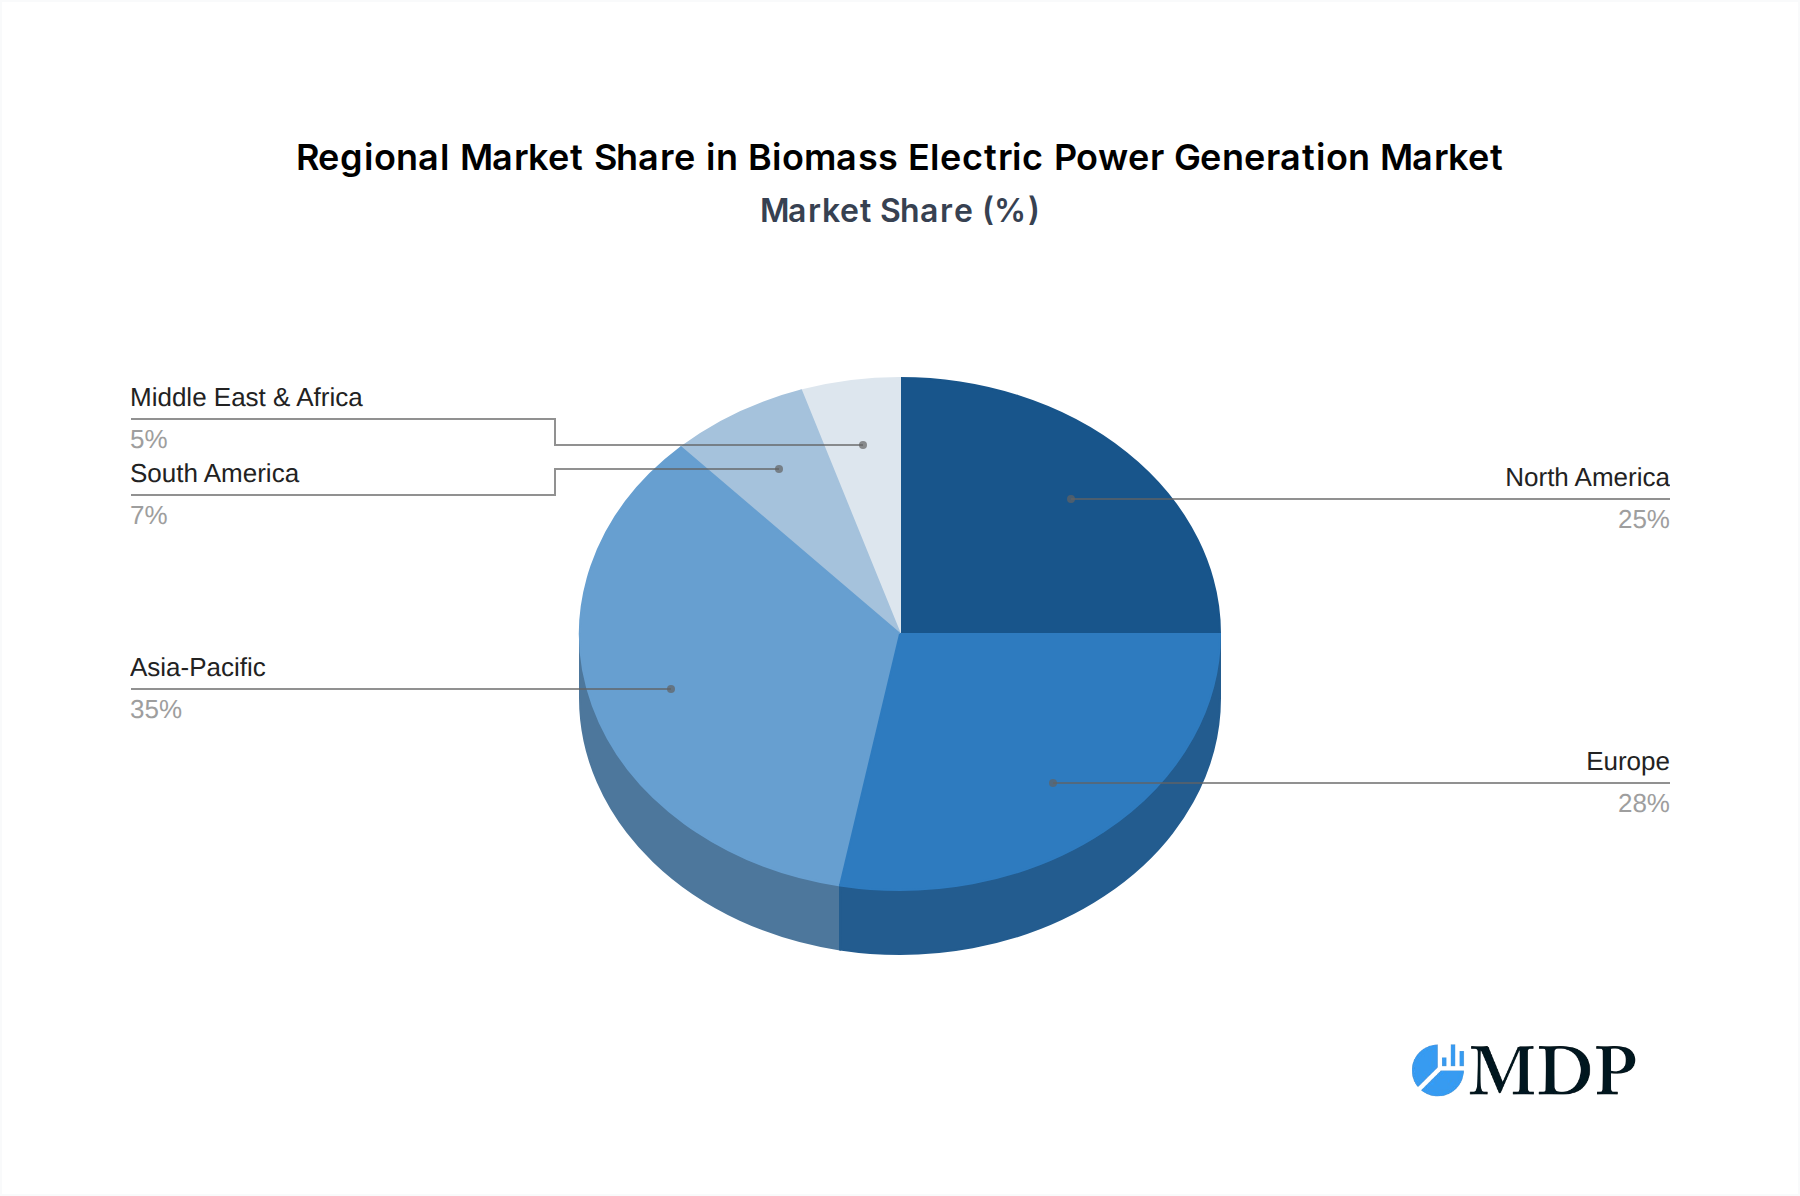
Biomass Electric Power Generation Regional Market Share
Export, Trade Flow & Tariff Impact on Biomass Electric Power Generation Market
The global Biomass Electric Power Generation Market is inextricably linked to international trade flows of processed biomass fuels, primarily wood pellets, wood chips, and other solid biofuels. These trade dynamics are critical for regions with limited domestic feedstock but robust demand for renewable energy.
Major Trade Corridors: The most significant trade corridor for solid biomass is from North America (primarily the United States and Canada) and increasingly from countries like Vietnam and Brazil, to Europe (especially the United Kingdom, Netherlands, Belgium, and Denmark) and Asia (Japan and South Korea). This transatlantic and transpacific trade facilitates the supply of sustainably certified wood pellets to large-scale converted coal power plants and dedicated biomass facilities.
Leading Exporters and Importers: The United States remains the largest exporter of wood pellets globally, followed by Canada and several European nations. These countries benefit from extensive forest resources and established forestry industries. On the importing side, the UK, Netherlands, and Denmark have been leading due to strong government support for biomass in their Renewable Energy Market portfolios, converting coal-fired plants. Japan and South Korea have rapidly increased their imports, driven by feed-in tariffs and renewable energy targets, particularly for co-firing applications and dedicated biomass power plants.
Tariff and Non-Tariff Barriers: Direct tariffs on biomass commodities are generally low or non-existent in major trading blocs, reflecting a policy stance that favors renewable energy. However, non-tariff barriers (NTBs) play a crucial role. These include stringent sustainability criteria, such as those mandated by European regulations (e.g., RED II), requiring proof of sustainable forest management, greenhouse gas emissions reductions throughout the supply chain, and biodiversity protection. Certification schemes like the Sustainable Biomass Program (SBP) or Forest Stewardship Council (FSC) are de facto requirements for market access. Recent trade policy shifts, such as heightened focus on carbon footprint and verifiable sustainability claims, can impact cross-border volumes by increasing compliance costs for producers and potentially limiting supply to premium markets. Furthermore, anti-dumping investigations, though rare, can arise if trade practices are perceived as unfair, disrupting established flows and adding uncertainty to the Bioenergy Feedstock Market.
Investment & Funding Activity in Biomass Electric Power Generation Market
Investment and funding activity in the Biomass Electric Power Generation Market has shown resilience and strategic reorientation over the past 2-3 years, driven by evolving decarbonization mandates and the pursuit of energy security. While large-scale greenfield project financing continues, there's a notable shift towards optimizing existing assets and exploring advanced conversion technologies.
Mergers & Acquisitions (M&A): The M&A landscape has been characterized by consolidation, with larger utilities and energy infrastructure funds acquiring operational biomass power plants or companies specializing in biomass project development. This trend is often driven by a desire to expand renewable energy portfolios, secure dispatchable generation capacity, and leverage synergies with existing energy assets. For instance, utilities seeking to diversify their power sources might acquire a regional independent power producer (IPP) with a portfolio of biomass plants, integrating them into their overall Utilities Power Generation Market strategy. These acquisitions often focus on facilities with secured feedstock supply and long-term power purchase agreements (PPAs).
Venture Funding & Private Equity: Venture capital (VC) and private equity (PE) funds are increasingly targeting innovative sub-segments within the biomass sector. Significant capital is flowing into advanced biofuels and biochemicals produced via pyrolysis or gasification, aiming to create higher-value products beyond electricity. Technologies that improve feedstock versatility, reduce emissions, or enhance efficiency in the Waste-to-Energy Market are particularly attractive. Companies developing solutions for pre-treatment of diverse organic wastes, or those working on next-generation anaerobic digestion systems, are seeing increased interest. This reflects a broader trend of seeking disruptive technologies that can unlock new revenue streams and improve the economic competitiveness of biomass.
Strategic Partnerships: Collaborations between technology providers, feedstock suppliers, and project developers are becoming more common. These partnerships aim to de-risk projects, optimize supply chains, and bring specialized expertise to complex biomass-to-energy initiatives. For example, a major agricultural firm might partner with an energy technology company to develop a facility utilizing agricultural residues, ensuring a stable Bioenergy Feedstock Market. International development banks and climate funds also play a crucial role, providing concessional financing and technical assistance for biomass projects in emerging markets, especially those that align with broader sustainable development goals. The drive towards a circular economy and the need for sustainable waste management are key motivators for these investments, identifying a clear opportunity for the Waste-to-Energy Market to attract substantial capital for expansion and technological upgrades.
Biomass Electric Power Generation Segmentation
-
1. Feedstock
- 1.1. Agricultural and Forest Residues
- 1.2. Energy Crops
- 1.3. Animal Waste
- 1.4. Municipal Solid Waste
- 1.5. Landfill Gas & Biogas
- 1.6. Algae
- 1.7. Others
-
2. Power Capacity
- 2.1. Below 10 MW
- 2.2. 10 MW to 50 MW
- 2.3. 51 MW to 100 MW
- 2.4. Above 100 MW
-
3. Technology
- 3.1. Combustion
- 3.2. Gasification
- 3.3. Anaerobic Digestion
- 3.4. Pyrolysis
- 3.5. Oil Exaction
- 3.6. Fermentation
-
4. End User
- 4.1. Utilities
- 4.2. Industrial Sector
- 4.3. Commercial Sector
- 4.4. Municipalities
- 4.5. Independent Power Producers (IPPs)
Biomass Electric Power Generation Segmentation By Geography
-
1. North America
- 1.1. United States
- 1.2. Canada
- 1.3. Mexico
-
2. South America
- 2.1. Brazil
- 2.2. Argentina
- 2.3. Rest of South America
-
3. Europe
- 3.1. United Kingdom
- 3.2. Germany
- 3.3. France
- 3.4. Italy
- 3.5. Spain
- 3.6. Russia
- 3.7. Benelux
- 3.8. Nordics
- 3.9. Rest of Europe
-
4. Middle East & Africa
- 4.1. Turkey
- 4.2. Israel
- 4.3. GCC
- 4.4. North Africa
- 4.5. South Africa
- 4.6. Rest of Middle East & Africa
-
5. Asia Pacific
- 5.1. China
- 5.2. India
- 5.3. Japan
- 5.4. South Korea
- 5.5. ASEAN
- 5.6. Oceania
- 5.7. Rest of Asia Pacific
Biomass Electric Power Generation Regional Market Share
Geographic Coverage of Biomass Electric Power Generation
Biomass Electric Power Generation REPORT HIGHLIGHTS
| Aspects | Details |
|---|---|
| Study Period | 2020-2034 |
| Base Year | 2025 |
| Estimated Year | 2026 |
| Forecast Period | 2026-2034 |
| Historical Period | 2020-2025 |
| Growth Rate | CAGR of 3.4% from 2020-2034 |
| Segmentation |
|
Table of Contents
- 1. Introduction
- 1.1. Research Scope
- 1.2. Market Segmentation
- 1.3. Research Objective
- 1.4. Definitions and Assumptions
- 2. Executive Summary
- 2.1. Market Snapshot
- 3. Market Dynamics
- 3.1. Market Drivers
- 3.2. Market Restrains
- 3.3. Market Trends
- 3.4. Market Opportunities
- 4. Market Factor Analysis
- 4.1. Porters Five Forces
- 4.1.1. Bargaining Power of Suppliers
- 4.1.2. Bargaining Power of Buyers
- 4.1.3. Threat of New Entrants
- 4.1.4. Threat of Substitutes
- 4.1.5. Competitive Rivalry
- 4.2. PESTEL analysis
- 4.3. BCG Analysis
- 4.3.1. Stars (High Growth, High Market Share)
- 4.3.2. Cash Cows (Low Growth, High Market Share)
- 4.3.3. Question Mark (High Growth, Low Market Share)
- 4.3.4. Dogs (Low Growth, Low Market Share)
- 4.4. Ansoff Matrix Analysis
- 4.5. Supply Chain Analysis
- 4.6. Regulatory Landscape
- 4.7. Current Market Potential and Opportunity Assessment (TAM–SAM–SOM Framework)
- 4.8. MDP Analyst Note
- 4.1. Porters Five Forces
- 5. Market Analysis, Insights and Forecast 2021-2033
- 5.1. Market Analysis, Insights and Forecast - by Feedstock
- 5.1.1. Agricultural and Forest Residues
- 5.1.2. Energy Crops
- 5.1.3. Animal Waste
- 5.1.4. Municipal Solid Waste
- 5.1.5. Landfill Gas & Biogas
- 5.1.6. Algae
- 5.1.7. Others
- 5.2. Market Analysis, Insights and Forecast - by Power Capacity
- 5.2.1. Below 10 MW
- 5.2.2. 10 MW to 50 MW
- 5.2.3. 51 MW to 100 MW
- 5.2.4. Above 100 MW
- 5.3. Market Analysis, Insights and Forecast - by Technology
- 5.3.1. Combustion
- 5.3.2. Gasification
- 5.3.3. Anaerobic Digestion
- 5.3.4. Pyrolysis
- 5.3.5. Oil Exaction
- 5.3.6. Fermentation
- 5.4. Market Analysis, Insights and Forecast - by End User
- 5.4.1. Utilities
- 5.4.2. Industrial Sector
- 5.4.3. Commercial Sector
- 5.4.4. Municipalities
- 5.4.5. Independent Power Producers (IPPs)
- 5.5. Market Analysis, Insights and Forecast - by Region
- 5.5.1. North America
- 5.5.2. South America
- 5.5.3. Europe
- 5.5.4. Middle East & Africa
- 5.5.5. Asia Pacific
- 5.1. Market Analysis, Insights and Forecast - by Feedstock
- 6. Global Biomass Electric Power Generation Analysis, Insights and Forecast, 2021-2033
- 6.1. Market Analysis, Insights and Forecast - by Feedstock
- 6.1.1. Agricultural and Forest Residues
- 6.1.2. Energy Crops
- 6.1.3. Animal Waste
- 6.1.4. Municipal Solid Waste
- 6.1.5. Landfill Gas & Biogas
- 6.1.6. Algae
- 6.1.7. Others
- 6.2. Market Analysis, Insights and Forecast - by Power Capacity
- 6.2.1. Below 10 MW
- 6.2.2. 10 MW to 50 MW
- 6.2.3. 51 MW to 100 MW
- 6.2.4. Above 100 MW
- 6.3. Market Analysis, Insights and Forecast - by Technology
- 6.3.1. Combustion
- 6.3.2. Gasification
- 6.3.3. Anaerobic Digestion
- 6.3.4. Pyrolysis
- 6.3.5. Oil Exaction
- 6.3.6. Fermentation
- 6.4. Market Analysis, Insights and Forecast - by End User
- 6.4.1. Utilities
- 6.4.2. Industrial Sector
- 6.4.3. Commercial Sector
- 6.4.4. Municipalities
- 6.4.5. Independent Power Producers (IPPs)
- 6.1. Market Analysis, Insights and Forecast - by Feedstock
- 7. North America Biomass Electric Power Generation Analysis, Insights and Forecast, 2020-2032
- 7.1. Market Analysis, Insights and Forecast - by Feedstock
- 7.1.1. Agricultural and Forest Residues
- 7.1.2. Energy Crops
- 7.1.3. Animal Waste
- 7.1.4. Municipal Solid Waste
- 7.1.5. Landfill Gas & Biogas
- 7.1.6. Algae
- 7.1.7. Others
- 7.2. Market Analysis, Insights and Forecast - by Power Capacity
- 7.2.1. Below 10 MW
- 7.2.2. 10 MW to 50 MW
- 7.2.3. 51 MW to 100 MW
- 7.2.4. Above 100 MW
- 7.3. Market Analysis, Insights and Forecast - by Technology
- 7.3.1. Combustion
- 7.3.2. Gasification
- 7.3.3. Anaerobic Digestion
- 7.3.4. Pyrolysis
- 7.3.5. Oil Exaction
- 7.3.6. Fermentation
- 7.4. Market Analysis, Insights and Forecast - by End User
- 7.4.1. Utilities
- 7.4.2. Industrial Sector
- 7.4.3. Commercial Sector
- 7.4.4. Municipalities
- 7.4.5. Independent Power Producers (IPPs)
- 7.1. Market Analysis, Insights and Forecast - by Feedstock
- 8. South America Biomass Electric Power Generation Analysis, Insights and Forecast, 2020-2032
- 8.1. Market Analysis, Insights and Forecast - by Feedstock
- 8.1.1. Agricultural and Forest Residues
- 8.1.2. Energy Crops
- 8.1.3. Animal Waste
- 8.1.4. Municipal Solid Waste
- 8.1.5. Landfill Gas & Biogas
- 8.1.6. Algae
- 8.1.7. Others
- 8.2. Market Analysis, Insights and Forecast - by Power Capacity
- 8.2.1. Below 10 MW
- 8.2.2. 10 MW to 50 MW
- 8.2.3. 51 MW to 100 MW
- 8.2.4. Above 100 MW
- 8.3. Market Analysis, Insights and Forecast - by Technology
- 8.3.1. Combustion
- 8.3.2. Gasification
- 8.3.3. Anaerobic Digestion
- 8.3.4. Pyrolysis
- 8.3.5. Oil Exaction
- 8.3.6. Fermentation
- 8.4. Market Analysis, Insights and Forecast - by End User
- 8.4.1. Utilities
- 8.4.2. Industrial Sector
- 8.4.3. Commercial Sector
- 8.4.4. Municipalities
- 8.4.5. Independent Power Producers (IPPs)
- 8.1. Market Analysis, Insights and Forecast - by Feedstock
- 9. Europe Biomass Electric Power Generation Analysis, Insights and Forecast, 2020-2032
- 9.1. Market Analysis, Insights and Forecast - by Feedstock
- 9.1.1. Agricultural and Forest Residues
- 9.1.2. Energy Crops
- 9.1.3. Animal Waste
- 9.1.4. Municipal Solid Waste
- 9.1.5. Landfill Gas & Biogas
- 9.1.6. Algae
- 9.1.7. Others
- 9.2. Market Analysis, Insights and Forecast - by Power Capacity
- 9.2.1. Below 10 MW
- 9.2.2. 10 MW to 50 MW
- 9.2.3. 51 MW to 100 MW
- 9.2.4. Above 100 MW
- 9.3. Market Analysis, Insights and Forecast - by Technology
- 9.3.1. Combustion
- 9.3.2. Gasification
- 9.3.3. Anaerobic Digestion
- 9.3.4. Pyrolysis
- 9.3.5. Oil Exaction
- 9.3.6. Fermentation
- 9.4. Market Analysis, Insights and Forecast - by End User
- 9.4.1. Utilities
- 9.4.2. Industrial Sector
- 9.4.3. Commercial Sector
- 9.4.4. Municipalities
- 9.4.5. Independent Power Producers (IPPs)
- 9.1. Market Analysis, Insights and Forecast - by Feedstock
- 10. Middle East & Africa Biomass Electric Power Generation Analysis, Insights and Forecast, 2020-2032
- 10.1. Market Analysis, Insights and Forecast - by Feedstock
- 10.1.1. Agricultural and Forest Residues
- 10.1.2. Energy Crops
- 10.1.3. Animal Waste
- 10.1.4. Municipal Solid Waste
- 10.1.5. Landfill Gas & Biogas
- 10.1.6. Algae
- 10.1.7. Others
- 10.2. Market Analysis, Insights and Forecast - by Power Capacity
- 10.2.1. Below 10 MW
- 10.2.2. 10 MW to 50 MW
- 10.2.3. 51 MW to 100 MW
- 10.2.4. Above 100 MW
- 10.3. Market Analysis, Insights and Forecast - by Technology
- 10.3.1. Combustion
- 10.3.2. Gasification
- 10.3.3. Anaerobic Digestion
- 10.3.4. Pyrolysis
- 10.3.5. Oil Exaction
- 10.3.6. Fermentation
- 10.4. Market Analysis, Insights and Forecast - by End User
- 10.4.1. Utilities
- 10.4.2. Industrial Sector
- 10.4.3. Commercial Sector
- 10.4.4. Municipalities
- 10.4.5. Independent Power Producers (IPPs)
- 10.1. Market Analysis, Insights and Forecast - by Feedstock
- 11. Asia Pacific Biomass Electric Power Generation Analysis, Insights and Forecast, 2020-2032
- 11.1. Market Analysis, Insights and Forecast - by Feedstock
- 11.1.1. Agricultural and Forest Residues
- 11.1.2. Energy Crops
- 11.1.3. Animal Waste
- 11.1.4. Municipal Solid Waste
- 11.1.5. Landfill Gas & Biogas
- 11.1.6. Algae
- 11.1.7. Others
- 11.2. Market Analysis, Insights and Forecast - by Power Capacity
- 11.2.1. Below 10 MW
- 11.2.2. 10 MW to 50 MW
- 11.2.3. 51 MW to 100 MW
- 11.2.4. Above 100 MW
- 11.3. Market Analysis, Insights and Forecast - by Technology
- 11.3.1. Combustion
- 11.3.2. Gasification
- 11.3.3. Anaerobic Digestion
- 11.3.4. Pyrolysis
- 11.3.5. Oil Exaction
- 11.3.6. Fermentation
- 11.4. Market Analysis, Insights and Forecast - by End User
- 11.4.1. Utilities
- 11.4.2. Industrial Sector
- 11.4.3. Commercial Sector
- 11.4.4. Municipalities
- 11.4.5. Independent Power Producers (IPPs)
- 11.1. Market Analysis, Insights and Forecast - by Feedstock
- 12. Competitive Analysis
- 12.1. Company Profiles
- 12.1.1 SUEZ Group
- 12.1.1.1. Company Overview
- 12.1.1.2. Products
- 12.1.1.3. Company Financials
- 12.1.1.4. SWOT Analysis
- 12.1.2 ENGIE
- 12.1.2.1. Company Overview
- 12.1.2.2. Products
- 12.1.2.3. Company Financials
- 12.1.2.4. SWOT Analysis
- 12.1.3 ACCIONA
- 12.1.3.1. Company Overview
- 12.1.3.2. Products
- 12.1.3.3. Company Financials
- 12.1.3.4. SWOT Analysis
- 12.1.4 EPH
- 12.1.4.1. Company Overview
- 12.1.4.2. Products
- 12.1.4.3. Company Financials
- 12.1.4.4. SWOT Analysis
- 12.1.5 Xcel Energy Inc.
- 12.1.5.1. Company Overview
- 12.1.5.2. Products
- 12.1.5.3. Company Financials
- 12.1.5.4. SWOT Analysis
- 12.1.6 Ramboll Group A/S
- 12.1.6.1. Company Overview
- 12.1.6.2. Products
- 12.1.6.3. Company Financials
- 12.1.6.4. SWOT Analysis
- 12.1.7 EDF
- 12.1.7.1. Company Overview
- 12.1.7.2. Products
- 12.1.7.3. Company Financials
- 12.1.7.4. SWOT Analysis
- 12.1.8 Babcock & Wilcox Enterprises Inc.
- 12.1.8.1. Company Overview
- 12.1.8.2. Products
- 12.1.8.3. Company Financials
- 12.1.8.4. SWOT Analysis
- 12.1.9 Orsted A/S
- 12.1.9.1. Company Overview
- 12.1.9.2. Products
- 12.1.9.3. Company Financials
- 12.1.9.4. SWOT Analysis
- 12.1.10 Ameresco
- 12.1.10.1. Company Overview
- 12.1.10.2. Products
- 12.1.10.3. Company Financials
- 12.1.10.4. SWOT Analysis
- 12.1.11 Siemens Energy
- 12.1.11.1. Company Overview
- 12.1.11.2. Products
- 12.1.11.3. Company Financials
- 12.1.11.4. SWOT Analysis
- 12.1.12 Statkraft
- 12.1.12.1. Company Overview
- 12.1.12.2. Products
- 12.1.12.3. Company Financials
- 12.1.12.4. SWOT Analysis
- 12.1.13 General Electric
- 12.1.13.1. Company Overview
- 12.1.13.2. Products
- 12.1.13.3. Company Financials
- 12.1.13.4. SWOT Analysis
- 12.1.14 RWE
- 12.1.14.1. Company Overview
- 12.1.14.2. Products
- 12.1.14.3. Company Financials
- 12.1.14.4. SWOT Analysis
- 12.1.15 AXIS Tech
- 12.1.15.1. Company Overview
- 12.1.15.2. Products
- 12.1.15.3. Company Financials
- 12.1.15.4. SWOT Analysis
- 12.1.16 Veolia
- 12.1.16.1. Company Overview
- 12.1.16.2. Products
- 12.1.16.3. Company Financials
- 12.1.16.4. SWOT Analysis
- 12.1.17 Vattenfall
- 12.1.17.1. Company Overview
- 12.1.17.2. Products
- 12.1.17.3. Company Financials
- 12.1.17.4. SWOT Analysis
- 12.1.18 Infinite Energy Pvt. Ltd.
- 12.1.18.1. Company Overview
- 12.1.18.2. Products
- 12.1.18.3. Company Financials
- 12.1.18.4. SWOT Analysis
- 12.1.19 Others
- 12.1.19.1. Company Overview
- 12.1.19.2. Products
- 12.1.19.3. Company Financials
- 12.1.19.4. SWOT Analysis
- 12.1.1 SUEZ Group
- 12.2. Market Entropy
- 12.2.1 Company's Key Areas Served
- 12.2.2 Recent Developments
- 12.3. Company Market Share Analysis 2025
- 12.3.1 Top 5 Companies Market Share Analysis
- 12.3.2 Top 3 Companies Market Share Analysis
- 12.4. List of Potential Customers
- 13. Research Methodology
List of Figures
- Figure 1: Global Biomass Electric Power Generation Revenue Breakdown (million, %) by Region 2025 & 2033
- Figure 2: North America Biomass Electric Power Generation Revenue (million), by Feedstock 2025 & 2033
- Figure 3: North America Biomass Electric Power Generation Revenue Share (%), by Feedstock 2025 & 2033
- Figure 4: North America Biomass Electric Power Generation Revenue (million), by Power Capacity 2025 & 2033
- Figure 5: North America Biomass Electric Power Generation Revenue Share (%), by Power Capacity 2025 & 2033
- Figure 6: North America Biomass Electric Power Generation Revenue (million), by Technology 2025 & 2033
- Figure 7: North America Biomass Electric Power Generation Revenue Share (%), by Technology 2025 & 2033
- Figure 8: North America Biomass Electric Power Generation Revenue (million), by End User 2025 & 2033
- Figure 9: North America Biomass Electric Power Generation Revenue Share (%), by End User 2025 & 2033
- Figure 10: North America Biomass Electric Power Generation Revenue (million), by Country 2025 & 2033
- Figure 11: North America Biomass Electric Power Generation Revenue Share (%), by Country 2025 & 2033
- Figure 12: South America Biomass Electric Power Generation Revenue (million), by Feedstock 2025 & 2033
- Figure 13: South America Biomass Electric Power Generation Revenue Share (%), by Feedstock 2025 & 2033
- Figure 14: South America Biomass Electric Power Generation Revenue (million), by Power Capacity 2025 & 2033
- Figure 15: South America Biomass Electric Power Generation Revenue Share (%), by Power Capacity 2025 & 2033
- Figure 16: South America Biomass Electric Power Generation Revenue (million), by Technology 2025 & 2033
- Figure 17: South America Biomass Electric Power Generation Revenue Share (%), by Technology 2025 & 2033
- Figure 18: South America Biomass Electric Power Generation Revenue (million), by End User 2025 & 2033
- Figure 19: South America Biomass Electric Power Generation Revenue Share (%), by End User 2025 & 2033
- Figure 20: South America Biomass Electric Power Generation Revenue (million), by Country 2025 & 2033
- Figure 21: South America Biomass Electric Power Generation Revenue Share (%), by Country 2025 & 2033
- Figure 22: Europe Biomass Electric Power Generation Revenue (million), by Feedstock 2025 & 2033
- Figure 23: Europe Biomass Electric Power Generation Revenue Share (%), by Feedstock 2025 & 2033
- Figure 24: Europe Biomass Electric Power Generation Revenue (million), by Power Capacity 2025 & 2033
- Figure 25: Europe Biomass Electric Power Generation Revenue Share (%), by Power Capacity 2025 & 2033
- Figure 26: Europe Biomass Electric Power Generation Revenue (million), by Technology 2025 & 2033
- Figure 27: Europe Biomass Electric Power Generation Revenue Share (%), by Technology 2025 & 2033
- Figure 28: Europe Biomass Electric Power Generation Revenue (million), by End User 2025 & 2033
- Figure 29: Europe Biomass Electric Power Generation Revenue Share (%), by End User 2025 & 2033
- Figure 30: Europe Biomass Electric Power Generation Revenue (million), by Country 2025 & 2033
- Figure 31: Europe Biomass Electric Power Generation Revenue Share (%), by Country 2025 & 2033
- Figure 32: Middle East & Africa Biomass Electric Power Generation Revenue (million), by Feedstock 2025 & 2033
- Figure 33: Middle East & Africa Biomass Electric Power Generation Revenue Share (%), by Feedstock 2025 & 2033
- Figure 34: Middle East & Africa Biomass Electric Power Generation Revenue (million), by Power Capacity 2025 & 2033
- Figure 35: Middle East & Africa Biomass Electric Power Generation Revenue Share (%), by Power Capacity 2025 & 2033
- Figure 36: Middle East & Africa Biomass Electric Power Generation Revenue (million), by Technology 2025 & 2033
- Figure 37: Middle East & Africa Biomass Electric Power Generation Revenue Share (%), by Technology 2025 & 2033
- Figure 38: Middle East & Africa Biomass Electric Power Generation Revenue (million), by End User 2025 & 2033
- Figure 39: Middle East & Africa Biomass Electric Power Generation Revenue Share (%), by End User 2025 & 2033
- Figure 40: Middle East & Africa Biomass Electric Power Generation Revenue (million), by Country 2025 & 2033
- Figure 41: Middle East & Africa Biomass Electric Power Generation Revenue Share (%), by Country 2025 & 2033
- Figure 42: Asia Pacific Biomass Electric Power Generation Revenue (million), by Feedstock 2025 & 2033
- Figure 43: Asia Pacific Biomass Electric Power Generation Revenue Share (%), by Feedstock 2025 & 2033
- Figure 44: Asia Pacific Biomass Electric Power Generation Revenue (million), by Power Capacity 2025 & 2033
- Figure 45: Asia Pacific Biomass Electric Power Generation Revenue Share (%), by Power Capacity 2025 & 2033
- Figure 46: Asia Pacific Biomass Electric Power Generation Revenue (million), by Technology 2025 & 2033
- Figure 47: Asia Pacific Biomass Electric Power Generation Revenue Share (%), by Technology 2025 & 2033
- Figure 48: Asia Pacific Biomass Electric Power Generation Revenue (million), by End User 2025 & 2033
- Figure 49: Asia Pacific Biomass Electric Power Generation Revenue Share (%), by End User 2025 & 2033
- Figure 50: Asia Pacific Biomass Electric Power Generation Revenue (million), by Country 2025 & 2033
- Figure 51: Asia Pacific Biomass Electric Power Generation Revenue Share (%), by Country 2025 & 2033
List of Tables
- Table 1: Global Biomass Electric Power Generation Revenue million Forecast, by Feedstock 2020 & 2033
- Table 2: Global Biomass Electric Power Generation Revenue million Forecast, by Power Capacity 2020 & 2033
- Table 3: Global Biomass Electric Power Generation Revenue million Forecast, by Technology 2020 & 2033
- Table 4: Global Biomass Electric Power Generation Revenue million Forecast, by End User 2020 & 2033
- Table 5: Global Biomass Electric Power Generation Revenue million Forecast, by Region 2020 & 2033
- Table 6: Global Biomass Electric Power Generation Revenue million Forecast, by Feedstock 2020 & 2033
- Table 7: Global Biomass Electric Power Generation Revenue million Forecast, by Power Capacity 2020 & 2033
- Table 8: Global Biomass Electric Power Generation Revenue million Forecast, by Technology 2020 & 2033
- Table 9: Global Biomass Electric Power Generation Revenue million Forecast, by End User 2020 & 2033
- Table 10: Global Biomass Electric Power Generation Revenue million Forecast, by Country 2020 & 2033
- Table 11: United States Biomass Electric Power Generation Revenue (million) Forecast, by Application 2020 & 2033
- Table 12: Canada Biomass Electric Power Generation Revenue (million) Forecast, by Application 2020 & 2033
- Table 13: Mexico Biomass Electric Power Generation Revenue (million) Forecast, by Application 2020 & 2033
- Table 14: Global Biomass Electric Power Generation Revenue million Forecast, by Feedstock 2020 & 2033
- Table 15: Global Biomass Electric Power Generation Revenue million Forecast, by Power Capacity 2020 & 2033
- Table 16: Global Biomass Electric Power Generation Revenue million Forecast, by Technology 2020 & 2033
- Table 17: Global Biomass Electric Power Generation Revenue million Forecast, by End User 2020 & 2033
- Table 18: Global Biomass Electric Power Generation Revenue million Forecast, by Country 2020 & 2033
- Table 19: Brazil Biomass Electric Power Generation Revenue (million) Forecast, by Application 2020 & 2033
- Table 20: Argentina Biomass Electric Power Generation Revenue (million) Forecast, by Application 2020 & 2033
- Table 21: Rest of South America Biomass Electric Power Generation Revenue (million) Forecast, by Application 2020 & 2033
- Table 22: Global Biomass Electric Power Generation Revenue million Forecast, by Feedstock 2020 & 2033
- Table 23: Global Biomass Electric Power Generation Revenue million Forecast, by Power Capacity 2020 & 2033
- Table 24: Global Biomass Electric Power Generation Revenue million Forecast, by Technology 2020 & 2033
- Table 25: Global Biomass Electric Power Generation Revenue million Forecast, by End User 2020 & 2033
- Table 26: Global Biomass Electric Power Generation Revenue million Forecast, by Country 2020 & 2033
- Table 27: United Kingdom Biomass Electric Power Generation Revenue (million) Forecast, by Application 2020 & 2033
- Table 28: Germany Biomass Electric Power Generation Revenue (million) Forecast, by Application 2020 & 2033
- Table 29: France Biomass Electric Power Generation Revenue (million) Forecast, by Application 2020 & 2033
- Table 30: Italy Biomass Electric Power Generation Revenue (million) Forecast, by Application 2020 & 2033
- Table 31: Spain Biomass Electric Power Generation Revenue (million) Forecast, by Application 2020 & 2033
- Table 32: Russia Biomass Electric Power Generation Revenue (million) Forecast, by Application 2020 & 2033
- Table 33: Benelux Biomass Electric Power Generation Revenue (million) Forecast, by Application 2020 & 2033
- Table 34: Nordics Biomass Electric Power Generation Revenue (million) Forecast, by Application 2020 & 2033
- Table 35: Rest of Europe Biomass Electric Power Generation Revenue (million) Forecast, by Application 2020 & 2033
- Table 36: Global Biomass Electric Power Generation Revenue million Forecast, by Feedstock 2020 & 2033
- Table 37: Global Biomass Electric Power Generation Revenue million Forecast, by Power Capacity 2020 & 2033
- Table 38: Global Biomass Electric Power Generation Revenue million Forecast, by Technology 2020 & 2033
- Table 39: Global Biomass Electric Power Generation Revenue million Forecast, by End User 2020 & 2033
- Table 40: Global Biomass Electric Power Generation Revenue million Forecast, by Country 2020 & 2033
- Table 41: Turkey Biomass Electric Power Generation Revenue (million) Forecast, by Application 2020 & 2033
- Table 42: Israel Biomass Electric Power Generation Revenue (million) Forecast, by Application 2020 & 2033
- Table 43: GCC Biomass Electric Power Generation Revenue (million) Forecast, by Application 2020 & 2033
- Table 44: North Africa Biomass Electric Power Generation Revenue (million) Forecast, by Application 2020 & 2033
- Table 45: South Africa Biomass Electric Power Generation Revenue (million) Forecast, by Application 2020 & 2033
- Table 46: Rest of Middle East & Africa Biomass Electric Power Generation Revenue (million) Forecast, by Application 2020 & 2033
- Table 47: Global Biomass Electric Power Generation Revenue million Forecast, by Feedstock 2020 & 2033
- Table 48: Global Biomass Electric Power Generation Revenue million Forecast, by Power Capacity 2020 & 2033
- Table 49: Global Biomass Electric Power Generation Revenue million Forecast, by Technology 2020 & 2033
- Table 50: Global Biomass Electric Power Generation Revenue million Forecast, by End User 2020 & 2033
- Table 51: Global Biomass Electric Power Generation Revenue million Forecast, by Country 2020 & 2033
- Table 52: China Biomass Electric Power Generation Revenue (million) Forecast, by Application 2020 & 2033
- Table 53: India Biomass Electric Power Generation Revenue (million) Forecast, by Application 2020 & 2033
- Table 54: Japan Biomass Electric Power Generation Revenue (million) Forecast, by Application 2020 & 2033
- Table 55: South Korea Biomass Electric Power Generation Revenue (million) Forecast, by Application 2020 & 2033
- Table 56: ASEAN Biomass Electric Power Generation Revenue (million) Forecast, by Application 2020 & 2033
- Table 57: Oceania Biomass Electric Power Generation Revenue (million) Forecast, by Application 2020 & 2033
- Table 58: Rest of Asia Pacific Biomass Electric Power Generation Revenue (million) Forecast, by Application 2020 & 2033
Frequently Asked Questions
1. What is the projected Compound Annual Growth Rate (CAGR) of the Biomass Electric Power Generation?
The projected CAGR is approximately 3.4%.
2. Which companies are prominent players in the Biomass Electric Power Generation?
Key companies in the market include SUEZ Group , ENGIE, ACCIONA, EPH, Xcel Energy Inc., Ramboll Group A/S, EDF, Babcock & Wilcox Enterprises, Inc., Orsted A/S, Ameresco, Siemens Energy, Statkraft, General Electric, RWE, AXIS Tech, Veolia, Vattenfall, Infinite Energy Pvt. Ltd., Others.
3. What are the main segments of the Biomass Electric Power Generation?
The market segments include Feedstock, Power Capacity, Technology, End User.
4. Can you provide details about the market size?
The market size is estimated to be USD 45750 million as of 2022.
5. What are some drivers contributing to market growth?
N/A
6. What are the notable trends driving market growth?
N/A
7. Are there any restraints impacting market growth?
N/A
8. Can you provide examples of recent developments in the market?
N/A
9. What pricing options are available for accessing the report?
Pricing options include single-user, multi-user, and enterprise licenses priced at USD 4900.00, USD 7350.00, and USD 9800.00 respectively.
10. Is the market size provided in terms of value or volume?
The market size is provided in terms of value, measured in million.
11. Are there any specific market keywords associated with the report?
Yes, the market keyword associated with the report is "Biomass Electric Power Generation," which aids in identifying and referencing the specific market segment covered.
12. How do I determine which pricing option suits my needs best?
The pricing options vary based on user requirements and access needs. Individual users may opt for single-user licenses, while businesses requiring broader access may choose multi-user or enterprise licenses for cost-effective access to the report.
13. Are there any additional resources or data provided in the Biomass Electric Power Generation report?
While the report offers comprehensive insights, it's advisable to review the specific contents or supplementary materials provided to ascertain if additional resources or data are available.
14. How can I stay updated on further developments or reports in the Biomass Electric Power Generation?
To stay informed about further developments, trends, and reports in the Biomass Electric Power Generation, consider subscribing to industry newsletters, following relevant companies and organizations, or regularly checking reputable industry news sources and publications.
Methodology
Step 1 - Identification of Relevant Samples Size from Population Database


Step 2 - Approaches for Defining Global Market Size (Value, Volume* & Price*)

Note*: In applicable scenarios
Step 3 - Data Sources
Primary Research
- Web Analytics
- Survey Reports
- Research Institute
- Latest Research Reports
- Opinion Leaders
Secondary Research
- Annual Reports
- White Paper
- Latest Press Release
- Industry Association
- Paid Database
- Investor Presentations

Step 4 - Data Triangulation
Involves using different sources of information in order to increase the validity of a study
These sources are likely to be stakeholders in a program - participants, other researchers, program staff, other community members, and so on.
Then we put all data in single framework & apply various statistical tools to find out the dynamic on the market.
During the analysis stage, feedback from the stakeholder groups would be compared to determine areas of agreement as well as areas of divergence