

Key Insights
The global autologous cell therapy market, projected at $11.41 billion in 2025, is forecast to achieve substantial expansion, reaching an estimated value by 2033 with a Compound Annual Growth Rate (CAGR) of 18.9%. This robust growth trajectory is propelled by significant advancements in cell processing technologies, enhancing efficiency and scalability in autologous cell therapy production, thereby improving treatment outcomes and reducing costs. The rising incidence of chronic conditions, including cancer, musculoskeletal disorders, and autoimmune diseases, is driving demand for advanced therapeutic modalities, positioning autologous cell therapies as a leading solution. Favorable regulatory frameworks and increased R&D investments further accelerate market expansion. The oncology segment currently leads market share due to its proven efficacy in certain cancer treatments. However, significant growth opportunities are emerging in applications for musculoskeletal and autoimmune diseases as research progresses and new therapies gain regulatory approval.
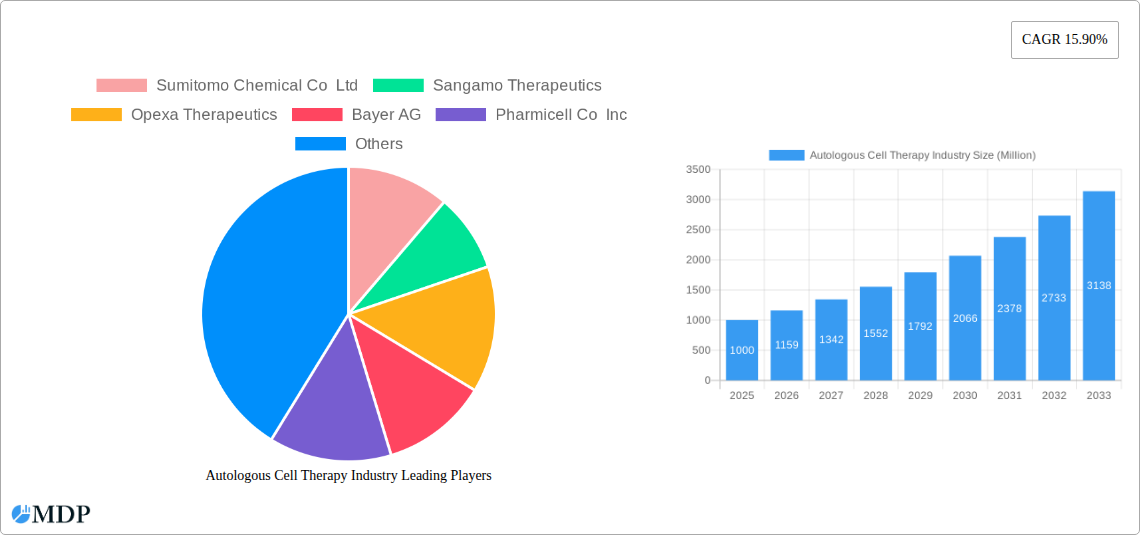
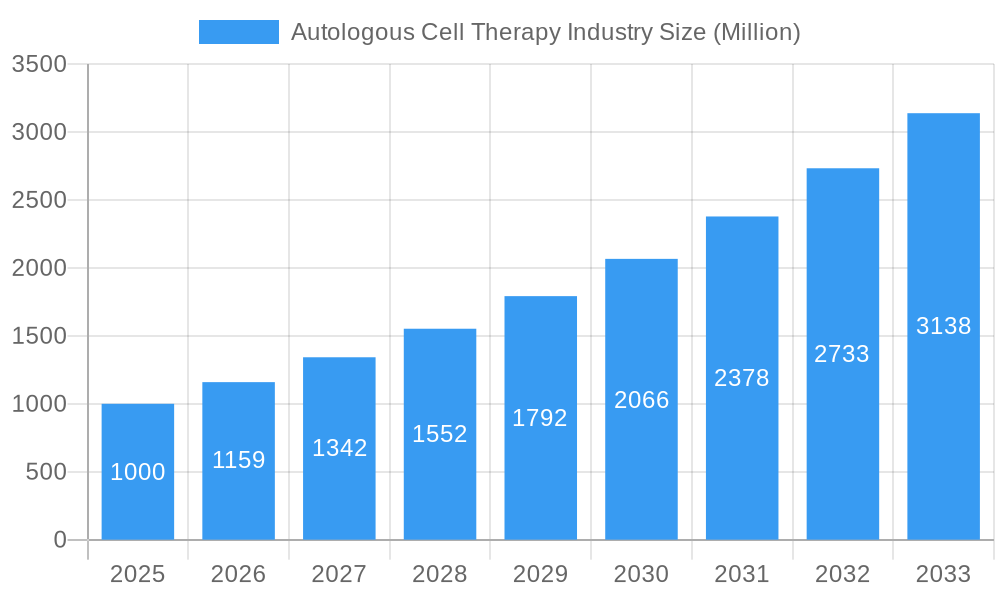
Autologous Cell Therapy Industry Market Size (In Billion)
The autologous cell therapy market is a dynamic landscape featuring established pharmaceutical corporations and emerging biotechnology innovators. Intensifying competition is anticipated as new entrants are attracted by the significant revenue prospects. Geographically, North America commands a leading market share, supported by its sophisticated healthcare infrastructure, substantial R&D expenditures, and early adoption of novel treatments. Nonetheless, the Asia Pacific region is poised for accelerated growth, driven by its expanding healthcare sector and increasing prevalence of target diseases. Market segmentation highlights autologous stem cell therapy as the dominant segment, with autologous cellular immunotherapies also showing strong performance. While bone marrow remains a primary cell source, other sources like epidermis are gaining prominence. Key challenges include the heterogeneity of treatment approaches and high manufacturing and administration costs. Continued research focused on cost-effectiveness and accessibility is critical for sustained market growth.
Autologous Cell Therapy Industry Company Market Share
Autologous Cell Therapy Industry: A Comprehensive Market Report (2019-2033)
This comprehensive report provides a detailed analysis of the global autologous cell therapy market, encompassing market dynamics, leading players, emerging trends, and future growth prospects. With a focus on actionable insights and data-driven projections, this report is an indispensable resource for industry stakeholders, investors, and researchers seeking to understand and navigate this rapidly evolving landscape. The study period covers 2019-2033, with 2025 as the base and estimated year, and a forecast period of 2025-2033. The historical period analyzed is 2019-2024. The market is projected to reach xx Million by 2033, exhibiting a CAGR of xx% during the forecast period.
Autologous Cell Therapy Industry Market Dynamics & Concentration
The autologous cell therapy market is characterized by high growth potential driven by increasing prevalence of chronic diseases, technological advancements, and supportive regulatory frameworks. However, high development costs, stringent regulatory approvals, and complexities in manufacturing and storage present significant challenges. Market concentration is moderate, with several key players holding significant market share, but a considerable number of smaller companies also contributing to innovation.
- Market Share: The top five companies, including Sumitomo Chemical Co Ltd, Bayer AG, Takeda Pharmaceutical Co Ltd, Sangamo Therapeutics, and Vericel Corporation, collectively hold an estimated xx% of the global market share in 2025.
- M&A Activity: The industry has witnessed a significant number of mergers and acquisitions (M&As) in recent years, totaling approximately xx deals between 2019 and 2024, primarily driven by strategic expansion and technology acquisition. This consolidation is expected to continue, further shaping the competitive landscape.
- Innovation Drivers: Advancements in cell processing technologies, personalized medicine approaches, and the development of novel cell therapies for various applications are key innovation drivers.
- Regulatory Landscape: Stringent regulatory approvals and evolving guidelines influence the market, creating both challenges and opportunities for companies. Compliance costs are significant but essential for market entry and growth.
- Product Substitutes: While autologous cell therapies offer unique advantages, competing therapies like conventional pharmaceuticals and other regenerative medicine approaches pose competitive pressure.
- End-User Trends: Increasing adoption of autologous cell therapies in hospitals and research centers is driving market growth. Hospitals are the primary end-users, due to the specialized infrastructure required for treatment and administration.
Autologous Cell Therapy Industry Industry Trends & Analysis
The autologous cell therapy market is experiencing robust growth fueled by several key factors. The increasing prevalence of chronic diseases like cancer and autoimmune disorders significantly boosts demand. Technological advancements in cell processing, genetic engineering, and delivery systems enhance therapy efficacy and accessibility. Patient preference for minimally invasive and targeted therapies further propels market expansion. The market's competitive dynamics are intense, with companies focusing on innovative product development, strategic partnerships, and geographic expansion to secure a competitive edge.
The market's compound annual growth rate (CAGR) is estimated to be xx% from 2025 to 2033, indicating a substantial increase in market size from xx Million in 2025 to xx Million in 2033. Market penetration remains relatively low, providing substantial opportunities for expansion. Consumer preferences are increasingly shifting towards personalized and effective therapies, driving the adoption of autologous cell therapies. This trend is further accelerated by rising healthcare expenditure and growing awareness of advanced treatment options. Competition is fierce amongst existing market players which continues to push for innovation and improvement in efficiency.
Leading Markets & Segments in Autologous Cell Therapy Industry
The Oncology application segment holds the largest market share within the autologous cell therapy market, driven by a high prevalence of cancer and ongoing research into innovative cancer treatments. North America currently dominates the global market due to strong technological infrastructure, regulatory support, and higher healthcare expenditure.
- By Therapy: Autologous Stem Cell Therapy currently holds a larger market share compared to Autologous Cellular Immunotherapies.
- By Application:
- Oncology: High prevalence of cancer and successful clinical trials are major drivers.
- Musculoskeletal Disorder: Growing elderly population and increased prevalence of joint related diseases contribute to segment growth.
- Blood Disorder: Demand is driven by the unmet medical needs in treating various blood-related disorders.
- Autoimmune Disease: This segment is experiencing substantial growth due to rising prevalence of autoimmune diseases and ongoing research activities.
- By Source: Bone Marrow is the most commonly used source for autologous cell therapy, owing to its relative ease of harvesting and proven efficacy.
- By End User: Hospitals dominate the end-user segment due to the complexity of autologous cell therapy administration and specialized facilities required.
Key Drivers (North America):
- Robust healthcare infrastructure.
- High research and development investments.
- Favorable regulatory environment.
- High healthcare expenditure.
Autologous Cell Therapy Industry Product Developments
Recent advancements focus on enhancing the efficiency and safety of cell processing, improving cell viability and functionality, and developing novel delivery systems for targeted therapy. These advancements are leading to therapies with improved efficacy, reduced side effects, and expanded treatment possibilities. For instance, the development of iPSC-derived cell replacement therapies holds considerable promise for treating neurodegenerative diseases. The market is also seeing a rise in therapies incorporating gene editing technologies, enabling personalized medicine approaches and targeting specific disease mechanisms.
Key Drivers of Autologous Cell Therapy Industry Growth
Technological advancements, particularly in cell processing, genetic engineering, and delivery systems, are pivotal drivers. Increasing prevalence of chronic diseases fuels demand for effective treatment options. Supportive regulatory frameworks in several countries expedite product approvals, accelerating market entry. Furthermore, rising healthcare expenditure and growing awareness among patients contribute positively to market growth.
Challenges in the Autologous Cell Therapy Industry Market
High research and development costs coupled with lengthy regulatory approval processes pose significant hurdles. Complex manufacturing and stringent storage conditions create supply chain challenges and increase costs. The market faces intense competition, demanding continuous innovation and differentiation to maintain market share. The limited reimbursement policies for these advanced therapies in some countries restrict market access. High failure rate in early clinical trials also represents a risk to companies in the sector.
Emerging Opportunities in Autologous Cell Therapy Industry
Technological breakthroughs, such as advancements in gene editing and cell reprogramming, hold tremendous potential. Strategic partnerships between pharmaceutical companies and biotechnology firms accelerate innovation and market penetration. Expansion into emerging markets with high unmet needs presents significant growth opportunities. Further research and development into specific disease areas will lead to a greater number of applications becoming available on the market.
Leading Players in the Autologous Cell Therapy Industry Sector
- Sumitomo Chemical Co Ltd
- Sangamo Therapeutics
- Opexa Therapeutics
- Bayer AG
- Pharmicell Co Inc
- Daiichi Sankyo Co Ltd
- Vericel Corporation
- Holostem Terapie Avanzate S r l
- Brainstorm Cell Therapeutics
- Lineage Cell Therapeutics Inc
- Takeda Pharmaceutical Co Ltd
Key Milestones in Autologous Cell Therapy Industry Industry
- April 2022: Aspen Neuroscience, Inc. launches a patient screening study for iPSC-derived cell replacement therapies for Parkinson's disease. This milestone highlights progress in the development of innovative cell therapies for neurodegenerative diseases.
- April 2022: TreeFrog Therapeutics launches The Stem Cell SpaceShot Grant, providing USD 100,000 in research funding, emphasizing ongoing innovation in stem cell biology and regenerative medicine. This grant highlights the commitment to fund research in the space and fosters innovation within the field.
Strategic Outlook for Autologous Cell Therapy Industry Market
The autologous cell therapy market shows immense future potential. Strategic partnerships and collaborations will play a vital role in driving innovation and reducing development risks. Technological advancements and expanding applications will lead to new market segments and greater accessibility of treatments. Continued investment in research and development, coupled with supportive regulatory frameworks, is expected to fuel sustained market growth in the coming years.
Autologous Cell Therapy Industry Segmentation
-
1. Therapy
- 1.1. Autologous Stem Cell Therapy
- 1.2. Autologous Cellular Immunotherapies
-
2. Application
- 2.1. Oncology
- 2.2. Musculoskeletal Disorder
- 2.3. Blood Disorder
- 2.4. Autoimmune Disease
- 2.5. Others
-
3. Source
- 3.1. Bone Marrow
- 3.2. Epidermis
- 3.3. Others
-
4. End User
- 4.1. Hospitals
- 4.2. Research Centers
- 4.3. Others
Autologous Cell Therapy Industry Segmentation By Geography
-
1. North America
- 1.1. The United States
- 1.2. Canada
- 1.3. Mexico
-
2. Europe
- 2.1. Germany
- 2.2. United Kingdom
- 2.3. France
- 2.4. Italy
- 2.5. Spain
- 2.6. Rest of Europe
-
3. Asia Pacific
- 3.1. China
- 3.2. Japan
- 3.3. India
- 3.4. Australia
- 3.5. South Korea
- 3.6. Rest of Asia Pacific
-
4. Middle East and Africa
- 4.1. GCC
- 4.2. South Africa
- 4.3. Rest of Middle East and Africa
-
5. South America
- 5.1. Brazil
- 5.2. Argentina
- 5.3. Rest of South America
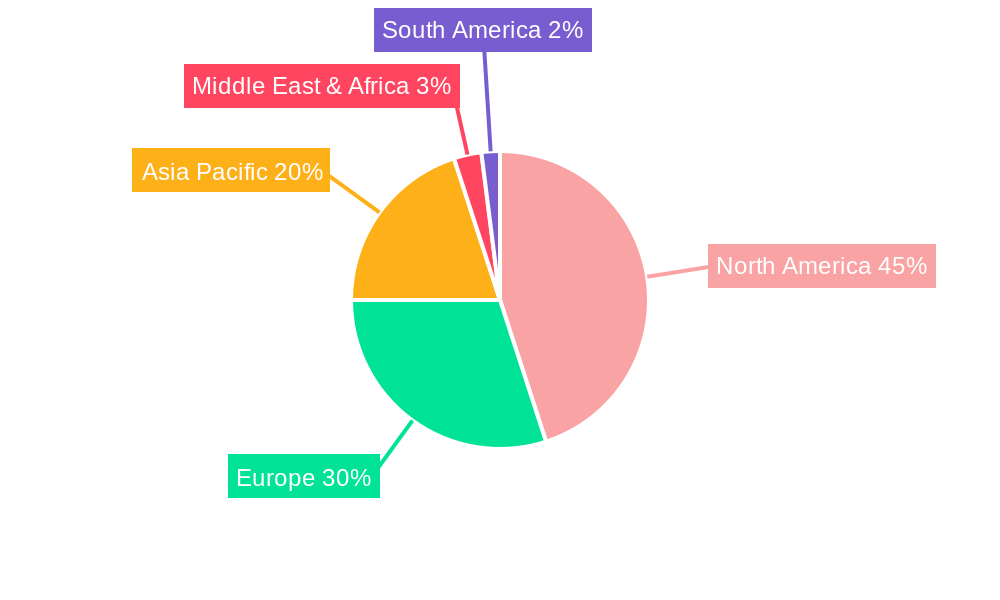
Autologous Cell Therapy Industry Regional Market Share
Geographic Coverage of Autologous Cell Therapy Industry
Autologous Cell Therapy Industry REPORT HIGHLIGHTS
| Aspects | Details |
|---|---|
| Study Period | 2020-2034 |
| Base Year | 2025 |
| Estimated Year | 2026 |
| Forecast Period | 2026-2034 |
| Historical Period | 2020-2025 |
| Growth Rate | CAGR of 18.9% from 2020-2034 |
| Segmentation |
|
Table of Contents
- 1. Introduction
- 1.1. Research Scope
- 1.2. Market Segmentation
- 1.3. Research Methodology
- 1.4. Definitions and Assumptions
- 2. Executive Summary
- 2.1. Introduction
- 3. Market Dynamics
- 3.1. Introduction
- 3.2. Market Drivers
- 3.2.1. Rising Incidence of Chronic Diseases; Emphasis Increasingly on Drug Development for New Applications
- 3.3. Market Restrains
- 3.3.1 Systemic immunological reactions possibility; Expensive practise
- 3.3.2 product and high capital investment
- 3.4. Market Trends
- 3.4.1. Musculoskeletal Disorder Segment is Expected to Hold the Largest Market Share in the Autologous Cell Therapy Market
- 4. Market Factor Analysis
- 4.1. Porters Five Forces
- 4.2. Supply/Value Chain
- 4.3. PESTEL analysis
- 4.4. Market Entropy
- 4.5. Patent/Trademark Analysis
- 5. Global Autologous Cell Therapy Industry Analysis, Insights and Forecast, 2020-2032
- 5.1. Market Analysis, Insights and Forecast - by Therapy
- 5.1.1. Autologous Stem Cell Therapy
- 5.1.2. Autologous Cellular Immunotherapies
- 5.2. Market Analysis, Insights and Forecast - by Application
- 5.2.1. Oncology
- 5.2.2. Musculoskeletal Disorder
- 5.2.3. Blood Disorder
- 5.2.4. Autoimmune Disease
- 5.2.5. Others
- 5.3. Market Analysis, Insights and Forecast - by Source
- 5.3.1. Bone Marrow
- 5.3.2. Epidermis
- 5.3.3. Others
- 5.4. Market Analysis, Insights and Forecast - by End User
- 5.4.1. Hospitals
- 5.4.2. Research Centers
- 5.4.3. Others
- 5.5. Market Analysis, Insights and Forecast - by Region
- 5.5.1. North America
- 5.5.2. Europe
- 5.5.3. Asia Pacific
- 5.5.4. Middle East and Africa
- 5.5.5. South America
- 5.1. Market Analysis, Insights and Forecast - by Therapy
- 6. North America Autologous Cell Therapy Industry Analysis, Insights and Forecast, 2020-2032
- 6.1. Market Analysis, Insights and Forecast - by Therapy
- 6.1.1. Autologous Stem Cell Therapy
- 6.1.2. Autologous Cellular Immunotherapies
- 6.2. Market Analysis, Insights and Forecast - by Application
- 6.2.1. Oncology
- 6.2.2. Musculoskeletal Disorder
- 6.2.3. Blood Disorder
- 6.2.4. Autoimmune Disease
- 6.2.5. Others
- 6.3. Market Analysis, Insights and Forecast - by Source
- 6.3.1. Bone Marrow
- 6.3.2. Epidermis
- 6.3.3. Others
- 6.4. Market Analysis, Insights and Forecast - by End User
- 6.4.1. Hospitals
- 6.4.2. Research Centers
- 6.4.3. Others
- 6.1. Market Analysis, Insights and Forecast - by Therapy
- 7. Europe Autologous Cell Therapy Industry Analysis, Insights and Forecast, 2020-2032
- 7.1. Market Analysis, Insights and Forecast - by Therapy
- 7.1.1. Autologous Stem Cell Therapy
- 7.1.2. Autologous Cellular Immunotherapies
- 7.2. Market Analysis, Insights and Forecast - by Application
- 7.2.1. Oncology
- 7.2.2. Musculoskeletal Disorder
- 7.2.3. Blood Disorder
- 7.2.4. Autoimmune Disease
- 7.2.5. Others
- 7.3. Market Analysis, Insights and Forecast - by Source
- 7.3.1. Bone Marrow
- 7.3.2. Epidermis
- 7.3.3. Others
- 7.4. Market Analysis, Insights and Forecast - by End User
- 7.4.1. Hospitals
- 7.4.2. Research Centers
- 7.4.3. Others
- 7.1. Market Analysis, Insights and Forecast - by Therapy
- 8. Asia Pacific Autologous Cell Therapy Industry Analysis, Insights and Forecast, 2020-2032
- 8.1. Market Analysis, Insights and Forecast - by Therapy
- 8.1.1. Autologous Stem Cell Therapy
- 8.1.2. Autologous Cellular Immunotherapies
- 8.2. Market Analysis, Insights and Forecast - by Application
- 8.2.1. Oncology
- 8.2.2. Musculoskeletal Disorder
- 8.2.3. Blood Disorder
- 8.2.4. Autoimmune Disease
- 8.2.5. Others
- 8.3. Market Analysis, Insights and Forecast - by Source
- 8.3.1. Bone Marrow
- 8.3.2. Epidermis
- 8.3.3. Others
- 8.4. Market Analysis, Insights and Forecast - by End User
- 8.4.1. Hospitals
- 8.4.2. Research Centers
- 8.4.3. Others
- 8.1. Market Analysis, Insights and Forecast - by Therapy
- 9. Middle East and Africa Autologous Cell Therapy Industry Analysis, Insights and Forecast, 2020-2032
- 9.1. Market Analysis, Insights and Forecast - by Therapy
- 9.1.1. Autologous Stem Cell Therapy
- 9.1.2. Autologous Cellular Immunotherapies
- 9.2. Market Analysis, Insights and Forecast - by Application
- 9.2.1. Oncology
- 9.2.2. Musculoskeletal Disorder
- 9.2.3. Blood Disorder
- 9.2.4. Autoimmune Disease
- 9.2.5. Others
- 9.3. Market Analysis, Insights and Forecast - by Source
- 9.3.1. Bone Marrow
- 9.3.2. Epidermis
- 9.3.3. Others
- 9.4. Market Analysis, Insights and Forecast - by End User
- 9.4.1. Hospitals
- 9.4.2. Research Centers
- 9.4.3. Others
- 9.1. Market Analysis, Insights and Forecast - by Therapy
- 10. South America Autologous Cell Therapy Industry Analysis, Insights and Forecast, 2020-2032
- 10.1. Market Analysis, Insights and Forecast - by Therapy
- 10.1.1. Autologous Stem Cell Therapy
- 10.1.2. Autologous Cellular Immunotherapies
- 10.2. Market Analysis, Insights and Forecast - by Application
- 10.2.1. Oncology
- 10.2.2. Musculoskeletal Disorder
- 10.2.3. Blood Disorder
- 10.2.4. Autoimmune Disease
- 10.2.5. Others
- 10.3. Market Analysis, Insights and Forecast - by Source
- 10.3.1. Bone Marrow
- 10.3.2. Epidermis
- 10.3.3. Others
- 10.4. Market Analysis, Insights and Forecast - by End User
- 10.4.1. Hospitals
- 10.4.2. Research Centers
- 10.4.3. Others
- 10.1. Market Analysis, Insights and Forecast - by Therapy
- 11. Competitive Analysis
- 11.1. Global Market Share Analysis 2025
- 11.2. Company Profiles
- 11.2.1 Sumitomo Chemical Co Ltd
- 11.2.1.1. Overview
- 11.2.1.2. Products
- 11.2.1.3. SWOT Analysis
- 11.2.1.4. Recent Developments
- 11.2.1.5. Financials (Based on Availability)
- 11.2.2 Sangamo Therapeutics
- 11.2.2.1. Overview
- 11.2.2.2. Products
- 11.2.2.3. SWOT Analysis
- 11.2.2.4. Recent Developments
- 11.2.2.5. Financials (Based on Availability)
- 11.2.3 Opexa Therapeutics
- 11.2.3.1. Overview
- 11.2.3.2. Products
- 11.2.3.3. SWOT Analysis
- 11.2.3.4. Recent Developments
- 11.2.3.5. Financials (Based on Availability)
- 11.2.4 Bayer AG
- 11.2.4.1. Overview
- 11.2.4.2. Products
- 11.2.4.3. SWOT Analysis
- 11.2.4.4. Recent Developments
- 11.2.4.5. Financials (Based on Availability)
- 11.2.5 Pharmicell Co Inc
- 11.2.5.1. Overview
- 11.2.5.2. Products
- 11.2.5.3. SWOT Analysis
- 11.2.5.4. Recent Developments
- 11.2.5.5. Financials (Based on Availability)
- 11.2.6 Daiichi Sankyo Co Ltd
- 11.2.6.1. Overview
- 11.2.6.2. Products
- 11.2.6.3. SWOT Analysis
- 11.2.6.4. Recent Developments
- 11.2.6.5. Financials (Based on Availability)
- 11.2.7 Vericel Corporation
- 11.2.7.1. Overview
- 11.2.7.2. Products
- 11.2.7.3. SWOT Analysis
- 11.2.7.4. Recent Developments
- 11.2.7.5. Financials (Based on Availability)
- 11.2.8 Holostem Terapie Avanzate S r l
- 11.2.8.1. Overview
- 11.2.8.2. Products
- 11.2.8.3. SWOT Analysis
- 11.2.8.4. Recent Developments
- 11.2.8.5. Financials (Based on Availability)
- 11.2.9 BrainStorm Cell Therapeutics
- 11.2.9.1. Overview
- 11.2.9.2. Products
- 11.2.9.3. SWOT Analysis
- 11.2.9.4. Recent Developments
- 11.2.9.5. Financials (Based on Availability)
- 11.2.10 Lineage Cell Therapeutics Inc
- 11.2.10.1. Overview
- 11.2.10.2. Products
- 11.2.10.3. SWOT Analysis
- 11.2.10.4. Recent Developments
- 11.2.10.5. Financials (Based on Availability)
- 11.2.11 Takeda Pharmaceutical Co Ltd
- 11.2.11.1. Overview
- 11.2.11.2. Products
- 11.2.11.3. SWOT Analysis
- 11.2.11.4. Recent Developments
- 11.2.11.5. Financials (Based on Availability)
- 11.2.1 Sumitomo Chemical Co Ltd
List of Figures
- Figure 1: Global Autologous Cell Therapy Industry Revenue Breakdown (billion, %) by Region 2025 & 2033
- Figure 2: Global Autologous Cell Therapy Industry Volume Breakdown (K Unit, %) by Region 2025 & 2033
- Figure 3: North America Autologous Cell Therapy Industry Revenue (billion), by Therapy 2025 & 2033
- Figure 4: North America Autologous Cell Therapy Industry Volume (K Unit), by Therapy 2025 & 2033
- Figure 5: North America Autologous Cell Therapy Industry Revenue Share (%), by Therapy 2025 & 2033
- Figure 6: North America Autologous Cell Therapy Industry Volume Share (%), by Therapy 2025 & 2033
- Figure 7: North America Autologous Cell Therapy Industry Revenue (billion), by Application 2025 & 2033
- Figure 8: North America Autologous Cell Therapy Industry Volume (K Unit), by Application 2025 & 2033
- Figure 9: North America Autologous Cell Therapy Industry Revenue Share (%), by Application 2025 & 2033
- Figure 10: North America Autologous Cell Therapy Industry Volume Share (%), by Application 2025 & 2033
- Figure 11: North America Autologous Cell Therapy Industry Revenue (billion), by Source 2025 & 2033
- Figure 12: North America Autologous Cell Therapy Industry Volume (K Unit), by Source 2025 & 2033
- Figure 13: North America Autologous Cell Therapy Industry Revenue Share (%), by Source 2025 & 2033
- Figure 14: North America Autologous Cell Therapy Industry Volume Share (%), by Source 2025 & 2033
- Figure 15: North America Autologous Cell Therapy Industry Revenue (billion), by End User 2025 & 2033
- Figure 16: North America Autologous Cell Therapy Industry Volume (K Unit), by End User 2025 & 2033
- Figure 17: North America Autologous Cell Therapy Industry Revenue Share (%), by End User 2025 & 2033
- Figure 18: North America Autologous Cell Therapy Industry Volume Share (%), by End User 2025 & 2033
- Figure 19: North America Autologous Cell Therapy Industry Revenue (billion), by Country 2025 & 2033
- Figure 20: North America Autologous Cell Therapy Industry Volume (K Unit), by Country 2025 & 2033
- Figure 21: North America Autologous Cell Therapy Industry Revenue Share (%), by Country 2025 & 2033
- Figure 22: North America Autologous Cell Therapy Industry Volume Share (%), by Country 2025 & 2033
- Figure 23: Europe Autologous Cell Therapy Industry Revenue (billion), by Therapy 2025 & 2033
- Figure 24: Europe Autologous Cell Therapy Industry Volume (K Unit), by Therapy 2025 & 2033
- Figure 25: Europe Autologous Cell Therapy Industry Revenue Share (%), by Therapy 2025 & 2033
- Figure 26: Europe Autologous Cell Therapy Industry Volume Share (%), by Therapy 2025 & 2033
- Figure 27: Europe Autologous Cell Therapy Industry Revenue (billion), by Application 2025 & 2033
- Figure 28: Europe Autologous Cell Therapy Industry Volume (K Unit), by Application 2025 & 2033
- Figure 29: Europe Autologous Cell Therapy Industry Revenue Share (%), by Application 2025 & 2033
- Figure 30: Europe Autologous Cell Therapy Industry Volume Share (%), by Application 2025 & 2033
- Figure 31: Europe Autologous Cell Therapy Industry Revenue (billion), by Source 2025 & 2033
- Figure 32: Europe Autologous Cell Therapy Industry Volume (K Unit), by Source 2025 & 2033
- Figure 33: Europe Autologous Cell Therapy Industry Revenue Share (%), by Source 2025 & 2033
- Figure 34: Europe Autologous Cell Therapy Industry Volume Share (%), by Source 2025 & 2033
- Figure 35: Europe Autologous Cell Therapy Industry Revenue (billion), by End User 2025 & 2033
- Figure 36: Europe Autologous Cell Therapy Industry Volume (K Unit), by End User 2025 & 2033
- Figure 37: Europe Autologous Cell Therapy Industry Revenue Share (%), by End User 2025 & 2033
- Figure 38: Europe Autologous Cell Therapy Industry Volume Share (%), by End User 2025 & 2033
- Figure 39: Europe Autologous Cell Therapy Industry Revenue (billion), by Country 2025 & 2033
- Figure 40: Europe Autologous Cell Therapy Industry Volume (K Unit), by Country 2025 & 2033
- Figure 41: Europe Autologous Cell Therapy Industry Revenue Share (%), by Country 2025 & 2033
- Figure 42: Europe Autologous Cell Therapy Industry Volume Share (%), by Country 2025 & 2033
- Figure 43: Asia Pacific Autologous Cell Therapy Industry Revenue (billion), by Therapy 2025 & 2033
- Figure 44: Asia Pacific Autologous Cell Therapy Industry Volume (K Unit), by Therapy 2025 & 2033
- Figure 45: Asia Pacific Autologous Cell Therapy Industry Revenue Share (%), by Therapy 2025 & 2033
- Figure 46: Asia Pacific Autologous Cell Therapy Industry Volume Share (%), by Therapy 2025 & 2033
- Figure 47: Asia Pacific Autologous Cell Therapy Industry Revenue (billion), by Application 2025 & 2033
- Figure 48: Asia Pacific Autologous Cell Therapy Industry Volume (K Unit), by Application 2025 & 2033
- Figure 49: Asia Pacific Autologous Cell Therapy Industry Revenue Share (%), by Application 2025 & 2033
- Figure 50: Asia Pacific Autologous Cell Therapy Industry Volume Share (%), by Application 2025 & 2033
- Figure 51: Asia Pacific Autologous Cell Therapy Industry Revenue (billion), by Source 2025 & 2033
- Figure 52: Asia Pacific Autologous Cell Therapy Industry Volume (K Unit), by Source 2025 & 2033
- Figure 53: Asia Pacific Autologous Cell Therapy Industry Revenue Share (%), by Source 2025 & 2033
- Figure 54: Asia Pacific Autologous Cell Therapy Industry Volume Share (%), by Source 2025 & 2033
- Figure 55: Asia Pacific Autologous Cell Therapy Industry Revenue (billion), by End User 2025 & 2033
- Figure 56: Asia Pacific Autologous Cell Therapy Industry Volume (K Unit), by End User 2025 & 2033
- Figure 57: Asia Pacific Autologous Cell Therapy Industry Revenue Share (%), by End User 2025 & 2033
- Figure 58: Asia Pacific Autologous Cell Therapy Industry Volume Share (%), by End User 2025 & 2033
- Figure 59: Asia Pacific Autologous Cell Therapy Industry Revenue (billion), by Country 2025 & 2033
- Figure 60: Asia Pacific Autologous Cell Therapy Industry Volume (K Unit), by Country 2025 & 2033
- Figure 61: Asia Pacific Autologous Cell Therapy Industry Revenue Share (%), by Country 2025 & 2033
- Figure 62: Asia Pacific Autologous Cell Therapy Industry Volume Share (%), by Country 2025 & 2033
- Figure 63: Middle East and Africa Autologous Cell Therapy Industry Revenue (billion), by Therapy 2025 & 2033
- Figure 64: Middle East and Africa Autologous Cell Therapy Industry Volume (K Unit), by Therapy 2025 & 2033
- Figure 65: Middle East and Africa Autologous Cell Therapy Industry Revenue Share (%), by Therapy 2025 & 2033
- Figure 66: Middle East and Africa Autologous Cell Therapy Industry Volume Share (%), by Therapy 2025 & 2033
- Figure 67: Middle East and Africa Autologous Cell Therapy Industry Revenue (billion), by Application 2025 & 2033
- Figure 68: Middle East and Africa Autologous Cell Therapy Industry Volume (K Unit), by Application 2025 & 2033
- Figure 69: Middle East and Africa Autologous Cell Therapy Industry Revenue Share (%), by Application 2025 & 2033
- Figure 70: Middle East and Africa Autologous Cell Therapy Industry Volume Share (%), by Application 2025 & 2033
- Figure 71: Middle East and Africa Autologous Cell Therapy Industry Revenue (billion), by Source 2025 & 2033
- Figure 72: Middle East and Africa Autologous Cell Therapy Industry Volume (K Unit), by Source 2025 & 2033
- Figure 73: Middle East and Africa Autologous Cell Therapy Industry Revenue Share (%), by Source 2025 & 2033
- Figure 74: Middle East and Africa Autologous Cell Therapy Industry Volume Share (%), by Source 2025 & 2033
- Figure 75: Middle East and Africa Autologous Cell Therapy Industry Revenue (billion), by End User 2025 & 2033
- Figure 76: Middle East and Africa Autologous Cell Therapy Industry Volume (K Unit), by End User 2025 & 2033
- Figure 77: Middle East and Africa Autologous Cell Therapy Industry Revenue Share (%), by End User 2025 & 2033
- Figure 78: Middle East and Africa Autologous Cell Therapy Industry Volume Share (%), by End User 2025 & 2033
- Figure 79: Middle East and Africa Autologous Cell Therapy Industry Revenue (billion), by Country 2025 & 2033
- Figure 80: Middle East and Africa Autologous Cell Therapy Industry Volume (K Unit), by Country 2025 & 2033
- Figure 81: Middle East and Africa Autologous Cell Therapy Industry Revenue Share (%), by Country 2025 & 2033
- Figure 82: Middle East and Africa Autologous Cell Therapy Industry Volume Share (%), by Country 2025 & 2033
- Figure 83: South America Autologous Cell Therapy Industry Revenue (billion), by Therapy 2025 & 2033
- Figure 84: South America Autologous Cell Therapy Industry Volume (K Unit), by Therapy 2025 & 2033
- Figure 85: South America Autologous Cell Therapy Industry Revenue Share (%), by Therapy 2025 & 2033
- Figure 86: South America Autologous Cell Therapy Industry Volume Share (%), by Therapy 2025 & 2033
- Figure 87: South America Autologous Cell Therapy Industry Revenue (billion), by Application 2025 & 2033
- Figure 88: South America Autologous Cell Therapy Industry Volume (K Unit), by Application 2025 & 2033
- Figure 89: South America Autologous Cell Therapy Industry Revenue Share (%), by Application 2025 & 2033
- Figure 90: South America Autologous Cell Therapy Industry Volume Share (%), by Application 2025 & 2033
- Figure 91: South America Autologous Cell Therapy Industry Revenue (billion), by Source 2025 & 2033
- Figure 92: South America Autologous Cell Therapy Industry Volume (K Unit), by Source 2025 & 2033
- Figure 93: South America Autologous Cell Therapy Industry Revenue Share (%), by Source 2025 & 2033
- Figure 94: South America Autologous Cell Therapy Industry Volume Share (%), by Source 2025 & 2033
- Figure 95: South America Autologous Cell Therapy Industry Revenue (billion), by End User 2025 & 2033
- Figure 96: South America Autologous Cell Therapy Industry Volume (K Unit), by End User 2025 & 2033
- Figure 97: South America Autologous Cell Therapy Industry Revenue Share (%), by End User 2025 & 2033
- Figure 98: South America Autologous Cell Therapy Industry Volume Share (%), by End User 2025 & 2033
- Figure 99: South America Autologous Cell Therapy Industry Revenue (billion), by Country 2025 & 2033
- Figure 100: South America Autologous Cell Therapy Industry Volume (K Unit), by Country 2025 & 2033
- Figure 101: South America Autologous Cell Therapy Industry Revenue Share (%), by Country 2025 & 2033
- Figure 102: South America Autologous Cell Therapy Industry Volume Share (%), by Country 2025 & 2033
List of Tables
- Table 1: Global Autologous Cell Therapy Industry Revenue billion Forecast, by Therapy 2020 & 2033
- Table 2: Global Autologous Cell Therapy Industry Volume K Unit Forecast, by Therapy 2020 & 2033
- Table 3: Global Autologous Cell Therapy Industry Revenue billion Forecast, by Application 2020 & 2033
- Table 4: Global Autologous Cell Therapy Industry Volume K Unit Forecast, by Application 2020 & 2033
- Table 5: Global Autologous Cell Therapy Industry Revenue billion Forecast, by Source 2020 & 2033
- Table 6: Global Autologous Cell Therapy Industry Volume K Unit Forecast, by Source 2020 & 2033
- Table 7: Global Autologous Cell Therapy Industry Revenue billion Forecast, by End User 2020 & 2033
- Table 8: Global Autologous Cell Therapy Industry Volume K Unit Forecast, by End User 2020 & 2033
- Table 9: Global Autologous Cell Therapy Industry Revenue billion Forecast, by Region 2020 & 2033
- Table 10: Global Autologous Cell Therapy Industry Volume K Unit Forecast, by Region 2020 & 2033
- Table 11: Global Autologous Cell Therapy Industry Revenue billion Forecast, by Therapy 2020 & 2033
- Table 12: Global Autologous Cell Therapy Industry Volume K Unit Forecast, by Therapy 2020 & 2033
- Table 13: Global Autologous Cell Therapy Industry Revenue billion Forecast, by Application 2020 & 2033
- Table 14: Global Autologous Cell Therapy Industry Volume K Unit Forecast, by Application 2020 & 2033
- Table 15: Global Autologous Cell Therapy Industry Revenue billion Forecast, by Source 2020 & 2033
- Table 16: Global Autologous Cell Therapy Industry Volume K Unit Forecast, by Source 2020 & 2033
- Table 17: Global Autologous Cell Therapy Industry Revenue billion Forecast, by End User 2020 & 2033
- Table 18: Global Autologous Cell Therapy Industry Volume K Unit Forecast, by End User 2020 & 2033
- Table 19: Global Autologous Cell Therapy Industry Revenue billion Forecast, by Country 2020 & 2033
- Table 20: Global Autologous Cell Therapy Industry Volume K Unit Forecast, by Country 2020 & 2033
- Table 21: The United States Autologous Cell Therapy Industry Revenue (billion) Forecast, by Application 2020 & 2033
- Table 22: The United States Autologous Cell Therapy Industry Volume (K Unit) Forecast, by Application 2020 & 2033
- Table 23: Canada Autologous Cell Therapy Industry Revenue (billion) Forecast, by Application 2020 & 2033
- Table 24: Canada Autologous Cell Therapy Industry Volume (K Unit) Forecast, by Application 2020 & 2033
- Table 25: Mexico Autologous Cell Therapy Industry Revenue (billion) Forecast, by Application 2020 & 2033
- Table 26: Mexico Autologous Cell Therapy Industry Volume (K Unit) Forecast, by Application 2020 & 2033
- Table 27: Global Autologous Cell Therapy Industry Revenue billion Forecast, by Therapy 2020 & 2033
- Table 28: Global Autologous Cell Therapy Industry Volume K Unit Forecast, by Therapy 2020 & 2033
- Table 29: Global Autologous Cell Therapy Industry Revenue billion Forecast, by Application 2020 & 2033
- Table 30: Global Autologous Cell Therapy Industry Volume K Unit Forecast, by Application 2020 & 2033
- Table 31: Global Autologous Cell Therapy Industry Revenue billion Forecast, by Source 2020 & 2033
- Table 32: Global Autologous Cell Therapy Industry Volume K Unit Forecast, by Source 2020 & 2033
- Table 33: Global Autologous Cell Therapy Industry Revenue billion Forecast, by End User 2020 & 2033
- Table 34: Global Autologous Cell Therapy Industry Volume K Unit Forecast, by End User 2020 & 2033
- Table 35: Global Autologous Cell Therapy Industry Revenue billion Forecast, by Country 2020 & 2033
- Table 36: Global Autologous Cell Therapy Industry Volume K Unit Forecast, by Country 2020 & 2033
- Table 37: Germany Autologous Cell Therapy Industry Revenue (billion) Forecast, by Application 2020 & 2033
- Table 38: Germany Autologous Cell Therapy Industry Volume (K Unit) Forecast, by Application 2020 & 2033
- Table 39: United Kingdom Autologous Cell Therapy Industry Revenue (billion) Forecast, by Application 2020 & 2033
- Table 40: United Kingdom Autologous Cell Therapy Industry Volume (K Unit) Forecast, by Application 2020 & 2033
- Table 41: France Autologous Cell Therapy Industry Revenue (billion) Forecast, by Application 2020 & 2033
- Table 42: France Autologous Cell Therapy Industry Volume (K Unit) Forecast, by Application 2020 & 2033
- Table 43: Italy Autologous Cell Therapy Industry Revenue (billion) Forecast, by Application 2020 & 2033
- Table 44: Italy Autologous Cell Therapy Industry Volume (K Unit) Forecast, by Application 2020 & 2033
- Table 45: Spain Autologous Cell Therapy Industry Revenue (billion) Forecast, by Application 2020 & 2033
- Table 46: Spain Autologous Cell Therapy Industry Volume (K Unit) Forecast, by Application 2020 & 2033
- Table 47: Rest of Europe Autologous Cell Therapy Industry Revenue (billion) Forecast, by Application 2020 & 2033
- Table 48: Rest of Europe Autologous Cell Therapy Industry Volume (K Unit) Forecast, by Application 2020 & 2033
- Table 49: Global Autologous Cell Therapy Industry Revenue billion Forecast, by Therapy 2020 & 2033
- Table 50: Global Autologous Cell Therapy Industry Volume K Unit Forecast, by Therapy 2020 & 2033
- Table 51: Global Autologous Cell Therapy Industry Revenue billion Forecast, by Application 2020 & 2033
- Table 52: Global Autologous Cell Therapy Industry Volume K Unit Forecast, by Application 2020 & 2033
- Table 53: Global Autologous Cell Therapy Industry Revenue billion Forecast, by Source 2020 & 2033
- Table 54: Global Autologous Cell Therapy Industry Volume K Unit Forecast, by Source 2020 & 2033
- Table 55: Global Autologous Cell Therapy Industry Revenue billion Forecast, by End User 2020 & 2033
- Table 56: Global Autologous Cell Therapy Industry Volume K Unit Forecast, by End User 2020 & 2033
- Table 57: Global Autologous Cell Therapy Industry Revenue billion Forecast, by Country 2020 & 2033
- Table 58: Global Autologous Cell Therapy Industry Volume K Unit Forecast, by Country 2020 & 2033
- Table 59: China Autologous Cell Therapy Industry Revenue (billion) Forecast, by Application 2020 & 2033
- Table 60: China Autologous Cell Therapy Industry Volume (K Unit) Forecast, by Application 2020 & 2033
- Table 61: Japan Autologous Cell Therapy Industry Revenue (billion) Forecast, by Application 2020 & 2033
- Table 62: Japan Autologous Cell Therapy Industry Volume (K Unit) Forecast, by Application 2020 & 2033
- Table 63: India Autologous Cell Therapy Industry Revenue (billion) Forecast, by Application 2020 & 2033
- Table 64: India Autologous Cell Therapy Industry Volume (K Unit) Forecast, by Application 2020 & 2033
- Table 65: Australia Autologous Cell Therapy Industry Revenue (billion) Forecast, by Application 2020 & 2033
- Table 66: Australia Autologous Cell Therapy Industry Volume (K Unit) Forecast, by Application 2020 & 2033
- Table 67: South Korea Autologous Cell Therapy Industry Revenue (billion) Forecast, by Application 2020 & 2033
- Table 68: South Korea Autologous Cell Therapy Industry Volume (K Unit) Forecast, by Application 2020 & 2033
- Table 69: Rest of Asia Pacific Autologous Cell Therapy Industry Revenue (billion) Forecast, by Application 2020 & 2033
- Table 70: Rest of Asia Pacific Autologous Cell Therapy Industry Volume (K Unit) Forecast, by Application 2020 & 2033
- Table 71: Global Autologous Cell Therapy Industry Revenue billion Forecast, by Therapy 2020 & 2033
- Table 72: Global Autologous Cell Therapy Industry Volume K Unit Forecast, by Therapy 2020 & 2033
- Table 73: Global Autologous Cell Therapy Industry Revenue billion Forecast, by Application 2020 & 2033
- Table 74: Global Autologous Cell Therapy Industry Volume K Unit Forecast, by Application 2020 & 2033
- Table 75: Global Autologous Cell Therapy Industry Revenue billion Forecast, by Source 2020 & 2033
- Table 76: Global Autologous Cell Therapy Industry Volume K Unit Forecast, by Source 2020 & 2033
- Table 77: Global Autologous Cell Therapy Industry Revenue billion Forecast, by End User 2020 & 2033
- Table 78: Global Autologous Cell Therapy Industry Volume K Unit Forecast, by End User 2020 & 2033
- Table 79: Global Autologous Cell Therapy Industry Revenue billion Forecast, by Country 2020 & 2033
- Table 80: Global Autologous Cell Therapy Industry Volume K Unit Forecast, by Country 2020 & 2033
- Table 81: GCC Autologous Cell Therapy Industry Revenue (billion) Forecast, by Application 2020 & 2033
- Table 82: GCC Autologous Cell Therapy Industry Volume (K Unit) Forecast, by Application 2020 & 2033
- Table 83: South Africa Autologous Cell Therapy Industry Revenue (billion) Forecast, by Application 2020 & 2033
- Table 84: South Africa Autologous Cell Therapy Industry Volume (K Unit) Forecast, by Application 2020 & 2033
- Table 85: Rest of Middle East and Africa Autologous Cell Therapy Industry Revenue (billion) Forecast, by Application 2020 & 2033
- Table 86: Rest of Middle East and Africa Autologous Cell Therapy Industry Volume (K Unit) Forecast, by Application 2020 & 2033
- Table 87: Global Autologous Cell Therapy Industry Revenue billion Forecast, by Therapy 2020 & 2033
- Table 88: Global Autologous Cell Therapy Industry Volume K Unit Forecast, by Therapy 2020 & 2033
- Table 89: Global Autologous Cell Therapy Industry Revenue billion Forecast, by Application 2020 & 2033
- Table 90: Global Autologous Cell Therapy Industry Volume K Unit Forecast, by Application 2020 & 2033
- Table 91: Global Autologous Cell Therapy Industry Revenue billion Forecast, by Source 2020 & 2033
- Table 92: Global Autologous Cell Therapy Industry Volume K Unit Forecast, by Source 2020 & 2033
- Table 93: Global Autologous Cell Therapy Industry Revenue billion Forecast, by End User 2020 & 2033
- Table 94: Global Autologous Cell Therapy Industry Volume K Unit Forecast, by End User 2020 & 2033
- Table 95: Global Autologous Cell Therapy Industry Revenue billion Forecast, by Country 2020 & 2033
- Table 96: Global Autologous Cell Therapy Industry Volume K Unit Forecast, by Country 2020 & 2033
- Table 97: Brazil Autologous Cell Therapy Industry Revenue (billion) Forecast, by Application 2020 & 2033
- Table 98: Brazil Autologous Cell Therapy Industry Volume (K Unit) Forecast, by Application 2020 & 2033
- Table 99: Argentina Autologous Cell Therapy Industry Revenue (billion) Forecast, by Application 2020 & 2033
- Table 100: Argentina Autologous Cell Therapy Industry Volume (K Unit) Forecast, by Application 2020 & 2033
- Table 101: Rest of South America Autologous Cell Therapy Industry Revenue (billion) Forecast, by Application 2020 & 2033
- Table 102: Rest of South America Autologous Cell Therapy Industry Volume (K Unit) Forecast, by Application 2020 & 2033
Frequently Asked Questions
1. What is the projected Compound Annual Growth Rate (CAGR) of the Autologous Cell Therapy Industry?
The projected CAGR is approximately 18.9%.
2. Which companies are prominent players in the Autologous Cell Therapy Industry?
Key companies in the market include Sumitomo Chemical Co Ltd, Sangamo Therapeutics, Opexa Therapeutics, Bayer AG, Pharmicell Co Inc, Daiichi Sankyo Co Ltd, Vericel Corporation, Holostem Terapie Avanzate S r l, BrainStorm Cell Therapeutics, Lineage Cell Therapeutics Inc, Takeda Pharmaceutical Co Ltd.
3. What are the main segments of the Autologous Cell Therapy Industry?
The market segments include Therapy, Application, Source, End User.
4. Can you provide details about the market size?
The market size is estimated to be USD 11.41 billion as of 2022.
5. What are some drivers contributing to market growth?
Rising Incidence of Chronic Diseases; Emphasis Increasingly on Drug Development for New Applications.
6. What are the notable trends driving market growth?
Musculoskeletal Disorder Segment is Expected to Hold the Largest Market Share in the Autologous Cell Therapy Market.
7. Are there any restraints impacting market growth?
Systemic immunological reactions possibility; Expensive practise. product and high capital investment.
8. Can you provide examples of recent developments in the market?
In April 2022, Aspen Neuroscience, Inc., launched the first patient screening study of its kind, working with multiple clinical screening sites in the United States. The company's Trial-Ready Cohort Study is a preliminary step to filing an Investigational New Drug (IND) application with the United States Food & Drug Administration for ANPD001 and investigation of iPSC-derived cell replacement therapies for Parkinson's disease.
9. What pricing options are available for accessing the report?
Pricing options include single-user, multi-user, and enterprise licenses priced at USD 4750, USD 5250, and USD 8750 respectively.
10. Is the market size provided in terms of value or volume?
The market size is provided in terms of value, measured in billion and volume, measured in K Unit.
11. Are there any specific market keywords associated with the report?
Yes, the market keyword associated with the report is "Autologous Cell Therapy Industry," which aids in identifying and referencing the specific market segment covered.
12. How do I determine which pricing option suits my needs best?
The pricing options vary based on user requirements and access needs. Individual users may opt for single-user licenses, while businesses requiring broader access may choose multi-user or enterprise licenses for cost-effective access to the report.
13. Are there any additional resources or data provided in the Autologous Cell Therapy Industry report?
While the report offers comprehensive insights, it's advisable to review the specific contents or supplementary materials provided to ascertain if additional resources or data are available.
14. How can I stay updated on further developments or reports in the Autologous Cell Therapy Industry?
To stay informed about further developments, trends, and reports in the Autologous Cell Therapy Industry, consider subscribing to industry newsletters, following relevant companies and organizations, or regularly checking reputable industry news sources and publications.
Methodology
Step 1 - Identification of Relevant Samples Size from Population Database


Step 2 - Approaches for Defining Global Market Size (Value, Volume* & Price*)

Note*: In applicable scenarios
Step 3 - Data Sources
Primary Research
- Web Analytics
- Survey Reports
- Research Institute
- Latest Research Reports
- Opinion Leaders
Secondary Research
- Annual Reports
- White Paper
- Latest Press Release
- Industry Association
- Paid Database
- Investor Presentations

Step 4 - Data Triangulation
Involves using different sources of information in order to increase the validity of a study
These sources are likely to be stakeholders in a program - participants, other researchers, program staff, other community members, and so on.
Then we put all data in single framework & apply various statistical tools to find out the dynamic on the market.
During the analysis stage, feedback from the stakeholder groups would be compared to determine areas of agreement as well as areas of divergence