

Key Insights
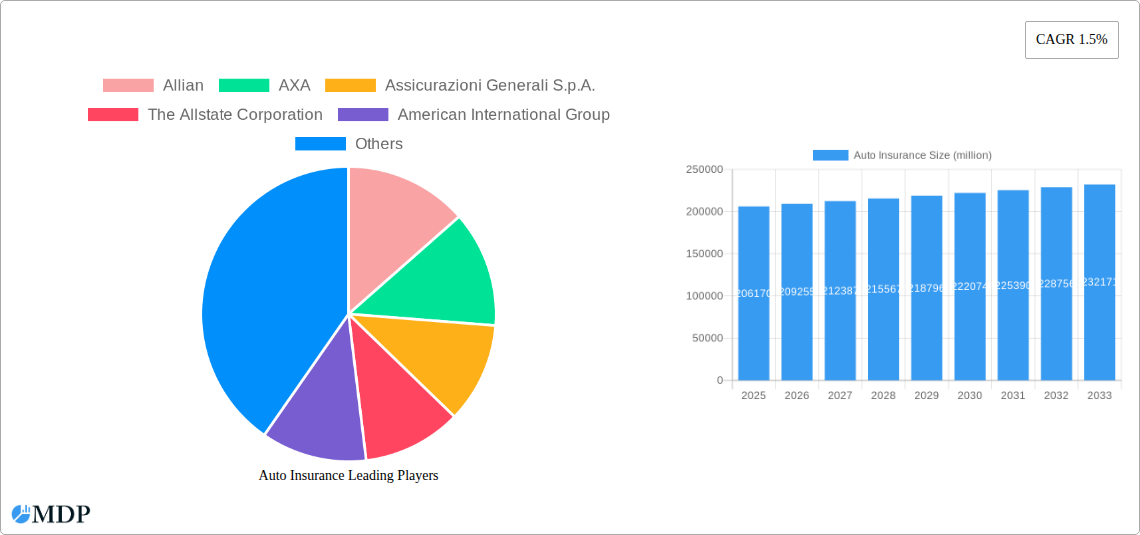
The global Auto Insurance market is poised for steady growth, projected to reach an estimated USD 206,170 million by 2025. This expansion is driven by several key factors, including an increasing global vehicle parc and evolving regulatory landscapes that mandate coverage. While the Compound Annual Growth Rate (CAGR) of 1.5% indicates a stable, albeit moderate, trajectory, the market's sheer scale suggests significant opportunities for both established players and new entrants. The primary drivers for this growth are likely to include rising disposable incomes in emerging economies, leading to higher vehicle ownership, and the increasing adoption of telematics and usage-based insurance (UBI) models, which offer personalized pricing and incentivize safer driving. Furthermore, advancements in AI and data analytics are enabling insurers to better assess risk, streamline claims processing, and enhance customer experience, all of which contribute to market stability and growth.
However, the auto insurance sector also faces its share of challenges. The rising cost of vehicle repairs, influenced by sophisticated automotive technology and parts, alongside increasing healthcare costs associated with accident-related injuries, exerts upward pressure on premiums. Regulatory changes and intense competition among a large number of global and regional players, including giants like Allianz, AXA, and American International Group, also necessitate strategic adaptation. The market is segmented by application into Personal and Commercial, with Personal likely dominating due to higher individual vehicle ownership. Within the types of coverage, Third-party Liability remains a foundational segment, while Third-party Fire and Theft and Comprehensive policies cater to a broader spectrum of consumer needs. The market's geographical distribution sees North America and Europe as mature but significant regions, with Asia Pacific exhibiting the most dynamic growth potential driven by a rapidly expanding middle class and burgeoning automotive industry.
Comprehensive Auto Insurance Market Report: Analysis, Trends, and Future Outlook (2019-2033)
This in-depth report provides a critical analysis of the global auto insurance market, offering unparalleled insights for industry stakeholders. Covering the historical period from 2019 to 2024 and projecting growth through 2033, with a base and estimated year of 2025, this report delves into market dynamics, leading trends, regional dominance, product innovations, growth drivers, challenges, and emerging opportunities. We examine key segments including Personal and Commercial applications, and types such as Third-party Liability, Third-party Fire and Theft, and Comprehensive coverage. With a meticulous focus on data-driven analysis, this report empowers strategic decision-making in a rapidly evolving industry.
Auto Insurance Market Dynamics & Concentration
The global auto insurance market is characterized by a dynamic interplay of established giants and emerging innovators. Market concentration is notable, with a significant portion of the $XX trillion market share held by a few key players. Innovation drivers are transforming the landscape, fueled by advancements in telematics, artificial intelligence for underwriting and claims processing, and the burgeoning connected car ecosystem. Regulatory frameworks continue to shape market access and product offerings, with varying degrees of stringency across different jurisdictions. Product substitutes, while limited in core auto insurance, emerge in the form of sophisticated risk management solutions and pay-per-mile insurance models, challenging traditional premium structures. End-user trends highlight a growing demand for personalized policies, digital self-service options, and transparent pricing. Mergers and acquisitions (M&A) activities remain a significant factor in market consolidation and strategic expansion, with an estimated XX M&A deals contributing to market shifts over the study period.
- Market Share Concentration: A substantial percentage of the $XX trillion market is dominated by a select group of leading insurers.
- Innovation Drivers: Telematics, AI in underwriting, and connected car data are revolutionizing policy customization and risk assessment.
- Regulatory Impact: Evolving regulations influence product development, pricing, and market entry strategies globally.
- Product Substitutes: Pay-per-mile insurance and advanced risk management tools are offering alternatives to traditional coverage.
- End-User Preferences: Consumers increasingly seek digital engagement, personalized policies, and transparent pricing.
- M&A Activity: Strategic acquisitions and mergers are crucial for market consolidation and competitive advantage, with XX significant deals recorded.
Auto Insurance Industry Trends & Analysis
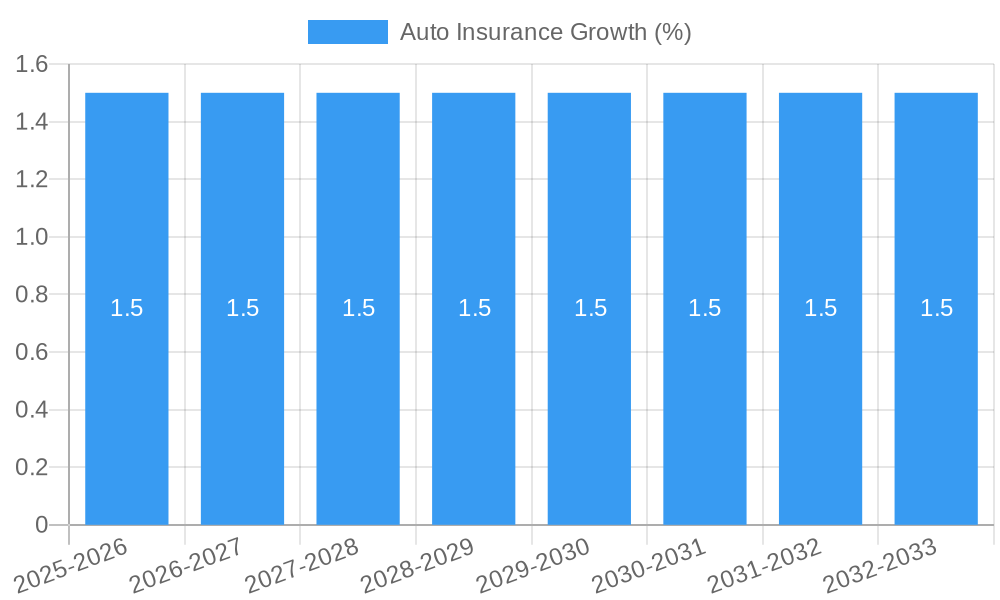
The auto insurance industry is experiencing robust growth, projected to reach $XX trillion by 2033, exhibiting a Compound Annual Growth Rate (CAGR) of XX% during the forecast period (2025–2033). This expansion is propelled by several interconnected trends. The increasing global vehicle parc, particularly in emerging economies, directly correlates with a larger addressable market for auto insurance. Technological disruptions are profoundly reshaping the industry. Telematics, enabled by IoT devices in vehicles, is facilitating usage-based insurance (UBI) programs, allowing insurers to offer personalized premiums based on driving behavior. This shift from a one-size-fits-all approach to data-driven underwriting is a significant departure from historical practices. Artificial intelligence and machine learning are streamlining claims processing, reducing fraud, and improving risk assessment accuracy. The rise of autonomous vehicles, while still in its nascent stages, presents both opportunities and challenges, requiring insurers to adapt to new risk profiles and liability frameworks.
Consumer preferences are evolving rapidly, with a strong emphasis on digital-first experiences. Customers expect seamless online policy purchase, self-service portals for managing their policies, and efficient digital claims submission and tracking. The demand for greater transparency in pricing and coverage is also growing, putting pressure on insurers to simplify complex policy language and provide clear value propositions. Competitive dynamics are intensifying, with traditional insurers facing competition from insurtech startups and large technology companies entering the insurance space. This competitive pressure is driving innovation and pushing incumbents to adopt agile business models. Market penetration for auto insurance remains high in developed markets, with an average of XX% of eligible vehicles insured. However, significant growth potential exists in developing regions where vehicle ownership is rising, and insurance adoption rates are still comparatively lower. The integration of ESG (Environmental, Social, and Governance) factors into insurance products and operations is also becoming a significant trend, reflecting growing societal and investor expectations.
Leading Markets & Segments in Auto Insurance
The Personal auto insurance segment consistently demonstrates dominance, driven by the sheer volume of individual vehicle owners worldwide. In 2025, it is estimated to represent XX% of the total auto insurance market. This segment's growth is intrinsically linked to rising disposable incomes, increasing urbanization, and the persistent reliance on personal vehicles for transportation across major economies. Within this segment, Comprehensive coverage often leads in market penetration due to its broader protection against a wider array of risks, including theft, vandalism, and natural disasters, appealing to vehicle owners seeking complete peace of mind. The market penetration for Comprehensive coverage is estimated at XX% in 2025, significantly higher than other types.
The Commercial auto insurance segment, while smaller in overall market share at XX%, is a significant contributor to growth, especially within rapidly developing economies and business sectors. This segment caters to businesses that use vehicles for operations, ranging from small delivery fleets to large logistics companies. The increasing complexity of business operations and the heightened regulatory scrutiny on commercial vehicle usage contribute to the demand for robust and tailored commercial auto insurance policies.
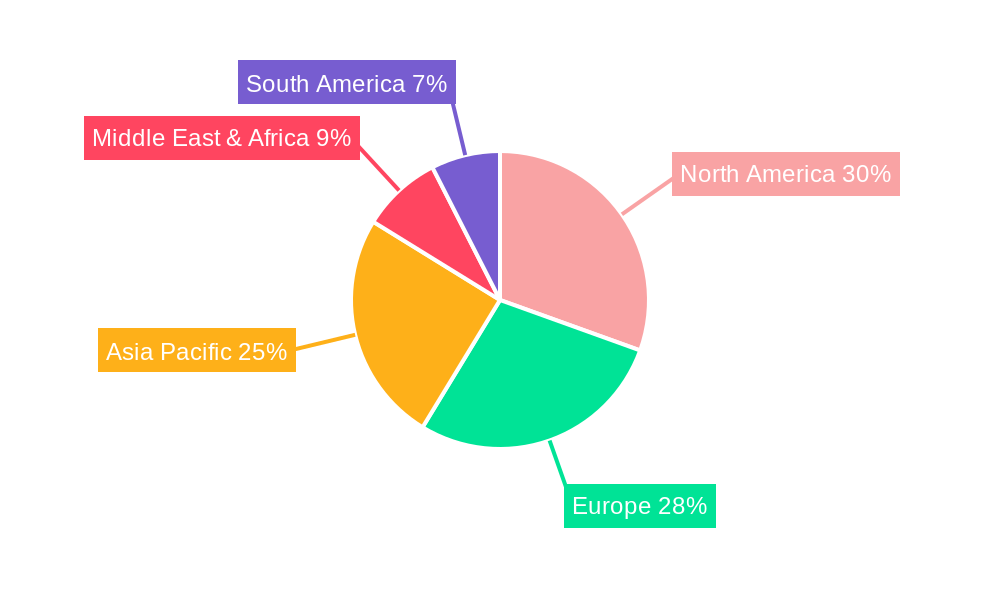
Geographically, North America and Europe currently lead the global auto insurance market, collectively accounting for approximately XX% of the total market value. This dominance is attributed to mature automotive markets, high vehicle ownership rates, and well-established regulatory frameworks that foster robust insurance penetration. However, the Asia-Pacific region is emerging as the fastest-growing market, driven by rapid economic expansion, a burgeoning middle class, and a significant increase in vehicle sales. Countries like China and India are pivotal to this growth, with their insurance markets projected to expand at a CAGR of XX% between 2025 and 2033.
- Dominant Application: The Personal auto insurance segment, accounting for XX% of the market, is driven by individual car ownership and transportation needs.
- Leading Type: Comprehensive coverage, with an estimated XX% market penetration, offers broad protection and is highly favored by consumers.
- Key Drivers of Personal Segment Dominance:
- Increasing global vehicle parc and rising disposable incomes.
- Urbanization leading to higher demand for private transportation.
- Persistent reliance on personal vehicles for daily commutes and travel.
- Commercial Segment Growth Catalysts:
- Expansion of logistics and delivery services.
- Evolving business needs for fleet management and operational safety.
- Stricter regulations for commercial vehicle insurance.
- Regional Market Leadership: North America and Europe maintain leadership, but the Asia-Pacific region is poised for the fastest growth.
- Key Drivers of Regional Dominance:
- North America & Europe: Mature automotive markets, high insurance penetration, established regulatory landscapes.
- Asia-Pacific: Rapid economic growth, increasing vehicle sales, growing middle class, expanding insurance adoption.
Auto Insurance Product Developments
Product innovation in the auto insurance sector is increasingly focused on leveraging technology to offer more personalized and adaptive coverage. Telematics-driven policies, such as pay-as-you-drive and pay-how-you-drive, are gaining traction, allowing policyholders to benefit from safe driving habits. Insurers are also developing specialized products for emerging vehicle types, including electric vehicles (EVs) and autonomous vehicles, addressing unique risks and repair requirements. The integration of AI in claims processing streamlines the entire customer journey, from initial reporting to settlement, significantly reducing turnaround times and enhancing customer satisfaction. Cybersecurity insurance add-ons for connected cars are also becoming crucial, protecting drivers from data breaches and vehicle hacking. These advancements not only create competitive advantages for insurers but also provide greater value and tailored solutions to policyholders, meeting the evolving demands of the modern driver.
Key Drivers of Auto Insurance Growth
The auto insurance market's expansion is propelled by a confluence of technological, economic, and regulatory factors. The proliferation of vehicles globally, particularly in emerging economies, forms the bedrock of demand. Technological advancements, such as telematics and AI, are enabling insurers to offer more personalized and efficient products, driving adoption and customer loyalty. Economic growth, characterized by rising disposable incomes and expanding middle classes, directly correlates with increased vehicle ownership and, consequently, auto insurance purchases. Furthermore, evolving regulatory frameworks in many regions are mandating higher levels of coverage, thereby expanding the market. The increasing adoption of electric vehicles and the ongoing development of autonomous driving technologies also present new avenues for product development and market growth, necessitating specialized insurance solutions.
Challenges in the Auto Insurance Market
Despite robust growth, the auto insurance market faces several significant challenges. Intense competition from both traditional insurers and agile insurtech startups exerts downward pressure on premiums and margins. Evolving regulatory landscapes, while sometimes driving growth, can also introduce compliance complexities and unpredictable changes. Supply chain disruptions, particularly in the automotive sector, can lead to longer repair times and increased claim costs, impacting profitability. Fraudulent claims remain a persistent issue, requiring significant investment in detection and prevention technologies. Moreover, the increasing sophistication of cyber threats targeting connected vehicles necessitates constant adaptation of coverage and risk mitigation strategies. The transition to new vehicle technologies, such as EVs and autonomous vehicles, also presents an underwriting challenge as historical data for these risks is limited.
Emerging Opportunities in Auto Insurance
The future of auto insurance is ripe with emerging opportunities, driven by technological breakthroughs and evolving consumer needs. The widespread adoption of telematics and AI presents a significant opportunity for personalized insurance products, rewarding safe drivers and enabling dynamic pricing. The burgeoning autonomous vehicle market, while presenting challenges, will also create new liability and risk management paradigms that insurers can cater to. Strategic partnerships between insurers, automakers, and technology providers will unlock innovative data-sharing models, leading to more accurate risk assessment and enhanced customer experiences. Market expansion into underserved regions with growing vehicle ownership offers substantial untapped potential. Furthermore, the increasing focus on sustainability and ESG factors creates opportunities for developing green insurance products and promoting eco-friendly driving behaviors.
Leading Players in the Auto Insurance Sector
- Allian
- AXA
- Assicurazioni Generali S.p.A.
- The Allstate Corporation
- American International Group, Inc.
- Berkshire Hathaway
- Zurich Insurance Group Ltd
- Prudential plc
- PICC
- Progressive Corporation
- Ping An
- Sompo Japan
- Tokyo Marine
- Travelers Group
- Liberty Mutual Group
- CPIC
- Nationwide
- Mitsui Sumitomo Insurance
- Aviva
- Old Republic International
- Auto Owners Grp
Key Milestones in Auto Insurance Industry
- 2019: Increased adoption of telematics and usage-based insurance (UBI) programs, offering personalized premiums based on driving behavior.
- 2020: Rise of digital-first insurance platforms and mobile applications, enhancing customer convenience and self-service capabilities.
- 2021: Growing focus on AI and machine learning for claims processing automation and fraud detection, leading to faster settlement times and reduced costs.
- 2022: Emergence of specialized insurance products for electric vehicles (EVs), addressing unique repair needs and battery coverage.
- 2023: Intensified M&A activity as larger insurers seek to acquire insurtech capabilities and expand market share.
- 2024: Initial discussions and pilot programs around insurance frameworks for autonomous vehicles begin to gain momentum.
- 2025 (Estimated): Significant market shifts anticipated due to the increasing integration of connected car data for real-time risk assessment.
Strategic Outlook for Auto Insurance Market
The strategic outlook for the auto insurance market is one of continued innovation and adaptation. Growth accelerators will be driven by the deeper integration of telematics and AI into underwriting and claims processes, leading to hyper-personalized products and enhanced operational efficiency. The ongoing evolution of vehicle technology, including advancements in autonomous driving and electrification, will necessitate the development of specialized insurance solutions and foster new partnerships within the automotive ecosystem. Insurers that embrace digital transformation, prioritize customer-centricity, and effectively manage evolving risks will be best positioned for success. Strategic focus on emerging markets and the development of flexible, technology-enabled products will be crucial for capturing future growth opportunities and maintaining a competitive edge in this dynamic sector.
Auto Insurance Segmentation
-
1. Application
- 1.1. Personal
- 1.2. Commercial
-
2. Types
- 2.1. Third-party Liability
- 2.2. Third-party Fire and Theft
- 2.3. Comprehensive
Auto Insurance Segmentation By Geography
-
1. North America
- 1.1. United States
- 1.2. Canada
- 1.3. Mexico
-
2. South America
- 2.1. Brazil
- 2.2. Argentina
- 2.3. Rest of South America
-
3. Europe
- 3.1. United Kingdom
- 3.2. Germany
- 3.3. France
- 3.4. Italy
- 3.5. Spain
- 3.6. Russia
- 3.7. Benelux
- 3.8. Nordics
- 3.9. Rest of Europe
-
4. Middle East & Africa
- 4.1. Turkey
- 4.2. Israel
- 4.3. GCC
- 4.4. North Africa
- 4.5. South Africa
- 4.6. Rest of Middle East & Africa
-
5. Asia Pacific
- 5.1. China
- 5.2. India
- 5.3. Japan
- 5.4. South Korea
- 5.5. ASEAN
- 5.6. Oceania
- 5.7. Rest of Asia Pacific
Auto Insurance REPORT HIGHLIGHTS
| Aspects | Details |
|---|---|
| Study Period | 2019-2033 |
| Base Year | 2024 |
| Estimated Year | 2025 |
| Forecast Period | 2025-2033 |
| Historical Period | 2019-2024 |
| Growth Rate | CAGR of 1.5% from 2019-2033 |
| Segmentation |
|
Table of Contents
- 1. Introduction
- 1.1. Research Scope
- 1.2. Market Segmentation
- 1.3. Research Methodology
- 1.4. Definitions and Assumptions
- 2. Executive Summary
- 2.1. Introduction
- 3. Market Dynamics
- 3.1. Introduction
- 3.2. Market Drivers
- 3.3. Market Restrains
- 3.4. Market Trends
- 4. Market Factor Analysis
- 4.1. Porters Five Forces
- 4.2. Supply/Value Chain
- 4.3. PESTEL analysis
- 4.4. Market Entropy
- 4.5. Patent/Trademark Analysis
- 5. Global Auto Insurance Analysis, Insights and Forecast, 2019-2031
- 5.1. Market Analysis, Insights and Forecast - by Application
- 5.1.1. Personal
- 5.1.2. Commercial
- 5.2. Market Analysis, Insights and Forecast - by Types
- 5.2.1. Third-party Liability
- 5.2.2. Third-party Fire and Theft
- 5.2.3. Comprehensive
- 5.3. Market Analysis, Insights and Forecast - by Region
- 5.3.1. North America
- 5.3.2. South America
- 5.3.3. Europe
- 5.3.4. Middle East & Africa
- 5.3.5. Asia Pacific
- 5.1. Market Analysis, Insights and Forecast - by Application
- 6. North America Auto Insurance Analysis, Insights and Forecast, 2019-2031
- 6.1. Market Analysis, Insights and Forecast - by Application
- 6.1.1. Personal
- 6.1.2. Commercial
- 6.2. Market Analysis, Insights and Forecast - by Types
- 6.2.1. Third-party Liability
- 6.2.2. Third-party Fire and Theft
- 6.2.3. Comprehensive
- 6.1. Market Analysis, Insights and Forecast - by Application
- 7. South America Auto Insurance Analysis, Insights and Forecast, 2019-2031
- 7.1. Market Analysis, Insights and Forecast - by Application
- 7.1.1. Personal
- 7.1.2. Commercial
- 7.2. Market Analysis, Insights and Forecast - by Types
- 7.2.1. Third-party Liability
- 7.2.2. Third-party Fire and Theft
- 7.2.3. Comprehensive
- 7.1. Market Analysis, Insights and Forecast - by Application
- 8. Europe Auto Insurance Analysis, Insights and Forecast, 2019-2031
- 8.1. Market Analysis, Insights and Forecast - by Application
- 8.1.1. Personal
- 8.1.2. Commercial
- 8.2. Market Analysis, Insights and Forecast - by Types
- 8.2.1. Third-party Liability
- 8.2.2. Third-party Fire and Theft
- 8.2.3. Comprehensive
- 8.1. Market Analysis, Insights and Forecast - by Application
- 9. Middle East & Africa Auto Insurance Analysis, Insights and Forecast, 2019-2031
- 9.1. Market Analysis, Insights and Forecast - by Application
- 9.1.1. Personal
- 9.1.2. Commercial
- 9.2. Market Analysis, Insights and Forecast - by Types
- 9.2.1. Third-party Liability
- 9.2.2. Third-party Fire and Theft
- 9.2.3. Comprehensive
- 9.1. Market Analysis, Insights and Forecast - by Application
- 10. Asia Pacific Auto Insurance Analysis, Insights and Forecast, 2019-2031
- 10.1. Market Analysis, Insights and Forecast - by Application
- 10.1.1. Personal
- 10.1.2. Commercial
- 10.2. Market Analysis, Insights and Forecast - by Types
- 10.2.1. Third-party Liability
- 10.2.2. Third-party Fire and Theft
- 10.2.3. Comprehensive
- 10.1. Market Analysis, Insights and Forecast - by Application
- 11. Competitive Analysis
- 11.1. Global Market Share Analysis 2024
- 11.2. Company Profiles
- 11.2.1 Allian
- 11.2.1.1. Overview
- 11.2.1.2. Products
- 11.2.1.3. SWOT Analysis
- 11.2.1.4. Recent Developments
- 11.2.1.5. Financials (Based on Availability)
- 11.2.2 AXA
- 11.2.2.1. Overview
- 11.2.2.2. Products
- 11.2.2.3. SWOT Analysis
- 11.2.2.4. Recent Developments
- 11.2.2.5. Financials (Based on Availability)
- 11.2.3 Assicurazioni Generali S.p.A.
- 11.2.3.1. Overview
- 11.2.3.2. Products
- 11.2.3.3. SWOT Analysis
- 11.2.3.4. Recent Developments
- 11.2.3.5. Financials (Based on Availability)
- 11.2.4 The Allstate Corporation
- 11.2.4.1. Overview
- 11.2.4.2. Products
- 11.2.4.3. SWOT Analysis
- 11.2.4.4. Recent Developments
- 11.2.4.5. Financials (Based on Availability)
- 11.2.5 American International Group
- 11.2.5.1. Overview
- 11.2.5.2. Products
- 11.2.5.3. SWOT Analysis
- 11.2.5.4. Recent Developments
- 11.2.5.5. Financials (Based on Availability)
- 11.2.6 Inc
- 11.2.6.1. Overview
- 11.2.6.2. Products
- 11.2.6.3. SWOT Analysis
- 11.2.6.4. Recent Developments
- 11.2.6.5. Financials (Based on Availability)
- 11.2.7 Berkshire Hathaway
- 11.2.7.1. Overview
- 11.2.7.2. Products
- 11.2.7.3. SWOT Analysis
- 11.2.7.4. Recent Developments
- 11.2.7.5. Financials (Based on Availability)
- 11.2.8 Zurich Insurance Group Ltd
- 11.2.8.1. Overview
- 11.2.8.2. Products
- 11.2.8.3. SWOT Analysis
- 11.2.8.4. Recent Developments
- 11.2.8.5. Financials (Based on Availability)
- 11.2.9 Prudential plc
- 11.2.9.1. Overview
- 11.2.9.2. Products
- 11.2.9.3. SWOT Analysis
- 11.2.9.4. Recent Developments
- 11.2.9.5. Financials (Based on Availability)
- 11.2.10 PICC
- 11.2.10.1. Overview
- 11.2.10.2. Products
- 11.2.10.3. SWOT Analysis
- 11.2.10.4. Recent Developments
- 11.2.10.5. Financials (Based on Availability)
- 11.2.11 Progressive Corporation
- 11.2.11.1. Overview
- 11.2.11.2. Products
- 11.2.11.3. SWOT Analysis
- 11.2.11.4. Recent Developments
- 11.2.11.5. Financials (Based on Availability)
- 11.2.12 Ping An
- 11.2.12.1. Overview
- 11.2.12.2. Products
- 11.2.12.3. SWOT Analysis
- 11.2.12.4. Recent Developments
- 11.2.12.5. Financials (Based on Availability)
- 11.2.13 Sompo Japan
- 11.2.13.1. Overview
- 11.2.13.2. Products
- 11.2.13.3. SWOT Analysis
- 11.2.13.4. Recent Developments
- 11.2.13.5. Financials (Based on Availability)
- 11.2.14 Tokyo Marine
- 11.2.14.1. Overview
- 11.2.14.2. Products
- 11.2.14.3. SWOT Analysis
- 11.2.14.4. Recent Developments
- 11.2.14.5. Financials (Based on Availability)
- 11.2.15 Travelers Group
- 11.2.15.1. Overview
- 11.2.15.2. Products
- 11.2.15.3. SWOT Analysis
- 11.2.15.4. Recent Developments
- 11.2.15.5. Financials (Based on Availability)
- 11.2.16 Liberty Mutual Group
- 11.2.16.1. Overview
- 11.2.16.2. Products
- 11.2.16.3. SWOT Analysis
- 11.2.16.4. Recent Developments
- 11.2.16.5. Financials (Based on Availability)
- 11.2.17 CPIC
- 11.2.17.1. Overview
- 11.2.17.2. Products
- 11.2.17.3. SWOT Analysis
- 11.2.17.4. Recent Developments
- 11.2.17.5. Financials (Based on Availability)
- 11.2.18 Nationwide
- 11.2.18.1. Overview
- 11.2.18.2. Products
- 11.2.18.3. SWOT Analysis
- 11.2.18.4. Recent Developments
- 11.2.18.5. Financials (Based on Availability)
- 11.2.19 Mitsui Sumitomo Insurance
- 11.2.19.1. Overview
- 11.2.19.2. Products
- 11.2.19.3. SWOT Analysis
- 11.2.19.4. Recent Developments
- 11.2.19.5. Financials (Based on Availability)
- 11.2.20 Aviva
- 11.2.20.1. Overview
- 11.2.20.2. Products
- 11.2.20.3. SWOT Analysis
- 11.2.20.4. Recent Developments
- 11.2.20.5. Financials (Based on Availability)
- 11.2.21 Old Republic International
- 11.2.21.1. Overview
- 11.2.21.2. Products
- 11.2.21.3. SWOT Analysis
- 11.2.21.4. Recent Developments
- 11.2.21.5. Financials (Based on Availability)
- 11.2.22 Auto Owners Grp
- 11.2.22.1. Overview
- 11.2.22.2. Products
- 11.2.22.3. SWOT Analysis
- 11.2.22.4. Recent Developments
- 11.2.22.5. Financials (Based on Availability)
- 11.2.1 Allian
List of Figures
- Figure 1: Global Auto Insurance Revenue Breakdown (million, %) by Region 2024 & 2032
- Figure 2: North America Auto Insurance Revenue (million), by Application 2024 & 2032
- Figure 3: North America Auto Insurance Revenue Share (%), by Application 2024 & 2032
- Figure 4: North America Auto Insurance Revenue (million), by Types 2024 & 2032
- Figure 5: North America Auto Insurance Revenue Share (%), by Types 2024 & 2032
- Figure 6: North America Auto Insurance Revenue (million), by Country 2024 & 2032
- Figure 7: North America Auto Insurance Revenue Share (%), by Country 2024 & 2032
- Figure 8: South America Auto Insurance Revenue (million), by Application 2024 & 2032
- Figure 9: South America Auto Insurance Revenue Share (%), by Application 2024 & 2032
- Figure 10: South America Auto Insurance Revenue (million), by Types 2024 & 2032
- Figure 11: South America Auto Insurance Revenue Share (%), by Types 2024 & 2032
- Figure 12: South America Auto Insurance Revenue (million), by Country 2024 & 2032
- Figure 13: South America Auto Insurance Revenue Share (%), by Country 2024 & 2032
- Figure 14: Europe Auto Insurance Revenue (million), by Application 2024 & 2032
- Figure 15: Europe Auto Insurance Revenue Share (%), by Application 2024 & 2032
- Figure 16: Europe Auto Insurance Revenue (million), by Types 2024 & 2032
- Figure 17: Europe Auto Insurance Revenue Share (%), by Types 2024 & 2032
- Figure 18: Europe Auto Insurance Revenue (million), by Country 2024 & 2032
- Figure 19: Europe Auto Insurance Revenue Share (%), by Country 2024 & 2032
- Figure 20: Middle East & Africa Auto Insurance Revenue (million), by Application 2024 & 2032
- Figure 21: Middle East & Africa Auto Insurance Revenue Share (%), by Application 2024 & 2032
- Figure 22: Middle East & Africa Auto Insurance Revenue (million), by Types 2024 & 2032
- Figure 23: Middle East & Africa Auto Insurance Revenue Share (%), by Types 2024 & 2032
- Figure 24: Middle East & Africa Auto Insurance Revenue (million), by Country 2024 & 2032
- Figure 25: Middle East & Africa Auto Insurance Revenue Share (%), by Country 2024 & 2032
- Figure 26: Asia Pacific Auto Insurance Revenue (million), by Application 2024 & 2032
- Figure 27: Asia Pacific Auto Insurance Revenue Share (%), by Application 2024 & 2032
- Figure 28: Asia Pacific Auto Insurance Revenue (million), by Types 2024 & 2032
- Figure 29: Asia Pacific Auto Insurance Revenue Share (%), by Types 2024 & 2032
- Figure 30: Asia Pacific Auto Insurance Revenue (million), by Country 2024 & 2032
- Figure 31: Asia Pacific Auto Insurance Revenue Share (%), by Country 2024 & 2032
List of Tables
- Table 1: Global Auto Insurance Revenue million Forecast, by Region 2019 & 2032
- Table 2: Global Auto Insurance Revenue million Forecast, by Application 2019 & 2032
- Table 3: Global Auto Insurance Revenue million Forecast, by Types 2019 & 2032
- Table 4: Global Auto Insurance Revenue million Forecast, by Region 2019 & 2032
- Table 5: Global Auto Insurance Revenue million Forecast, by Application 2019 & 2032
- Table 6: Global Auto Insurance Revenue million Forecast, by Types 2019 & 2032
- Table 7: Global Auto Insurance Revenue million Forecast, by Country 2019 & 2032
- Table 8: United States Auto Insurance Revenue (million) Forecast, by Application 2019 & 2032
- Table 9: Canada Auto Insurance Revenue (million) Forecast, by Application 2019 & 2032
- Table 10: Mexico Auto Insurance Revenue (million) Forecast, by Application 2019 & 2032
- Table 11: Global Auto Insurance Revenue million Forecast, by Application 2019 & 2032
- Table 12: Global Auto Insurance Revenue million Forecast, by Types 2019 & 2032
- Table 13: Global Auto Insurance Revenue million Forecast, by Country 2019 & 2032
- Table 14: Brazil Auto Insurance Revenue (million) Forecast, by Application 2019 & 2032
- Table 15: Argentina Auto Insurance Revenue (million) Forecast, by Application 2019 & 2032
- Table 16: Rest of South America Auto Insurance Revenue (million) Forecast, by Application 2019 & 2032
- Table 17: Global Auto Insurance Revenue million Forecast, by Application 2019 & 2032
- Table 18: Global Auto Insurance Revenue million Forecast, by Types 2019 & 2032
- Table 19: Global Auto Insurance Revenue million Forecast, by Country 2019 & 2032
- Table 20: United Kingdom Auto Insurance Revenue (million) Forecast, by Application 2019 & 2032
- Table 21: Germany Auto Insurance Revenue (million) Forecast, by Application 2019 & 2032
- Table 22: France Auto Insurance Revenue (million) Forecast, by Application 2019 & 2032
- Table 23: Italy Auto Insurance Revenue (million) Forecast, by Application 2019 & 2032
- Table 24: Spain Auto Insurance Revenue (million) Forecast, by Application 2019 & 2032
- Table 25: Russia Auto Insurance Revenue (million) Forecast, by Application 2019 & 2032
- Table 26: Benelux Auto Insurance Revenue (million) Forecast, by Application 2019 & 2032
- Table 27: Nordics Auto Insurance Revenue (million) Forecast, by Application 2019 & 2032
- Table 28: Rest of Europe Auto Insurance Revenue (million) Forecast, by Application 2019 & 2032
- Table 29: Global Auto Insurance Revenue million Forecast, by Application 2019 & 2032
- Table 30: Global Auto Insurance Revenue million Forecast, by Types 2019 & 2032
- Table 31: Global Auto Insurance Revenue million Forecast, by Country 2019 & 2032
- Table 32: Turkey Auto Insurance Revenue (million) Forecast, by Application 2019 & 2032
- Table 33: Israel Auto Insurance Revenue (million) Forecast, by Application 2019 & 2032
- Table 34: GCC Auto Insurance Revenue (million) Forecast, by Application 2019 & 2032
- Table 35: North Africa Auto Insurance Revenue (million) Forecast, by Application 2019 & 2032
- Table 36: South Africa Auto Insurance Revenue (million) Forecast, by Application 2019 & 2032
- Table 37: Rest of Middle East & Africa Auto Insurance Revenue (million) Forecast, by Application 2019 & 2032
- Table 38: Global Auto Insurance Revenue million Forecast, by Application 2019 & 2032
- Table 39: Global Auto Insurance Revenue million Forecast, by Types 2019 & 2032
- Table 40: Global Auto Insurance Revenue million Forecast, by Country 2019 & 2032
- Table 41: China Auto Insurance Revenue (million) Forecast, by Application 2019 & 2032
- Table 42: India Auto Insurance Revenue (million) Forecast, by Application 2019 & 2032
- Table 43: Japan Auto Insurance Revenue (million) Forecast, by Application 2019 & 2032
- Table 44: South Korea Auto Insurance Revenue (million) Forecast, by Application 2019 & 2032
- Table 45: ASEAN Auto Insurance Revenue (million) Forecast, by Application 2019 & 2032
- Table 46: Oceania Auto Insurance Revenue (million) Forecast, by Application 2019 & 2032
- Table 47: Rest of Asia Pacific Auto Insurance Revenue (million) Forecast, by Application 2019 & 2032
Frequently Asked Questions
1. What is the projected Compound Annual Growth Rate (CAGR) of the Auto Insurance?
The projected CAGR is approximately 1.5%.
2. Which companies are prominent players in the Auto Insurance?
Key companies in the market include Allian, AXA, Assicurazioni Generali S.p.A., The Allstate Corporation, American International Group, Inc, Berkshire Hathaway, Zurich Insurance Group Ltd, Prudential plc, PICC, Progressive Corporation, Ping An, Sompo Japan, Tokyo Marine, Travelers Group, Liberty Mutual Group, CPIC, Nationwide, Mitsui Sumitomo Insurance, Aviva, Old Republic International, Auto Owners Grp.
3. What are the main segments of the Auto Insurance?
The market segments include Application, Types.
4. Can you provide details about the market size?
The market size is estimated to be USD 206170 million as of 2022.
5. What are some drivers contributing to market growth?
N/A
6. What are the notable trends driving market growth?
N/A
7. Are there any restraints impacting market growth?
N/A
8. Can you provide examples of recent developments in the market?
N/A
9. What pricing options are available for accessing the report?
Pricing options include single-user, multi-user, and enterprise licenses priced at USD 4900.00, USD 7350.00, and USD 9800.00 respectively.
10. Is the market size provided in terms of value or volume?
The market size is provided in terms of value, measured in million.
11. Are there any specific market keywords associated with the report?
Yes, the market keyword associated with the report is "Auto Insurance," which aids in identifying and referencing the specific market segment covered.
12. How do I determine which pricing option suits my needs best?
The pricing options vary based on user requirements and access needs. Individual users may opt for single-user licenses, while businesses requiring broader access may choose multi-user or enterprise licenses for cost-effective access to the report.
13. Are there any additional resources or data provided in the Auto Insurance report?
While the report offers comprehensive insights, it's advisable to review the specific contents or supplementary materials provided to ascertain if additional resources or data are available.
14. How can I stay updated on further developments or reports in the Auto Insurance?
To stay informed about further developments, trends, and reports in the Auto Insurance, consider subscribing to industry newsletters, following relevant companies and organizations, or regularly checking reputable industry news sources and publications.
Methodology
Step 1 - Identification of Relevant Samples Size from Population Database


Step 2 - Approaches for Defining Global Market Size (Value, Volume* & Price*)

Note*: In applicable scenarios
Step 3 - Data Sources
Primary Research
- Web Analytics
- Survey Reports
- Research Institute
- Latest Research Reports
- Opinion Leaders
Secondary Research
- Annual Reports
- White Paper
- Latest Press Release
- Industry Association
- Paid Database
- Investor Presentations

Step 4 - Data Triangulation
Involves using different sources of information in order to increase the validity of a study
These sources are likely to be stakeholders in a program - participants, other researchers, program staff, other community members, and so on.
Then we put all data in single framework & apply various statistical tools to find out the dynamic on the market.
During the analysis stage, feedback from the stakeholder groups would be compared to determine areas of agreement as well as areas of divergence
