

Key Insights
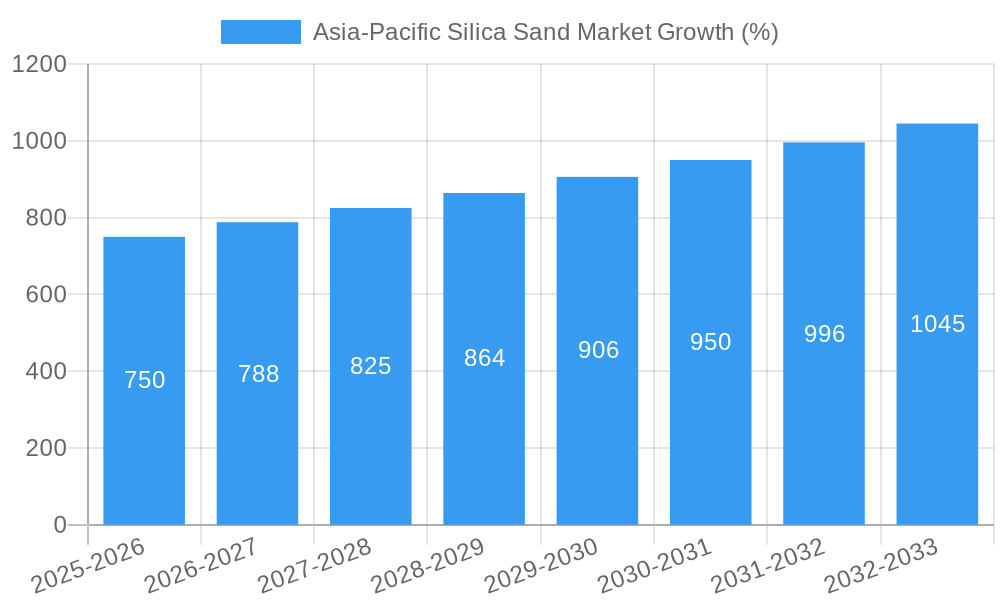
The Asia-Pacific silica sand market is experiencing robust growth, projected to reach a substantial size by 2033. A Compound Annual Growth Rate (CAGR) of 5.12% from 2019 to 2024 indicates a consistently expanding market driven by the increasing demand from various industries. Key drivers include the booming construction sector, particularly in rapidly developing economies across the region, which necessitates large quantities of silica sand for concrete production and other applications. Furthermore, the burgeoning glass manufacturing industry, fueled by rising urbanization and infrastructure development, significantly contributes to the market's expansion. The growth is further propelled by the rising demand for silica sand in the burgeoning renewable energy sector, notably solar panel manufacturing, which utilizes high-purity silica for photovoltaic cells. However, environmental concerns surrounding silica sand mining and transportation, along with stringent regulations aimed at mitigating their impact, pose some restraints to market growth. Competition is intense, with both large multinational corporations and regional players vying for market share. The market is segmented by application (glass manufacturing, construction, foundry, etc.) and by geographical region, with specific countries within Asia-Pacific exhibiting varying levels of growth depending on their economic development and industrial landscape. The market is expected to witness technological advancements in silica sand processing and purification, leading to the increased availability of high-quality silica sand for specialized applications. This will further fuel market expansion in the coming years.
The forecast period of 2025-2033 anticipates continued growth, driven by ongoing infrastructure projects and industrial expansion across the Asia-Pacific region. While challenges related to sustainable mining practices and environmental regulations persist, ongoing innovation in processing technologies and the increasing demand from high-growth industries will likely outweigh these restraints. The market's competitive landscape continues to evolve, with strategic mergers, acquisitions, and partnerships shaping the industry dynamics. The emergence of new technologies, specifically those focusing on efficiency and environmental sustainability in silica sand extraction and processing, will further influence market growth. Analyzing specific regional data within Asia-Pacific will reveal significant market variations, with some economies experiencing higher growth rates than others due to factors such as economic policy, infrastructural development, and government initiatives promoting sustainable industrial growth.

Asia-Pacific Silica Sand Market Report: 2019-2033 Forecast
Dive deep into the lucrative Asia-Pacific silica sand market with this comprehensive report, offering invaluable insights for strategic decision-making. This in-depth analysis covers market dynamics, industry trends, leading players, and future growth opportunities from 2019 to 2033, with a focus on 2025. The report provides crucial data points for stakeholders across the value chain, including manufacturers, distributors, and investors. Benefit from our detailed segmentation, competitive landscape analysis, and future projections to gain a decisive edge in this dynamic market.
This report covers:
- Market size and forecast in Million USD for the period 2019-2033.
- Detailed segmentation analysis across various applications and geographical regions.
- In-depth competitive landscape analysis including market share and M&A activity.
- Identification of key growth drivers and challenges impacting market growth.
- Strategic recommendations to capitalize on emerging opportunities.
Asia-Pacific Silica Sand Market Market Dynamics & Concentration
The Asia-Pacific silica sand market exhibits a moderately concentrated landscape, with several major players controlling a significant market share. The market share distribution shows a xx% concentration among the top 5 players in 2024. However, the market is witnessing increased competition from smaller, niche players focusing on specialized applications. Innovation is a key driver, with companies investing in advanced processing technologies to improve the quality and consistency of silica sand products. Stringent environmental regulations, particularly related to mining and processing, are shaping market dynamics. Product substitutes, such as synthetic silica, are gaining traction in certain applications, creating competitive pressure. End-user trends indicate a growing demand for high-purity silica sand in various industries, driving market growth. The historical period (2019-2024) saw a moderate level of M&A activity, with approximately xx deals recorded. The forecast period (2025-2033) is expected to see an increase, driven by consolidation and expansion strategies.
- Market Concentration: xx% controlled by top 5 players in 2024.
- Innovation Drivers: Advanced processing technologies, high-purity silica demand.
- Regulatory Framework: Stringent environmental regulations impacting mining & processing.
- Product Substitutes: Growing competition from synthetic silica.
- End-User Trends: Increasing demand from construction, glass, and electronics industries.
- M&A Activity: Approximately xx deals recorded during 2019-2024.
Asia-Pacific Silica Sand Market Industry Trends & Analysis
The Asia-Pacific silica sand market is projected to experience significant growth, with a CAGR of xx% during the forecast period (2025-2033). This growth is primarily driven by the booming construction industry in several key Asian economies, coupled with increasing demand from the glass manufacturing and electronics sectors. Technological disruptions, such as the adoption of automated mining and processing techniques, are enhancing efficiency and reducing costs. Consumer preferences are shifting towards higher-quality, consistently graded silica sand for improved product performance. The competitive dynamics are characterized by a mix of large multinational corporations and smaller regional players, creating a dynamic and competitive market landscape. Market penetration is highest in countries with robust infrastructure development and established industrial bases, such as China and Japan. Several factors like government initiatives promoting infrastructure development further boost the market growth.
Leading Markets & Segments in Asia-Pacific Silica Sand Market
China dominates the Asia-Pacific silica sand market, accounting for xx% of the total market share in 2024. This dominance is attributed to several key factors:
- Robust Construction Industry: Significant infrastructure development projects across the country are driving demand.
- Large Glass Manufacturing Sector: China is a major producer and exporter of glass products.
- Government Support for Infrastructure Development: Supportive economic policies and significant government investment.
- Abundant Silica Sand Reserves: The country possesses extensive deposits of high-quality silica sand.
Other key markets include Japan, India, South Korea and Australia. The industrial segment holds the largest share within the Asia-Pacific silica sand market, followed by the construction and glass segments. This dominance stems from the high silica sand consumption across these sectors.
Asia-Pacific Silica Sand Market Product Developments
Recent innovations focus on enhancing silica sand properties through advanced processing techniques. This includes improvements in particle size distribution, purity, and surface area. New applications are emerging in specialized industries, such as high-performance concrete and advanced ceramics. Companies are emphasizing value-added services, such as customized blending and on-site delivery, to improve customer satisfaction and gain a competitive advantage. These developments reflect the increasing demand for specialized silica sand to meet the evolving needs of various industries.
Key Drivers of Asia-Pacific Silica Sand Market Growth
The market's growth is primarily fueled by the booming construction industry across the region, coupled with the rising demand for high-quality silica sand in glass manufacturing, electronics, and other industrial applications. Government initiatives promoting infrastructure development further accelerate this growth. Technological advancements in mining and processing techniques are also improving efficiency and reducing costs.
Challenges in the Asia-Pacific Silica Sand Market Market
The Asia-Pacific silica sand market faces several challenges, including stringent environmental regulations impacting mining and processing activities. Supply chain disruptions, particularly concerning raw material availability and transportation costs, are also a significant factor. Increasing competition from substitute materials like synthetic silica is further adding to the market pressure. These factors collectively impact production costs and overall market profitability.
Emerging Opportunities in Asia-Pacific Silica Sand Market
Significant growth opportunities exist through technological breakthroughs in silica sand processing, enabling the production of higher-quality, specialized products. Strategic partnerships between silica sand producers and downstream users can further unlock market potential. Expanding into new geographic markets and tapping into emerging applications in specialized industries also present significant growth opportunities.
Leading Players in the Asia-Pacific Silica Sand Market Sector
- Fairmount Santrol
- Mitsubishi Corporation
- Mangal Minerals
- PUM GROUP
- JFE MINERAL Co LTD
- Raghav Productivity Enhancers Limited
- Sibelco
- Shivam Chemicals
- TOCHU CORPORATION
- Xinyi Golden Ruite Quartz Materials Co Ltd
- Chongqing Changjiang River Moulding Material (Group) Co Ltd (List Not Exhaustive)
Key Milestones in Asia-Pacific Silica Sand Market Industry
- 2020: Increased investment in automated mining technologies by several key players.
- 2021: Launch of a new high-purity silica sand product by Xinyi Golden Ruite Quartz Materials Co Ltd.
- 2022: Acquisition of a regional silica sand producer by Sibelco.
- 2023: Implementation of stricter environmental regulations in several countries across the region.
- 2024: Significant increase in demand for silica sand from the construction industry. (The complete study details further key milestones.)
Strategic Outlook for Asia-Pacific Silica Sand Market Market
The Asia-Pacific silica sand market presents a compelling growth outlook, driven by sustained infrastructure development, technological advancements, and rising demand from various end-use sectors. Strategic partnerships, investments in innovative processing technologies, and a focus on sustainable mining practices are key success factors for companies looking to capitalize on this thriving market. The market’s future potential lies in meeting the growing demand for specialized, high-quality silica sand applications.
Asia-Pacific Silica Sand Market Segmentation
-
1. End User Industry
- 1.1. Glass Manufacturing
- 1.2. Foundry
- 1.3. Chemical Production
- 1.4. Construction
- 1.5. Paints and Coatings
- 1.6. Ceramics and Refractories
- 1.7. Filtration
- 1.8. Oil and Gas Recovery
- 1.9. Other End User Industries
-
2. Geography
- 2.1. China
- 2.2. India
- 2.3. Japan
- 2.4. South Korea
- 2.5. Indonesia
- 2.6. Thailand
- 2.7. Malaysia
- 2.8. Singapore
- 2.9. Philippines
- 2.10. Vietnam
Asia-Pacific Silica Sand Market Segmentation By Geography
- 1. China
- 2. India
- 3. Japan
- 4. South Korea
- 5. Indonesia
- 6. Thailand
- 7. Malaysia
- 8. Singapore
- 9. Philippines
- 10. Vietnam

Asia-Pacific Silica Sand Market REPORT HIGHLIGHTS
| Aspects | Details |
|---|---|
| Study Period | 2019-2033 |
| Base Year | 2024 |
| Estimated Year | 2025 |
| Forecast Period | 2025-2033 |
| Historical Period | 2019-2024 |
| Growth Rate | CAGR of 5.12% from 2019-2033 |
| Segmentation |
|
Table of Contents
- 1. Introduction
- 1.1. Research Scope
- 1.2. Market Segmentation
- 1.3. Research Methodology
- 1.4. Definitions and Assumptions
- 2. Executive Summary
- 2.1. Introduction
- 3. Market Dynamics
- 3.1. Introduction
- 3.2. Market Drivers
- 3.2.1. Consistent Economic Growth Leading to Increase in Construction; Increasing Use in the Foundry Industry; Others Drivers
- 3.3. Market Restrains
- 3.3.1. Consistent Economic Growth Leading to Increase in Construction; Increasing Use in the Foundry Industry; Others Drivers
- 3.4. Market Trends
- 3.4.1. Increasing Demand from the Glass Industry
- 4. Market Factor Analysis
- 4.1. Porters Five Forces
- 4.2. Supply/Value Chain
- 4.3. PESTEL analysis
- 4.4. Market Entropy
- 4.5. Patent/Trademark Analysis
- 5. Global Asia-Pacific Silica Sand Market Analysis, Insights and Forecast, 2019-2031
- 5.1. Market Analysis, Insights and Forecast - by End User Industry
- 5.1.1. Glass Manufacturing
- 5.1.2. Foundry
- 5.1.3. Chemical Production
- 5.1.4. Construction
- 5.1.5. Paints and Coatings
- 5.1.6. Ceramics and Refractories
- 5.1.7. Filtration
- 5.1.8. Oil and Gas Recovery
- 5.1.9. Other End User Industries
- 5.2. Market Analysis, Insights and Forecast - by Geography
- 5.2.1. China
- 5.2.2. India
- 5.2.3. Japan
- 5.2.4. South Korea
- 5.2.5. Indonesia
- 5.2.6. Thailand
- 5.2.7. Malaysia
- 5.2.8. Singapore
- 5.2.9. Philippines
- 5.2.10. Vietnam
- 5.3. Market Analysis, Insights and Forecast - by Region
- 5.3.1. China
- 5.3.2. India
- 5.3.3. Japan
- 5.3.4. South Korea
- 5.3.5. Indonesia
- 5.3.6. Thailand
- 5.3.7. Malaysia
- 5.3.8. Singapore
- 5.3.9. Philippines
- 5.3.10. Vietnam
- 5.1. Market Analysis, Insights and Forecast - by End User Industry
- 6. China Asia-Pacific Silica Sand Market Analysis, Insights and Forecast, 2019-2031
- 6.1. Market Analysis, Insights and Forecast - by End User Industry
- 6.1.1. Glass Manufacturing
- 6.1.2. Foundry
- 6.1.3. Chemical Production
- 6.1.4. Construction
- 6.1.5. Paints and Coatings
- 6.1.6. Ceramics and Refractories
- 6.1.7. Filtration
- 6.1.8. Oil and Gas Recovery
- 6.1.9. Other End User Industries
- 6.2. Market Analysis, Insights and Forecast - by Geography
- 6.2.1. China
- 6.2.2. India
- 6.2.3. Japan
- 6.2.4. South Korea
- 6.2.5. Indonesia
- 6.2.6. Thailand
- 6.2.7. Malaysia
- 6.2.8. Singapore
- 6.2.9. Philippines
- 6.2.10. Vietnam
- 6.1. Market Analysis, Insights and Forecast - by End User Industry
- 7. India Asia-Pacific Silica Sand Market Analysis, Insights and Forecast, 2019-2031
- 7.1. Market Analysis, Insights and Forecast - by End User Industry
- 7.1.1. Glass Manufacturing
- 7.1.2. Foundry
- 7.1.3. Chemical Production
- 7.1.4. Construction
- 7.1.5. Paints and Coatings
- 7.1.6. Ceramics and Refractories
- 7.1.7. Filtration
- 7.1.8. Oil and Gas Recovery
- 7.1.9. Other End User Industries
- 7.2. Market Analysis, Insights and Forecast - by Geography
- 7.2.1. China
- 7.2.2. India
- 7.2.3. Japan
- 7.2.4. South Korea
- 7.2.5. Indonesia
- 7.2.6. Thailand
- 7.2.7. Malaysia
- 7.2.8. Singapore
- 7.2.9. Philippines
- 7.2.10. Vietnam
- 7.1. Market Analysis, Insights and Forecast - by End User Industry
- 8. Japan Asia-Pacific Silica Sand Market Analysis, Insights and Forecast, 2019-2031
- 8.1. Market Analysis, Insights and Forecast - by End User Industry
- 8.1.1. Glass Manufacturing
- 8.1.2. Foundry
- 8.1.3. Chemical Production
- 8.1.4. Construction
- 8.1.5. Paints and Coatings
- 8.1.6. Ceramics and Refractories
- 8.1.7. Filtration
- 8.1.8. Oil and Gas Recovery
- 8.1.9. Other End User Industries
- 8.2. Market Analysis, Insights and Forecast - by Geography
- 8.2.1. China
- 8.2.2. India
- 8.2.3. Japan
- 8.2.4. South Korea
- 8.2.5. Indonesia
- 8.2.6. Thailand
- 8.2.7. Malaysia
- 8.2.8. Singapore
- 8.2.9. Philippines
- 8.2.10. Vietnam
- 8.1. Market Analysis, Insights and Forecast - by End User Industry
- 9. South Korea Asia-Pacific Silica Sand Market Analysis, Insights and Forecast, 2019-2031
- 9.1. Market Analysis, Insights and Forecast - by End User Industry
- 9.1.1. Glass Manufacturing
- 9.1.2. Foundry
- 9.1.3. Chemical Production
- 9.1.4. Construction
- 9.1.5. Paints and Coatings
- 9.1.6. Ceramics and Refractories
- 9.1.7. Filtration
- 9.1.8. Oil and Gas Recovery
- 9.1.9. Other End User Industries
- 9.2. Market Analysis, Insights and Forecast - by Geography
- 9.2.1. China
- 9.2.2. India
- 9.2.3. Japan
- 9.2.4. South Korea
- 9.2.5. Indonesia
- 9.2.6. Thailand
- 9.2.7. Malaysia
- 9.2.8. Singapore
- 9.2.9. Philippines
- 9.2.10. Vietnam
- 9.1. Market Analysis, Insights and Forecast - by End User Industry
- 10. Indonesia Asia-Pacific Silica Sand Market Analysis, Insights and Forecast, 2019-2031
- 10.1. Market Analysis, Insights and Forecast - by End User Industry
- 10.1.1. Glass Manufacturing
- 10.1.2. Foundry
- 10.1.3. Chemical Production
- 10.1.4. Construction
- 10.1.5. Paints and Coatings
- 10.1.6. Ceramics and Refractories
- 10.1.7. Filtration
- 10.1.8. Oil and Gas Recovery
- 10.1.9. Other End User Industries
- 10.2. Market Analysis, Insights and Forecast - by Geography
- 10.2.1. China
- 10.2.2. India
- 10.2.3. Japan
- 10.2.4. South Korea
- 10.2.5. Indonesia
- 10.2.6. Thailand
- 10.2.7. Malaysia
- 10.2.8. Singapore
- 10.2.9. Philippines
- 10.2.10. Vietnam
- 10.1. Market Analysis, Insights and Forecast - by End User Industry
- 11. Thailand Asia-Pacific Silica Sand Market Analysis, Insights and Forecast, 2019-2031
- 11.1. Market Analysis, Insights and Forecast - by End User Industry
- 11.1.1. Glass Manufacturing
- 11.1.2. Foundry
- 11.1.3. Chemical Production
- 11.1.4. Construction
- 11.1.5. Paints and Coatings
- 11.1.6. Ceramics and Refractories
- 11.1.7. Filtration
- 11.1.8. Oil and Gas Recovery
- 11.1.9. Other End User Industries
- 11.2. Market Analysis, Insights and Forecast - by Geography
- 11.2.1. China
- 11.2.2. India
- 11.2.3. Japan
- 11.2.4. South Korea
- 11.2.5. Indonesia
- 11.2.6. Thailand
- 11.2.7. Malaysia
- 11.2.8. Singapore
- 11.2.9. Philippines
- 11.2.10. Vietnam
- 11.1. Market Analysis, Insights and Forecast - by End User Industry
- 12. Malaysia Asia-Pacific Silica Sand Market Analysis, Insights and Forecast, 2019-2031
- 12.1. Market Analysis, Insights and Forecast - by End User Industry
- 12.1.1. Glass Manufacturing
- 12.1.2. Foundry
- 12.1.3. Chemical Production
- 12.1.4. Construction
- 12.1.5. Paints and Coatings
- 12.1.6. Ceramics and Refractories
- 12.1.7. Filtration
- 12.1.8. Oil and Gas Recovery
- 12.1.9. Other End User Industries
- 12.2. Market Analysis, Insights and Forecast - by Geography
- 12.2.1. China
- 12.2.2. India
- 12.2.3. Japan
- 12.2.4. South Korea
- 12.2.5. Indonesia
- 12.2.6. Thailand
- 12.2.7. Malaysia
- 12.2.8. Singapore
- 12.2.9. Philippines
- 12.2.10. Vietnam
- 12.1. Market Analysis, Insights and Forecast - by End User Industry
- 13. Singapore Asia-Pacific Silica Sand Market Analysis, Insights and Forecast, 2019-2031
- 13.1. Market Analysis, Insights and Forecast - by End User Industry
- 13.1.1. Glass Manufacturing
- 13.1.2. Foundry
- 13.1.3. Chemical Production
- 13.1.4. Construction
- 13.1.5. Paints and Coatings
- 13.1.6. Ceramics and Refractories
- 13.1.7. Filtration
- 13.1.8. Oil and Gas Recovery
- 13.1.9. Other End User Industries
- 13.2. Market Analysis, Insights and Forecast - by Geography
- 13.2.1. China
- 13.2.2. India
- 13.2.3. Japan
- 13.2.4. South Korea
- 13.2.5. Indonesia
- 13.2.6. Thailand
- 13.2.7. Malaysia
- 13.2.8. Singapore
- 13.2.9. Philippines
- 13.2.10. Vietnam
- 13.1. Market Analysis, Insights and Forecast - by End User Industry
- 14. Philippines Asia-Pacific Silica Sand Market Analysis, Insights and Forecast, 2019-2031
- 14.1. Market Analysis, Insights and Forecast - by End User Industry
- 14.1.1. Glass Manufacturing
- 14.1.2. Foundry
- 14.1.3. Chemical Production
- 14.1.4. Construction
- 14.1.5. Paints and Coatings
- 14.1.6. Ceramics and Refractories
- 14.1.7. Filtration
- 14.1.8. Oil and Gas Recovery
- 14.1.9. Other End User Industries
- 14.2. Market Analysis, Insights and Forecast - by Geography
- 14.2.1. China
- 14.2.2. India
- 14.2.3. Japan
- 14.2.4. South Korea
- 14.2.5. Indonesia
- 14.2.6. Thailand
- 14.2.7. Malaysia
- 14.2.8. Singapore
- 14.2.9. Philippines
- 14.2.10. Vietnam
- 14.1. Market Analysis, Insights and Forecast - by End User Industry
- 15. Vietnam Asia-Pacific Silica Sand Market Analysis, Insights and Forecast, 2019-2031
- 15.1. Market Analysis, Insights and Forecast - by End User Industry
- 15.1.1. Glass Manufacturing
- 15.1.2. Foundry
- 15.1.3. Chemical Production
- 15.1.4. Construction
- 15.1.5. Paints and Coatings
- 15.1.6. Ceramics and Refractories
- 15.1.7. Filtration
- 15.1.8. Oil and Gas Recovery
- 15.1.9. Other End User Industries
- 15.2. Market Analysis, Insights and Forecast - by Geography
- 15.2.1. China
- 15.2.2. India
- 15.2.3. Japan
- 15.2.4. South Korea
- 15.2.5. Indonesia
- 15.2.6. Thailand
- 15.2.7. Malaysia
- 15.2.8. Singapore
- 15.2.9. Philippines
- 15.2.10. Vietnam
- 15.1. Market Analysis, Insights and Forecast - by End User Industry
- 16. Competitive Analysis
- 16.1. Global Market Share Analysis 2024
- 16.2. Company Profiles
- 16.2.1 Chongqing Changjiang River Moulding Material (Group) Co Ltd
- 16.2.1.1. Overview
- 16.2.1.2. Products
- 16.2.1.3. SWOT Analysis
- 16.2.1.4. Recent Developments
- 16.2.1.5. Financials (Based on Availability)
- 16.2.2 Fairmount Santrol
- 16.2.2.1. Overview
- 16.2.2.2. Products
- 16.2.2.3. SWOT Analysis
- 16.2.2.4. Recent Developments
- 16.2.2.5. Financials (Based on Availability)
- 16.2.3 Mitsubishi Corporation
- 16.2.3.1. Overview
- 16.2.3.2. Products
- 16.2.3.3. SWOT Analysis
- 16.2.3.4. Recent Developments
- 16.2.3.5. Financials (Based on Availability)
- 16.2.4 Mangal Minerals
- 16.2.4.1. Overview
- 16.2.4.2. Products
- 16.2.4.3. SWOT Analysis
- 16.2.4.4. Recent Developments
- 16.2.4.5. Financials (Based on Availability)
- 16.2.5 PUM GROUP
- 16.2.5.1. Overview
- 16.2.5.2. Products
- 16.2.5.3. SWOT Analysis
- 16.2.5.4. Recent Developments
- 16.2.5.5. Financials (Based on Availability)
- 16.2.6 JFE MINERAL Co LTD
- 16.2.6.1. Overview
- 16.2.6.2. Products
- 16.2.6.3. SWOT Analysis
- 16.2.6.4. Recent Developments
- 16.2.6.5. Financials (Based on Availability)
- 16.2.7 Raghav Productivity Enhancers Limited
- 16.2.7.1. Overview
- 16.2.7.2. Products
- 16.2.7.3. SWOT Analysis
- 16.2.7.4. Recent Developments
- 16.2.7.5. Financials (Based on Availability)
- 16.2.8 Sibelco
- 16.2.8.1. Overview
- 16.2.8.2. Products
- 16.2.8.3. SWOT Analysis
- 16.2.8.4. Recent Developments
- 16.2.8.5. Financials (Based on Availability)
- 16.2.9 Shivam Chemicals
- 16.2.9.1. Overview
- 16.2.9.2. Products
- 16.2.9.3. SWOT Analysis
- 16.2.9.4. Recent Developments
- 16.2.9.5. Financials (Based on Availability)
- 16.2.10 TOCHU CORPORATION
- 16.2.10.1. Overview
- 16.2.10.2. Products
- 16.2.10.3. SWOT Analysis
- 16.2.10.4. Recent Developments
- 16.2.10.5. Financials (Based on Availability)
- 16.2.11 Xinyi Golden Ruite Quartz Materials Co Ltd *List Not Exhaustive
- 16.2.11.1. Overview
- 16.2.11.2. Products
- 16.2.11.3. SWOT Analysis
- 16.2.11.4. Recent Developments
- 16.2.11.5. Financials (Based on Availability)
- 16.2.1 Chongqing Changjiang River Moulding Material (Group) Co Ltd
List of Figures
- Figure 1: Global Asia-Pacific Silica Sand Market Revenue Breakdown (Million, %) by Region 2024 & 2032
- Figure 2: China Asia-Pacific Silica Sand Market Revenue (Million), by End User Industry 2024 & 2032
- Figure 3: China Asia-Pacific Silica Sand Market Revenue Share (%), by End User Industry 2024 & 2032
- Figure 4: China Asia-Pacific Silica Sand Market Revenue (Million), by Geography 2024 & 2032
- Figure 5: China Asia-Pacific Silica Sand Market Revenue Share (%), by Geography 2024 & 2032
- Figure 6: China Asia-Pacific Silica Sand Market Revenue (Million), by Country 2024 & 2032
- Figure 7: China Asia-Pacific Silica Sand Market Revenue Share (%), by Country 2024 & 2032
- Figure 8: India Asia-Pacific Silica Sand Market Revenue (Million), by End User Industry 2024 & 2032
- Figure 9: India Asia-Pacific Silica Sand Market Revenue Share (%), by End User Industry 2024 & 2032
- Figure 10: India Asia-Pacific Silica Sand Market Revenue (Million), by Geography 2024 & 2032
- Figure 11: India Asia-Pacific Silica Sand Market Revenue Share (%), by Geography 2024 & 2032
- Figure 12: India Asia-Pacific Silica Sand Market Revenue (Million), by Country 2024 & 2032
- Figure 13: India Asia-Pacific Silica Sand Market Revenue Share (%), by Country 2024 & 2032
- Figure 14: Japan Asia-Pacific Silica Sand Market Revenue (Million), by End User Industry 2024 & 2032
- Figure 15: Japan Asia-Pacific Silica Sand Market Revenue Share (%), by End User Industry 2024 & 2032
- Figure 16: Japan Asia-Pacific Silica Sand Market Revenue (Million), by Geography 2024 & 2032
- Figure 17: Japan Asia-Pacific Silica Sand Market Revenue Share (%), by Geography 2024 & 2032
- Figure 18: Japan Asia-Pacific Silica Sand Market Revenue (Million), by Country 2024 & 2032
- Figure 19: Japan Asia-Pacific Silica Sand Market Revenue Share (%), by Country 2024 & 2032
- Figure 20: South Korea Asia-Pacific Silica Sand Market Revenue (Million), by End User Industry 2024 & 2032
- Figure 21: South Korea Asia-Pacific Silica Sand Market Revenue Share (%), by End User Industry 2024 & 2032
- Figure 22: South Korea Asia-Pacific Silica Sand Market Revenue (Million), by Geography 2024 & 2032
- Figure 23: South Korea Asia-Pacific Silica Sand Market Revenue Share (%), by Geography 2024 & 2032
- Figure 24: South Korea Asia-Pacific Silica Sand Market Revenue (Million), by Country 2024 & 2032
- Figure 25: South Korea Asia-Pacific Silica Sand Market Revenue Share (%), by Country 2024 & 2032
- Figure 26: Indonesia Asia-Pacific Silica Sand Market Revenue (Million), by End User Industry 2024 & 2032
- Figure 27: Indonesia Asia-Pacific Silica Sand Market Revenue Share (%), by End User Industry 2024 & 2032
- Figure 28: Indonesia Asia-Pacific Silica Sand Market Revenue (Million), by Geography 2024 & 2032
- Figure 29: Indonesia Asia-Pacific Silica Sand Market Revenue Share (%), by Geography 2024 & 2032
- Figure 30: Indonesia Asia-Pacific Silica Sand Market Revenue (Million), by Country 2024 & 2032
- Figure 31: Indonesia Asia-Pacific Silica Sand Market Revenue Share (%), by Country 2024 & 2032
- Figure 32: Thailand Asia-Pacific Silica Sand Market Revenue (Million), by End User Industry 2024 & 2032
- Figure 33: Thailand Asia-Pacific Silica Sand Market Revenue Share (%), by End User Industry 2024 & 2032
- Figure 34: Thailand Asia-Pacific Silica Sand Market Revenue (Million), by Geography 2024 & 2032
- Figure 35: Thailand Asia-Pacific Silica Sand Market Revenue Share (%), by Geography 2024 & 2032
- Figure 36: Thailand Asia-Pacific Silica Sand Market Revenue (Million), by Country 2024 & 2032
- Figure 37: Thailand Asia-Pacific Silica Sand Market Revenue Share (%), by Country 2024 & 2032
- Figure 38: Malaysia Asia-Pacific Silica Sand Market Revenue (Million), by End User Industry 2024 & 2032
- Figure 39: Malaysia Asia-Pacific Silica Sand Market Revenue Share (%), by End User Industry 2024 & 2032
- Figure 40: Malaysia Asia-Pacific Silica Sand Market Revenue (Million), by Geography 2024 & 2032
- Figure 41: Malaysia Asia-Pacific Silica Sand Market Revenue Share (%), by Geography 2024 & 2032
- Figure 42: Malaysia Asia-Pacific Silica Sand Market Revenue (Million), by Country 2024 & 2032
- Figure 43: Malaysia Asia-Pacific Silica Sand Market Revenue Share (%), by Country 2024 & 2032
- Figure 44: Singapore Asia-Pacific Silica Sand Market Revenue (Million), by End User Industry 2024 & 2032
- Figure 45: Singapore Asia-Pacific Silica Sand Market Revenue Share (%), by End User Industry 2024 & 2032
- Figure 46: Singapore Asia-Pacific Silica Sand Market Revenue (Million), by Geography 2024 & 2032
- Figure 47: Singapore Asia-Pacific Silica Sand Market Revenue Share (%), by Geography 2024 & 2032
- Figure 48: Singapore Asia-Pacific Silica Sand Market Revenue (Million), by Country 2024 & 2032
- Figure 49: Singapore Asia-Pacific Silica Sand Market Revenue Share (%), by Country 2024 & 2032
- Figure 50: Philippines Asia-Pacific Silica Sand Market Revenue (Million), by End User Industry 2024 & 2032
- Figure 51: Philippines Asia-Pacific Silica Sand Market Revenue Share (%), by End User Industry 2024 & 2032
- Figure 52: Philippines Asia-Pacific Silica Sand Market Revenue (Million), by Geography 2024 & 2032
- Figure 53: Philippines Asia-Pacific Silica Sand Market Revenue Share (%), by Geography 2024 & 2032
- Figure 54: Philippines Asia-Pacific Silica Sand Market Revenue (Million), by Country 2024 & 2032
- Figure 55: Philippines Asia-Pacific Silica Sand Market Revenue Share (%), by Country 2024 & 2032
- Figure 56: Vietnam Asia-Pacific Silica Sand Market Revenue (Million), by End User Industry 2024 & 2032
- Figure 57: Vietnam Asia-Pacific Silica Sand Market Revenue Share (%), by End User Industry 2024 & 2032
- Figure 58: Vietnam Asia-Pacific Silica Sand Market Revenue (Million), by Geography 2024 & 2032
- Figure 59: Vietnam Asia-Pacific Silica Sand Market Revenue Share (%), by Geography 2024 & 2032
- Figure 60: Vietnam Asia-Pacific Silica Sand Market Revenue (Million), by Country 2024 & 2032
- Figure 61: Vietnam Asia-Pacific Silica Sand Market Revenue Share (%), by Country 2024 & 2032
List of Tables
- Table 1: Global Asia-Pacific Silica Sand Market Revenue Million Forecast, by Region 2019 & 2032
- Table 2: Global Asia-Pacific Silica Sand Market Revenue Million Forecast, by End User Industry 2019 & 2032
- Table 3: Global Asia-Pacific Silica Sand Market Revenue Million Forecast, by Geography 2019 & 2032
- Table 4: Global Asia-Pacific Silica Sand Market Revenue Million Forecast, by Region 2019 & 2032
- Table 5: Global Asia-Pacific Silica Sand Market Revenue Million Forecast, by End User Industry 2019 & 2032
- Table 6: Global Asia-Pacific Silica Sand Market Revenue Million Forecast, by Geography 2019 & 2032
- Table 7: Global Asia-Pacific Silica Sand Market Revenue Million Forecast, by Country 2019 & 2032
- Table 8: Global Asia-Pacific Silica Sand Market Revenue Million Forecast, by End User Industry 2019 & 2032
- Table 9: Global Asia-Pacific Silica Sand Market Revenue Million Forecast, by Geography 2019 & 2032
- Table 10: Global Asia-Pacific Silica Sand Market Revenue Million Forecast, by Country 2019 & 2032
- Table 11: Global Asia-Pacific Silica Sand Market Revenue Million Forecast, by End User Industry 2019 & 2032
- Table 12: Global Asia-Pacific Silica Sand Market Revenue Million Forecast, by Geography 2019 & 2032
- Table 13: Global Asia-Pacific Silica Sand Market Revenue Million Forecast, by Country 2019 & 2032
- Table 14: Global Asia-Pacific Silica Sand Market Revenue Million Forecast, by End User Industry 2019 & 2032
- Table 15: Global Asia-Pacific Silica Sand Market Revenue Million Forecast, by Geography 2019 & 2032
- Table 16: Global Asia-Pacific Silica Sand Market Revenue Million Forecast, by Country 2019 & 2032
- Table 17: Global Asia-Pacific Silica Sand Market Revenue Million Forecast, by End User Industry 2019 & 2032
- Table 18: Global Asia-Pacific Silica Sand Market Revenue Million Forecast, by Geography 2019 & 2032
- Table 19: Global Asia-Pacific Silica Sand Market Revenue Million Forecast, by Country 2019 & 2032
- Table 20: Global Asia-Pacific Silica Sand Market Revenue Million Forecast, by End User Industry 2019 & 2032
- Table 21: Global Asia-Pacific Silica Sand Market Revenue Million Forecast, by Geography 2019 & 2032
- Table 22: Global Asia-Pacific Silica Sand Market Revenue Million Forecast, by Country 2019 & 2032
- Table 23: Global Asia-Pacific Silica Sand Market Revenue Million Forecast, by End User Industry 2019 & 2032
- Table 24: Global Asia-Pacific Silica Sand Market Revenue Million Forecast, by Geography 2019 & 2032
- Table 25: Global Asia-Pacific Silica Sand Market Revenue Million Forecast, by Country 2019 & 2032
- Table 26: Global Asia-Pacific Silica Sand Market Revenue Million Forecast, by End User Industry 2019 & 2032
- Table 27: Global Asia-Pacific Silica Sand Market Revenue Million Forecast, by Geography 2019 & 2032
- Table 28: Global Asia-Pacific Silica Sand Market Revenue Million Forecast, by Country 2019 & 2032
- Table 29: Global Asia-Pacific Silica Sand Market Revenue Million Forecast, by End User Industry 2019 & 2032
- Table 30: Global Asia-Pacific Silica Sand Market Revenue Million Forecast, by Geography 2019 & 2032
- Table 31: Global Asia-Pacific Silica Sand Market Revenue Million Forecast, by Country 2019 & 2032
- Table 32: Global Asia-Pacific Silica Sand Market Revenue Million Forecast, by End User Industry 2019 & 2032
- Table 33: Global Asia-Pacific Silica Sand Market Revenue Million Forecast, by Geography 2019 & 2032
- Table 34: Global Asia-Pacific Silica Sand Market Revenue Million Forecast, by Country 2019 & 2032
Frequently Asked Questions
1. What is the projected Compound Annual Growth Rate (CAGR) of the Asia-Pacific Silica Sand Market?
The projected CAGR is approximately 5.12%.
2. Which companies are prominent players in the Asia-Pacific Silica Sand Market?
Key companies in the market include Chongqing Changjiang River Moulding Material (Group) Co Ltd, Fairmount Santrol, Mitsubishi Corporation, Mangal Minerals, PUM GROUP, JFE MINERAL Co LTD, Raghav Productivity Enhancers Limited, Sibelco, Shivam Chemicals, TOCHU CORPORATION, Xinyi Golden Ruite Quartz Materials Co Ltd *List Not Exhaustive.
3. What are the main segments of the Asia-Pacific Silica Sand Market?
The market segments include End User Industry, Geography.
4. Can you provide details about the market size?
The market size is estimated to be USD XX Million as of 2022.
5. What are some drivers contributing to market growth?
Consistent Economic Growth Leading to Increase in Construction; Increasing Use in the Foundry Industry; Others Drivers.
6. What are the notable trends driving market growth?
Increasing Demand from the Glass Industry.
7. Are there any restraints impacting market growth?
Consistent Economic Growth Leading to Increase in Construction; Increasing Use in the Foundry Industry; Others Drivers.
8. Can you provide examples of recent developments in the market?
The recent developments pertaining to the major players in the market are covered in the complete study.
9. What pricing options are available for accessing the report?
Pricing options include single-user, multi-user, and enterprise licenses priced at USD 4750, USD 5250, and USD 8750 respectively.
10. Is the market size provided in terms of value or volume?
The market size is provided in terms of value, measured in Million.
11. Are there any specific market keywords associated with the report?
Yes, the market keyword associated with the report is "Asia-Pacific Silica Sand Market," which aids in identifying and referencing the specific market segment covered.
12. How do I determine which pricing option suits my needs best?
The pricing options vary based on user requirements and access needs. Individual users may opt for single-user licenses, while businesses requiring broader access may choose multi-user or enterprise licenses for cost-effective access to the report.
13. Are there any additional resources or data provided in the Asia-Pacific Silica Sand Market report?
While the report offers comprehensive insights, it's advisable to review the specific contents or supplementary materials provided to ascertain if additional resources or data are available.
14. How can I stay updated on further developments or reports in the Asia-Pacific Silica Sand Market?
To stay informed about further developments, trends, and reports in the Asia-Pacific Silica Sand Market, consider subscribing to industry newsletters, following relevant companies and organizations, or regularly checking reputable industry news sources and publications.
Methodology
Step 1 - Identification of Relevant Samples Size from Population Database


Step 2 - Approaches for Defining Global Market Size (Value, Volume* & Price*)

Note*: In applicable scenarios
Step 3 - Data Sources
Primary Research
- Web Analytics
- Survey Reports
- Research Institute
- Latest Research Reports
- Opinion Leaders
Secondary Research
- Annual Reports
- White Paper
- Latest Press Release
- Industry Association
- Paid Database
- Investor Presentations

Step 4 - Data Triangulation
Involves using different sources of information in order to increase the validity of a study
These sources are likely to be stakeholders in a program - participants, other researchers, program staff, other community members, and so on.
Then we put all data in single framework & apply various statistical tools to find out the dynamic on the market.
During the analysis stage, feedback from the stakeholder groups would be compared to determine areas of agreement as well as areas of divergence
