

Key Insights
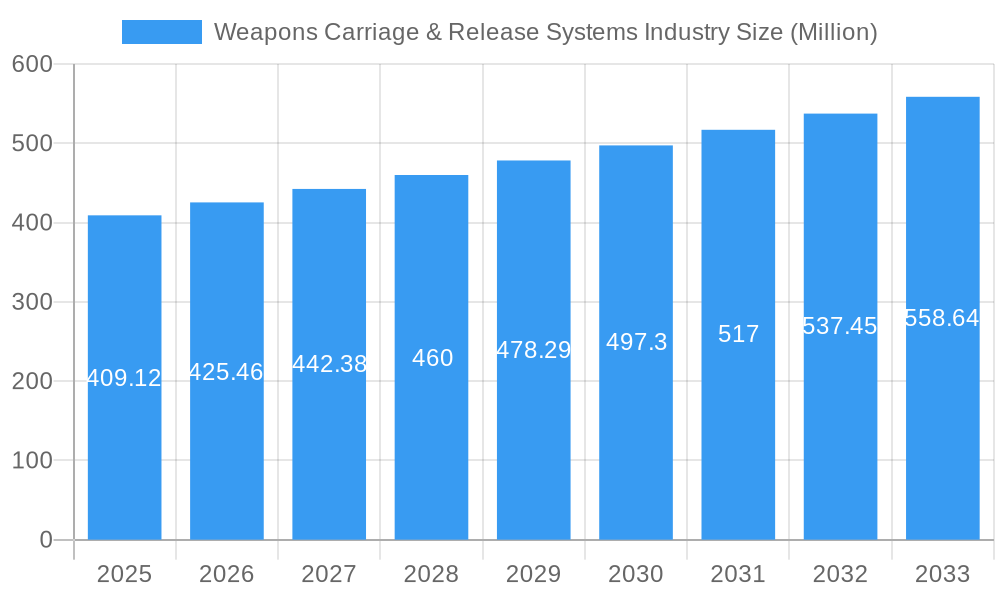
The global Weapons Carriage & Release Systems (WCRS) market, valued at $409.12 million in 2025, is projected to experience steady growth, driven primarily by increasing military spending globally and modernization efforts across various air forces. Technological advancements in precision-guided munitions and the integration of advanced sensors and targeting systems are key drivers, enhancing the effectiveness and demand for sophisticated WCRS. The market is segmented by platform (aircraft, helicopters, unmanned aerial vehicles – UAVs) and weapon type (missiles, bombs), with aircraft currently dominating the market share due to their widespread deployment and diverse mission profiles. Growth in the UAV segment is expected to accelerate significantly over the forecast period, driven by the increasing adoption of UAVs for surveillance, reconnaissance, and strike missions. While geopolitical instability and defense budget fluctuations pose potential restraints, the long-term outlook remains positive, fuelled by continuous research and development efforts in lighter, more adaptable, and intelligent WCRS.
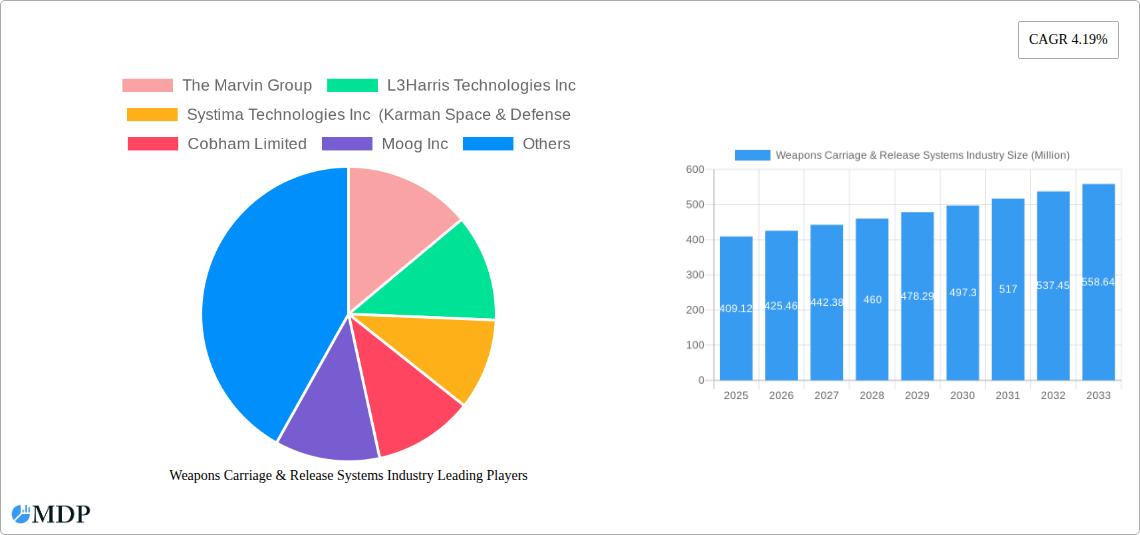
Weapons Carriage & Release Systems Industry Market Size (In Million)
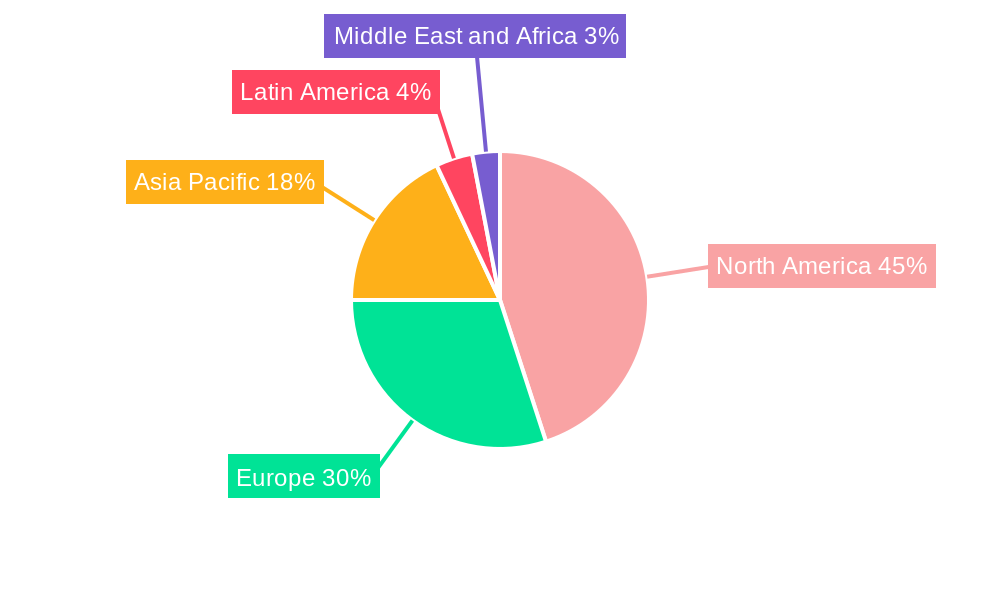
The competitive landscape is characterized by a mix of established players like L3Harris Technologies, RTX Corporation, and Moog Inc., alongside specialized companies like The Marvin Group and Systima Technologies. These companies are actively engaged in strategic partnerships, mergers and acquisitions, and product innovation to consolidate their market position and cater to the evolving needs of armed forces worldwide. The North American market currently holds a significant share, attributable to its robust defense industry and advanced technological capabilities. However, growth in Asia-Pacific is anticipated to be significant, primarily driven by modernization programs in countries like India and China. The continued development and adoption of advanced materials, and increased focus on reducing the weight and drag of weapon systems will drive the growth of the market within the next decade. The forecast period (2025-2033) is likely to witness a sustained expansion of the WCRS market, fueled by technological advancements and the persistent demand for enhanced weapon delivery capabilities.
Weapons Carriage & Release Systems Industry Company Market Share
Weapons Carriage & Release Systems Industry: A Comprehensive Market Report (2019-2033)
This in-depth report provides a comprehensive analysis of the Weapons Carriage & Release Systems industry, offering invaluable insights for stakeholders, investors, and industry professionals. We project a market valued at $XX Million in 2025, with a Compound Annual Growth Rate (CAGR) of XX% from 2025 to 2033, reaching $XX Million by 2033. The study covers the historical period (2019-2024), the base year (2025), and forecasts up to 2033.
Weapons Carriage & Release Systems Industry Market Dynamics & Concentration
The Weapons Carriage & Release Systems market is characterized by a moderately concentrated landscape, with key players like The Marvin Group, L3Harris Technologies Inc, Systima Technologies Inc (Karman Space & Defense), Cobham Limited, Moog Inc, RTX Corporation, Alkan, and Marotta Controls Inc vying for market share. Market concentration is further influenced by continuous technological advancements, stringent regulatory frameworks, and the emergence of innovative product substitutes. The industry is witnessing a surge in mergers and acquisitions (M&A) activities, with an estimated XX M&A deals closed in the past five years, driving consolidation and shaping market dynamics. End-user trends, primarily driven by increasing defense budgets and modernization initiatives across global armed forces, are significantly influencing market growth. The top three players collectively hold approximately XX% of the market share in 2025, reflecting the competitive intensity within this sector.
- Market Share: Top 3 players - XX%; Top 5 players - XX%
- M&A Activity: XX deals closed (2020-2024)
- Key Innovation Drivers: Advanced materials, AI integration, miniaturization.
- Regulatory Impact: Stringent export controls and safety regulations.
- Product Substitutes: Emerging technologies with similar functionalities (XX% market penetration in 2024).
Weapons Carriage & Release Systems Industry Industry Trends & Analysis
The Weapons Carriage & Release Systems market is experiencing robust growth, fueled by several key factors. Increased geopolitical instability and defense modernization programs across several nations are driving significant demand for sophisticated weapon carriage and release systems. Technological advancements, such as the integration of advanced sensors, AI-powered targeting systems, and improved guidance systems, are enhancing the capabilities and accuracy of these systems, further boosting market growth. Consumer preferences are shifting towards lightweight, versatile, and highly reliable systems, prompting manufacturers to invest heavily in R&D to meet these evolving demands. The competitive landscape is highly dynamic, characterized by both intense competition among established players and the emergence of new entrants with innovative technologies. The market is also witnessing a significant shift towards unmanned aerial vehicle (UAV) platforms and precision-guided munitions, driving the need for compatible weapon carriage and release systems. This trend is expected to continue during the forecast period. The CAGR for the period is projected at XX%, significantly higher than the average growth rate of other related defense technologies. Market penetration of precision-guided munitions integration with existing and new carriage systems is projected to reach XX% by 2033.
Leading Markets & Segments in Weapons Carriage & Release Systems Industry
The Aircraft segment currently dominates the Weapons Carriage & Release Systems market, accounting for approximately XX% of the total market value in 2025. This dominance is primarily driven by the large-scale deployment of fighter jets and other aircraft by global militaries. The North American region (specifically the US) remains the leading market, due to its robust defense budget, advanced technological capabilities, and consistent investment in military modernization.
- Aircraft Segment Drivers:
- High demand for advanced fighter jets and bombers.
- Ongoing modernization programs in major air forces.
- Continuous technological advancements in aircraft design.
- Helicopters Segment: Steady Growth driven by increasing use in special operations and combat search and rescue missions.
- UAV Segment: Rapid Expansion fueled by the rising adoption of UAVs for reconnaissance, surveillance, and targeted attacks.
- Missiles Segment: Dominates the weapon type segment due to higher sophistication and diverse application.
- Bombs Segment: Significant Market Share, driven by continued demand for air-to-ground capabilities.
- Geographic Dominance: North America (US) remains the largest market, driven by high defense spending and technological leadership. Europe and Asia-Pacific regions showcase strong growth potential.
Weapons Carriage & Release Systems Industry Product Developments
Recent product innovations focus on improving the precision, range, and reliability of weapon delivery systems. This includes the integration of advanced sensors, GPS guidance, and AI-powered targeting algorithms. Lightweight materials and modular designs are also being incorporated to enhance adaptability and reduce weight. These advancements are enabling the development of systems that are more effective, versatile, and easier to maintain. These systems are primarily designed to increase accuracy, reduce collateral damage, and improve overall combat effectiveness. The market is also seeing increasing integration of networked systems to optimize weapon delivery across multiple platforms.
Key Drivers of Weapons Carriage & Release Systems Industry Growth
Several factors are driving growth in the Weapons Carriage & Release Systems industry:
- Technological advancements: Improved sensor technologies, AI-powered targeting, and advanced materials are increasing the effectiveness and versatility of weapon systems.
- Increasing defense budgets: Growing geopolitical tensions and modernization efforts are leading to increased investments in defense technologies.
- Demand for precision-guided munitions: The preference for minimizing civilian casualties drives demand for accurate weapons delivery systems.
- Growing adoption of UAVs: The use of UAVs in military operations is increasing the demand for compatible carriage and release systems.
Challenges in the Weapons Carriage & Release Systems Industry Market
The industry faces several challenges:
- Stringent regulations: Export controls and safety regulations increase the complexity and cost of product development and deployment.
- Supply chain disruptions: Global supply chain issues can impact the availability of critical components and materials.
- Intense competition: The market is characterized by intense competition among established players and new entrants. This leads to pricing pressures and necessitates continuous innovation.
- High development costs: The development and testing of advanced weapon systems require significant investments.
Emerging Opportunities in Weapons Carriage & Release Systems Industry
Several emerging trends offer significant opportunities for growth:
- Technological breakthroughs: Innovations in AI, advanced materials, and sensor technologies are creating new possibilities for improved weapon delivery systems.
- Strategic partnerships: Collaboration between defense contractors and technology companies can lead to the development of more advanced and efficient systems.
- Market expansion: Expanding into new markets in emerging economies presents significant growth potential.
Leading Players in the Weapons Carriage & Release Systems Industry Sector
- The Marvin Group
- L3Harris Technologies Inc
- Systima Technologies Inc (Karman Space & Defense)
- Cobham Limited
- Moog Inc
- RTX Corporation
- Alkan
- Marotta Controls Inc
Key Milestones in Weapons Carriage & Release Systems Industry Industry
- 2020: Introduction of a new lightweight weapon carriage system by Moog Inc.
- 2021: L3Harris Technologies Inc. and RTX Corporation announce a strategic partnership to develop next-generation weapon integration technology.
- 2022: Successful testing of AI-powered targeting system for UAVs by Systima Technologies Inc.
- 2023: The Marvin Group launches a new family of precision-guided bomb carriage systems.
- 2024: Several significant M&A deals reshape the competitive landscape.
Strategic Outlook for Weapons Carriage & Release Systems Industry Market
The Weapons Carriage & Release Systems market is poised for continued growth driven by technological advancements, increasing defense spending, and the expanding adoption of UAVs. Strategic partnerships and investment in R&D will be crucial for companies to maintain a competitive edge. The focus on developing more accurate, versatile, and reliable systems will remain a key driver of innovation in the years to come. The market is expected to see continued consolidation through M&A activities, with larger players seeking to enhance their market position and expand their product portfolios.
Weapons Carriage & Release Systems Industry Segmentation
-
1. Platform
- 1.1. Aircraft
- 1.2. Helicopters
- 1.3. Unmanned Aerial Vehicles
-
2. Weapon Type
- 2.1. Missiles
- 2.2. Bombs
- 3. Geography
-
4. North America
- 4.1. United States
- 4.2. Canada
-
5. Europe
- 5.1. United Kingdom
- 5.2. France
- 5.3. Germany
- 5.4. Russia
- 5.5. Rest of Europe
-
6. Asia-Pacific
- 6.1. China
- 6.2. India
- 6.3. Japan
- 6.4. South Korea
- 6.5. Rest of Asia-Pacific
-
7. Latin America
- 7.1. Brazil
- 7.2. Mexico
- 7.3. Rest of Latin America
-
8. Middle East and Africa
- 8.1. United Arab Emirates
- 8.2. Saudi Arabia
- 8.3. Turkey
- 8.4. South Africa
- 8.5. Rest of Middle East and Africa
Weapons Carriage & Release Systems Industry Segmentation By Geography
-
1. North America
- 1.1. United States
- 1.2. Canada
- 1.3. Mexico
-
2. South America
- 2.1. Brazil
- 2.2. Argentina
- 2.3. Rest of South America
-
3. Europe
- 3.1. United Kingdom
- 3.2. Germany
- 3.3. France
- 3.4. Italy
- 3.5. Spain
- 3.6. Russia
- 3.7. Benelux
- 3.8. Nordics
- 3.9. Rest of Europe
-
4. Middle East & Africa
- 4.1. Turkey
- 4.2. Israel
- 4.3. GCC
- 4.4. North Africa
- 4.5. South Africa
- 4.6. Rest of Middle East & Africa
-
5. Asia Pacific
- 5.1. China
- 5.2. India
- 5.3. Japan
- 5.4. South Korea
- 5.5. ASEAN
- 5.6. Oceania
- 5.7. Rest of Asia Pacific
Weapons Carriage & Release Systems Industry Regional Market Share
Geographic Coverage of Weapons Carriage & Release Systems Industry
Weapons Carriage & Release Systems Industry REPORT HIGHLIGHTS
| Aspects | Details |
|---|---|
| Study Period | 2020-2034 |
| Base Year | 2025 |
| Estimated Year | 2026 |
| Forecast Period | 2026-2034 |
| Historical Period | 2020-2025 |
| Growth Rate | CAGR of 4.19% from 2020-2034 |
| Segmentation |
|
Table of Contents
- 1. Introduction
- 1.1. Research Scope
- 1.2. Market Segmentation
- 1.3. Research Objective
- 1.4. Definitions and Assumptions
- 2. Executive Summary
- 2.1. Market Snapshot
- 3. Market Dynamics
- 3.1. Market Drivers
- 3.2. Market Restrains
- 3.3. Market Trends
- 3.4. Market Opportunities
- 4. Market Factor Analysis
- 4.1. Porters Five Forces
- 4.1.1. Bargaining Power of Suppliers
- 4.1.2. Bargaining Power of Buyers
- 4.1.3. Threat of New Entrants
- 4.1.4. Threat of Substitutes
- 4.1.5. Competitive Rivalry
- 4.2. PESTEL analysis
- 4.3. BCG Analysis
- 4.3.1. Stars (High Growth, High Market Share)
- 4.3.2. Cash Cows (Low Growth, High Market Share)
- 4.3.3. Question Mark (High Growth, Low Market Share)
- 4.3.4. Dogs (Low Growth, Low Market Share)
- 4.4. Ansoff Matrix Analysis
- 4.5. Supply Chain Analysis
- 4.6. Regulatory Landscape
- 4.7. Current Market Potential and Opportunity Assessment (TAM–SAM–SOM Framework)
- 4.8. MDP Analyst Note
- 4.1. Porters Five Forces
- 5. Market Analysis, Insights and Forecast 2021-2033
- 5.1. Market Analysis, Insights and Forecast - by Platform
- 5.1.1. Aircraft
- 5.1.2. Helicopters
- 5.1.3. Unmanned Aerial Vehicles
- 5.2. Market Analysis, Insights and Forecast - by Weapon Type
- 5.2.1. Missiles
- 5.2.2. Bombs
- 5.3. Market Analysis, Insights and Forecast - by Geography
- 5.4. Market Analysis, Insights and Forecast - by North America
- 5.4.1. United States
- 5.4.2. Canada
- 5.5. Market Analysis, Insights and Forecast - by Europe
- 5.5.1. United Kingdom
- 5.5.2. France
- 5.5.3. Germany
- 5.5.4. Russia
- 5.5.5. Rest of Europe
- 5.6. Market Analysis, Insights and Forecast - by Asia-Pacific
- 5.6.1. China
- 5.6.2. India
- 5.6.3. Japan
- 5.6.4. South Korea
- 5.6.5. Rest of Asia-Pacific
- 5.7. Market Analysis, Insights and Forecast - by Latin America
- 5.7.1. Brazil
- 5.7.2. Mexico
- 5.7.3. Rest of Latin America
- 5.8. Market Analysis, Insights and Forecast - by Middle East and Africa
- 5.8.1. United Arab Emirates
- 5.8.2. Saudi Arabia
- 5.8.3. Turkey
- 5.8.4. South Africa
- 5.8.5. Rest of Middle East and Africa
- 5.9. Market Analysis, Insights and Forecast - by Region
- 5.9.1. North America
- 5.9.2. South America
- 5.9.3. Europe
- 5.9.4. Middle East & Africa
- 5.9.5. Asia Pacific
- 5.1. Market Analysis, Insights and Forecast - by Platform
- 6. Global Weapons Carriage & Release Systems Industry Analysis, Insights and Forecast, 2021-2033
- 6.1. Market Analysis, Insights and Forecast - by Platform
- 6.1.1. Aircraft
- 6.1.2. Helicopters
- 6.1.3. Unmanned Aerial Vehicles
- 6.2. Market Analysis, Insights and Forecast - by Weapon Type
- 6.2.1. Missiles
- 6.2.2. Bombs
- 6.3. Market Analysis, Insights and Forecast - by Geography
- 6.4. Market Analysis, Insights and Forecast - by North America
- 6.4.1. United States
- 6.4.2. Canada
- 6.5. Market Analysis, Insights and Forecast - by Europe
- 6.5.1. United Kingdom
- 6.5.2. France
- 6.5.3. Germany
- 6.5.4. Russia
- 6.5.5. Rest of Europe
- 6.6. Market Analysis, Insights and Forecast - by Asia-Pacific
- 6.6.1. China
- 6.6.2. India
- 6.6.3. Japan
- 6.6.4. South Korea
- 6.6.5. Rest of Asia-Pacific
- 6.7. Market Analysis, Insights and Forecast - by Latin America
- 6.7.1. Brazil
- 6.7.2. Mexico
- 6.7.3. Rest of Latin America
- 6.8. Market Analysis, Insights and Forecast - by Middle East and Africa
- 6.8.1. United Arab Emirates
- 6.8.2. Saudi Arabia
- 6.8.3. Turkey
- 6.8.4. South Africa
- 6.8.5. Rest of Middle East and Africa
- 6.1. Market Analysis, Insights and Forecast - by Platform
- 7. North America Weapons Carriage & Release Systems Industry Analysis, Insights and Forecast, 2020-2032
- 7.1. Market Analysis, Insights and Forecast - by Platform
- 7.1.1. Aircraft
- 7.1.2. Helicopters
- 7.1.3. Unmanned Aerial Vehicles
- 7.2. Market Analysis, Insights and Forecast - by Weapon Type
- 7.2.1. Missiles
- 7.2.2. Bombs
- 7.3. Market Analysis, Insights and Forecast - by Geography
- 7.4. Market Analysis, Insights and Forecast - by North America
- 7.4.1. United States
- 7.4.2. Canada
- 7.5. Market Analysis, Insights and Forecast - by Europe
- 7.5.1. United Kingdom
- 7.5.2. France
- 7.5.3. Germany
- 7.5.4. Russia
- 7.5.5. Rest of Europe
- 7.6. Market Analysis, Insights and Forecast - by Asia-Pacific
- 7.6.1. China
- 7.6.2. India
- 7.6.3. Japan
- 7.6.4. South Korea
- 7.6.5. Rest of Asia-Pacific
- 7.7. Market Analysis, Insights and Forecast - by Latin America
- 7.7.1. Brazil
- 7.7.2. Mexico
- 7.7.3. Rest of Latin America
- 7.8. Market Analysis, Insights and Forecast - by Middle East and Africa
- 7.8.1. United Arab Emirates
- 7.8.2. Saudi Arabia
- 7.8.3. Turkey
- 7.8.4. South Africa
- 7.8.5. Rest of Middle East and Africa
- 7.1. Market Analysis, Insights and Forecast - by Platform
- 8. South America Weapons Carriage & Release Systems Industry Analysis, Insights and Forecast, 2020-2032
- 8.1. Market Analysis, Insights and Forecast - by Platform
- 8.1.1. Aircraft
- 8.1.2. Helicopters
- 8.1.3. Unmanned Aerial Vehicles
- 8.2. Market Analysis, Insights and Forecast - by Weapon Type
- 8.2.1. Missiles
- 8.2.2. Bombs
- 8.3. Market Analysis, Insights and Forecast - by Geography
- 8.4. Market Analysis, Insights and Forecast - by North America
- 8.4.1. United States
- 8.4.2. Canada
- 8.5. Market Analysis, Insights and Forecast - by Europe
- 8.5.1. United Kingdom
- 8.5.2. France
- 8.5.3. Germany
- 8.5.4. Russia
- 8.5.5. Rest of Europe
- 8.6. Market Analysis, Insights and Forecast - by Asia-Pacific
- 8.6.1. China
- 8.6.2. India
- 8.6.3. Japan
- 8.6.4. South Korea
- 8.6.5. Rest of Asia-Pacific
- 8.7. Market Analysis, Insights and Forecast - by Latin America
- 8.7.1. Brazil
- 8.7.2. Mexico
- 8.7.3. Rest of Latin America
- 8.8. Market Analysis, Insights and Forecast - by Middle East and Africa
- 8.8.1. United Arab Emirates
- 8.8.2. Saudi Arabia
- 8.8.3. Turkey
- 8.8.4. South Africa
- 8.8.5. Rest of Middle East and Africa
- 8.1. Market Analysis, Insights and Forecast - by Platform
- 9. Europe Weapons Carriage & Release Systems Industry Analysis, Insights and Forecast, 2020-2032
- 9.1. Market Analysis, Insights and Forecast - by Platform
- 9.1.1. Aircraft
- 9.1.2. Helicopters
- 9.1.3. Unmanned Aerial Vehicles
- 9.2. Market Analysis, Insights and Forecast - by Weapon Type
- 9.2.1. Missiles
- 9.2.2. Bombs
- 9.3. Market Analysis, Insights and Forecast - by Geography
- 9.4. Market Analysis, Insights and Forecast - by North America
- 9.4.1. United States
- 9.4.2. Canada
- 9.5. Market Analysis, Insights and Forecast - by Europe
- 9.5.1. United Kingdom
- 9.5.2. France
- 9.5.3. Germany
- 9.5.4. Russia
- 9.5.5. Rest of Europe
- 9.6. Market Analysis, Insights and Forecast - by Asia-Pacific
- 9.6.1. China
- 9.6.2. India
- 9.6.3. Japan
- 9.6.4. South Korea
- 9.6.5. Rest of Asia-Pacific
- 9.7. Market Analysis, Insights and Forecast - by Latin America
- 9.7.1. Brazil
- 9.7.2. Mexico
- 9.7.3. Rest of Latin America
- 9.8. Market Analysis, Insights and Forecast - by Middle East and Africa
- 9.8.1. United Arab Emirates
- 9.8.2. Saudi Arabia
- 9.8.3. Turkey
- 9.8.4. South Africa
- 9.8.5. Rest of Middle East and Africa
- 9.1. Market Analysis, Insights and Forecast - by Platform
- 10. Middle East & Africa Weapons Carriage & Release Systems Industry Analysis, Insights and Forecast, 2020-2032
- 10.1. Market Analysis, Insights and Forecast - by Platform
- 10.1.1. Aircraft
- 10.1.2. Helicopters
- 10.1.3. Unmanned Aerial Vehicles
- 10.2. Market Analysis, Insights and Forecast - by Weapon Type
- 10.2.1. Missiles
- 10.2.2. Bombs
- 10.3. Market Analysis, Insights and Forecast - by Geography
- 10.4. Market Analysis, Insights and Forecast - by North America
- 10.4.1. United States
- 10.4.2. Canada
- 10.5. Market Analysis, Insights and Forecast - by Europe
- 10.5.1. United Kingdom
- 10.5.2. France
- 10.5.3. Germany
- 10.5.4. Russia
- 10.5.5. Rest of Europe
- 10.6. Market Analysis, Insights and Forecast - by Asia-Pacific
- 10.6.1. China
- 10.6.2. India
- 10.6.3. Japan
- 10.6.4. South Korea
- 10.6.5. Rest of Asia-Pacific
- 10.7. Market Analysis, Insights and Forecast - by Latin America
- 10.7.1. Brazil
- 10.7.2. Mexico
- 10.7.3. Rest of Latin America
- 10.8. Market Analysis, Insights and Forecast - by Middle East and Africa
- 10.8.1. United Arab Emirates
- 10.8.2. Saudi Arabia
- 10.8.3. Turkey
- 10.8.4. South Africa
- 10.8.5. Rest of Middle East and Africa
- 10.1. Market Analysis, Insights and Forecast - by Platform
- 11. Asia Pacific Weapons Carriage & Release Systems Industry Analysis, Insights and Forecast, 2020-2032
- 11.1. Market Analysis, Insights and Forecast - by Platform
- 11.1.1. Aircraft
- 11.1.2. Helicopters
- 11.1.3. Unmanned Aerial Vehicles
- 11.2. Market Analysis, Insights and Forecast - by Weapon Type
- 11.2.1. Missiles
- 11.2.2. Bombs
- 11.3. Market Analysis, Insights and Forecast - by Geography
- 11.4. Market Analysis, Insights and Forecast - by North America
- 11.4.1. United States
- 11.4.2. Canada
- 11.5. Market Analysis, Insights and Forecast - by Europe
- 11.5.1. United Kingdom
- 11.5.2. France
- 11.5.3. Germany
- 11.5.4. Russia
- 11.5.5. Rest of Europe
- 11.6. Market Analysis, Insights and Forecast - by Asia-Pacific
- 11.6.1. China
- 11.6.2. India
- 11.6.3. Japan
- 11.6.4. South Korea
- 11.6.5. Rest of Asia-Pacific
- 11.7. Market Analysis, Insights and Forecast - by Latin America
- 11.7.1. Brazil
- 11.7.2. Mexico
- 11.7.3. Rest of Latin America
- 11.8. Market Analysis, Insights and Forecast - by Middle East and Africa
- 11.8.1. United Arab Emirates
- 11.8.2. Saudi Arabia
- 11.8.3. Turkey
- 11.8.4. South Africa
- 11.8.5. Rest of Middle East and Africa
- 11.1. Market Analysis, Insights and Forecast - by Platform
- 12. Competitive Analysis
- 12.1. Company Profiles
- 12.1.1 The Marvin Group
- 12.1.1.1. Company Overview
- 12.1.1.2. Products
- 12.1.1.3. Company Financials
- 12.1.1.4. SWOT Analysis
- 12.1.2 L3Harris Technologies Inc
- 12.1.2.1. Company Overview
- 12.1.2.2. Products
- 12.1.2.3. Company Financials
- 12.1.2.4. SWOT Analysis
- 12.1.3 Systima Technologies Inc (Karman Space & Defense
- 12.1.3.1. Company Overview
- 12.1.3.2. Products
- 12.1.3.3. Company Financials
- 12.1.3.4. SWOT Analysis
- 12.1.4 Cobham Limited
- 12.1.4.1. Company Overview
- 12.1.4.2. Products
- 12.1.4.3. Company Financials
- 12.1.4.4. SWOT Analysis
- 12.1.5 Moog Inc
- 12.1.5.1. Company Overview
- 12.1.5.2. Products
- 12.1.5.3. Company Financials
- 12.1.5.4. SWOT Analysis
- 12.1.6 RTX Corporation
- 12.1.6.1. Company Overview
- 12.1.6.2. Products
- 12.1.6.3. Company Financials
- 12.1.6.4. SWOT Analysis
- 12.1.7 Alkan
- 12.1.7.1. Company Overview
- 12.1.7.2. Products
- 12.1.7.3. Company Financials
- 12.1.7.4. SWOT Analysis
- 12.1.8 Marotta Controls Inc
- 12.1.8.1. Company Overview
- 12.1.8.2. Products
- 12.1.8.3. Company Financials
- 12.1.8.4. SWOT Analysis
- 12.1.1 The Marvin Group
- 12.2. Market Entropy
- 12.2.1 Company's Key Areas Served
- 12.2.2 Recent Developments
- 12.3. Company Market Share Analysis 2025
- 12.3.1 Top 5 Companies Market Share Analysis
- 12.3.2 Top 3 Companies Market Share Analysis
- 12.4. List of Potential Customers
- 13. Research Methodology
List of Figures
- Figure 1: Global Weapons Carriage & Release Systems Industry Revenue Breakdown (Million, %) by Region 2025 & 2033
- Figure 2: North America Weapons Carriage & Release Systems Industry Revenue (Million), by Platform 2025 & 2033
- Figure 3: North America Weapons Carriage & Release Systems Industry Revenue Share (%), by Platform 2025 & 2033
- Figure 4: North America Weapons Carriage & Release Systems Industry Revenue (Million), by Weapon Type 2025 & 2033
- Figure 5: North America Weapons Carriage & Release Systems Industry Revenue Share (%), by Weapon Type 2025 & 2033
- Figure 6: North America Weapons Carriage & Release Systems Industry Revenue (Million), by Geography 2025 & 2033
- Figure 7: North America Weapons Carriage & Release Systems Industry Revenue Share (%), by Geography 2025 & 2033
- Figure 8: North America Weapons Carriage & Release Systems Industry Revenue (Million), by North America 2025 & 2033
- Figure 9: North America Weapons Carriage & Release Systems Industry Revenue Share (%), by North America 2025 & 2033
- Figure 10: North America Weapons Carriage & Release Systems Industry Revenue (Million), by Europe 2025 & 2033
- Figure 11: North America Weapons Carriage & Release Systems Industry Revenue Share (%), by Europe 2025 & 2033
- Figure 12: North America Weapons Carriage & Release Systems Industry Revenue (Million), by Asia-Pacific 2025 & 2033
- Figure 13: North America Weapons Carriage & Release Systems Industry Revenue Share (%), by Asia-Pacific 2025 & 2033
- Figure 14: North America Weapons Carriage & Release Systems Industry Revenue (Million), by Latin America 2025 & 2033
- Figure 15: North America Weapons Carriage & Release Systems Industry Revenue Share (%), by Latin America 2025 & 2033
- Figure 16: North America Weapons Carriage & Release Systems Industry Revenue (Million), by Middle East and Africa 2025 & 2033
- Figure 17: North America Weapons Carriage & Release Systems Industry Revenue Share (%), by Middle East and Africa 2025 & 2033
- Figure 18: North America Weapons Carriage & Release Systems Industry Revenue (Million), by Country 2025 & 2033
- Figure 19: North America Weapons Carriage & Release Systems Industry Revenue Share (%), by Country 2025 & 2033
- Figure 20: South America Weapons Carriage & Release Systems Industry Revenue (Million), by Platform 2025 & 2033
- Figure 21: South America Weapons Carriage & Release Systems Industry Revenue Share (%), by Platform 2025 & 2033
- Figure 22: South America Weapons Carriage & Release Systems Industry Revenue (Million), by Weapon Type 2025 & 2033
- Figure 23: South America Weapons Carriage & Release Systems Industry Revenue Share (%), by Weapon Type 2025 & 2033
- Figure 24: South America Weapons Carriage & Release Systems Industry Revenue (Million), by Geography 2025 & 2033
- Figure 25: South America Weapons Carriage & Release Systems Industry Revenue Share (%), by Geography 2025 & 2033
- Figure 26: South America Weapons Carriage & Release Systems Industry Revenue (Million), by North America 2025 & 2033
- Figure 27: South America Weapons Carriage & Release Systems Industry Revenue Share (%), by North America 2025 & 2033
- Figure 28: South America Weapons Carriage & Release Systems Industry Revenue (Million), by Europe 2025 & 2033
- Figure 29: South America Weapons Carriage & Release Systems Industry Revenue Share (%), by Europe 2025 & 2033
- Figure 30: South America Weapons Carriage & Release Systems Industry Revenue (Million), by Asia-Pacific 2025 & 2033
- Figure 31: South America Weapons Carriage & Release Systems Industry Revenue Share (%), by Asia-Pacific 2025 & 2033
- Figure 32: South America Weapons Carriage & Release Systems Industry Revenue (Million), by Latin America 2025 & 2033
- Figure 33: South America Weapons Carriage & Release Systems Industry Revenue Share (%), by Latin America 2025 & 2033
- Figure 34: South America Weapons Carriage & Release Systems Industry Revenue (Million), by Middle East and Africa 2025 & 2033
- Figure 35: South America Weapons Carriage & Release Systems Industry Revenue Share (%), by Middle East and Africa 2025 & 2033
- Figure 36: South America Weapons Carriage & Release Systems Industry Revenue (Million), by Country 2025 & 2033
- Figure 37: South America Weapons Carriage & Release Systems Industry Revenue Share (%), by Country 2025 & 2033
- Figure 38: Europe Weapons Carriage & Release Systems Industry Revenue (Million), by Platform 2025 & 2033
- Figure 39: Europe Weapons Carriage & Release Systems Industry Revenue Share (%), by Platform 2025 & 2033
- Figure 40: Europe Weapons Carriage & Release Systems Industry Revenue (Million), by Weapon Type 2025 & 2033
- Figure 41: Europe Weapons Carriage & Release Systems Industry Revenue Share (%), by Weapon Type 2025 & 2033
- Figure 42: Europe Weapons Carriage & Release Systems Industry Revenue (Million), by Geography 2025 & 2033
- Figure 43: Europe Weapons Carriage & Release Systems Industry Revenue Share (%), by Geography 2025 & 2033
- Figure 44: Europe Weapons Carriage & Release Systems Industry Revenue (Million), by North America 2025 & 2033
- Figure 45: Europe Weapons Carriage & Release Systems Industry Revenue Share (%), by North America 2025 & 2033
- Figure 46: Europe Weapons Carriage & Release Systems Industry Revenue (Million), by Europe 2025 & 2033
- Figure 47: Europe Weapons Carriage & Release Systems Industry Revenue Share (%), by Europe 2025 & 2033
- Figure 48: Europe Weapons Carriage & Release Systems Industry Revenue (Million), by Asia-Pacific 2025 & 2033
- Figure 49: Europe Weapons Carriage & Release Systems Industry Revenue Share (%), by Asia-Pacific 2025 & 2033
- Figure 50: Europe Weapons Carriage & Release Systems Industry Revenue (Million), by Latin America 2025 & 2033
- Figure 51: Europe Weapons Carriage & Release Systems Industry Revenue Share (%), by Latin America 2025 & 2033
- Figure 52: Europe Weapons Carriage & Release Systems Industry Revenue (Million), by Middle East and Africa 2025 & 2033
- Figure 53: Europe Weapons Carriage & Release Systems Industry Revenue Share (%), by Middle East and Africa 2025 & 2033
- Figure 54: Europe Weapons Carriage & Release Systems Industry Revenue (Million), by Country 2025 & 2033
- Figure 55: Europe Weapons Carriage & Release Systems Industry Revenue Share (%), by Country 2025 & 2033
- Figure 56: Middle East & Africa Weapons Carriage & Release Systems Industry Revenue (Million), by Platform 2025 & 2033
- Figure 57: Middle East & Africa Weapons Carriage & Release Systems Industry Revenue Share (%), by Platform 2025 & 2033
- Figure 58: Middle East & Africa Weapons Carriage & Release Systems Industry Revenue (Million), by Weapon Type 2025 & 2033
- Figure 59: Middle East & Africa Weapons Carriage & Release Systems Industry Revenue Share (%), by Weapon Type 2025 & 2033
- Figure 60: Middle East & Africa Weapons Carriage & Release Systems Industry Revenue (Million), by Geography 2025 & 2033
- Figure 61: Middle East & Africa Weapons Carriage & Release Systems Industry Revenue Share (%), by Geography 2025 & 2033
- Figure 62: Middle East & Africa Weapons Carriage & Release Systems Industry Revenue (Million), by North America 2025 & 2033
- Figure 63: Middle East & Africa Weapons Carriage & Release Systems Industry Revenue Share (%), by North America 2025 & 2033
- Figure 64: Middle East & Africa Weapons Carriage & Release Systems Industry Revenue (Million), by Europe 2025 & 2033
- Figure 65: Middle East & Africa Weapons Carriage & Release Systems Industry Revenue Share (%), by Europe 2025 & 2033
- Figure 66: Middle East & Africa Weapons Carriage & Release Systems Industry Revenue (Million), by Asia-Pacific 2025 & 2033
- Figure 67: Middle East & Africa Weapons Carriage & Release Systems Industry Revenue Share (%), by Asia-Pacific 2025 & 2033
- Figure 68: Middle East & Africa Weapons Carriage & Release Systems Industry Revenue (Million), by Latin America 2025 & 2033
- Figure 69: Middle East & Africa Weapons Carriage & Release Systems Industry Revenue Share (%), by Latin America 2025 & 2033
- Figure 70: Middle East & Africa Weapons Carriage & Release Systems Industry Revenue (Million), by Middle East and Africa 2025 & 2033
- Figure 71: Middle East & Africa Weapons Carriage & Release Systems Industry Revenue Share (%), by Middle East and Africa 2025 & 2033
- Figure 72: Middle East & Africa Weapons Carriage & Release Systems Industry Revenue (Million), by Country 2025 & 2033
- Figure 73: Middle East & Africa Weapons Carriage & Release Systems Industry Revenue Share (%), by Country 2025 & 2033
- Figure 74: Asia Pacific Weapons Carriage & Release Systems Industry Revenue (Million), by Platform 2025 & 2033
- Figure 75: Asia Pacific Weapons Carriage & Release Systems Industry Revenue Share (%), by Platform 2025 & 2033
- Figure 76: Asia Pacific Weapons Carriage & Release Systems Industry Revenue (Million), by Weapon Type 2025 & 2033
- Figure 77: Asia Pacific Weapons Carriage & Release Systems Industry Revenue Share (%), by Weapon Type 2025 & 2033
- Figure 78: Asia Pacific Weapons Carriage & Release Systems Industry Revenue (Million), by Geography 2025 & 2033
- Figure 79: Asia Pacific Weapons Carriage & Release Systems Industry Revenue Share (%), by Geography 2025 & 2033
- Figure 80: Asia Pacific Weapons Carriage & Release Systems Industry Revenue (Million), by North America 2025 & 2033
- Figure 81: Asia Pacific Weapons Carriage & Release Systems Industry Revenue Share (%), by North America 2025 & 2033
- Figure 82: Asia Pacific Weapons Carriage & Release Systems Industry Revenue (Million), by Europe 2025 & 2033
- Figure 83: Asia Pacific Weapons Carriage & Release Systems Industry Revenue Share (%), by Europe 2025 & 2033
- Figure 84: Asia Pacific Weapons Carriage & Release Systems Industry Revenue (Million), by Asia-Pacific 2025 & 2033
- Figure 85: Asia Pacific Weapons Carriage & Release Systems Industry Revenue Share (%), by Asia-Pacific 2025 & 2033
- Figure 86: Asia Pacific Weapons Carriage & Release Systems Industry Revenue (Million), by Latin America 2025 & 2033
- Figure 87: Asia Pacific Weapons Carriage & Release Systems Industry Revenue Share (%), by Latin America 2025 & 2033
- Figure 88: Asia Pacific Weapons Carriage & Release Systems Industry Revenue (Million), by Middle East and Africa 2025 & 2033
- Figure 89: Asia Pacific Weapons Carriage & Release Systems Industry Revenue Share (%), by Middle East and Africa 2025 & 2033
- Figure 90: Asia Pacific Weapons Carriage & Release Systems Industry Revenue (Million), by Country 2025 & 2033
- Figure 91: Asia Pacific Weapons Carriage & Release Systems Industry Revenue Share (%), by Country 2025 & 2033
List of Tables
- Table 1: Global Weapons Carriage & Release Systems Industry Revenue Million Forecast, by Platform 2020 & 2033
- Table 2: Global Weapons Carriage & Release Systems Industry Revenue Million Forecast, by Weapon Type 2020 & 2033
- Table 3: Global Weapons Carriage & Release Systems Industry Revenue Million Forecast, by Geography 2020 & 2033
- Table 4: Global Weapons Carriage & Release Systems Industry Revenue Million Forecast, by North America 2020 & 2033
- Table 5: Global Weapons Carriage & Release Systems Industry Revenue Million Forecast, by Europe 2020 & 2033
- Table 6: Global Weapons Carriage & Release Systems Industry Revenue Million Forecast, by Asia-Pacific 2020 & 2033
- Table 7: Global Weapons Carriage & Release Systems Industry Revenue Million Forecast, by Latin America 2020 & 2033
- Table 8: Global Weapons Carriage & Release Systems Industry Revenue Million Forecast, by Middle East and Africa 2020 & 2033
- Table 9: Global Weapons Carriage & Release Systems Industry Revenue Million Forecast, by Region 2020 & 2033
- Table 10: Global Weapons Carriage & Release Systems Industry Revenue Million Forecast, by Platform 2020 & 2033
- Table 11: Global Weapons Carriage & Release Systems Industry Revenue Million Forecast, by Weapon Type 2020 & 2033
- Table 12: Global Weapons Carriage & Release Systems Industry Revenue Million Forecast, by Geography 2020 & 2033
- Table 13: Global Weapons Carriage & Release Systems Industry Revenue Million Forecast, by North America 2020 & 2033
- Table 14: Global Weapons Carriage & Release Systems Industry Revenue Million Forecast, by Europe 2020 & 2033
- Table 15: Global Weapons Carriage & Release Systems Industry Revenue Million Forecast, by Asia-Pacific 2020 & 2033
- Table 16: Global Weapons Carriage & Release Systems Industry Revenue Million Forecast, by Latin America 2020 & 2033
- Table 17: Global Weapons Carriage & Release Systems Industry Revenue Million Forecast, by Middle East and Africa 2020 & 2033
- Table 18: Global Weapons Carriage & Release Systems Industry Revenue Million Forecast, by Country 2020 & 2033
- Table 19: United States Weapons Carriage & Release Systems Industry Revenue (Million) Forecast, by Application 2020 & 2033
- Table 20: Canada Weapons Carriage & Release Systems Industry Revenue (Million) Forecast, by Application 2020 & 2033
- Table 21: Mexico Weapons Carriage & Release Systems Industry Revenue (Million) Forecast, by Application 2020 & 2033
- Table 22: Global Weapons Carriage & Release Systems Industry Revenue Million Forecast, by Platform 2020 & 2033
- Table 23: Global Weapons Carriage & Release Systems Industry Revenue Million Forecast, by Weapon Type 2020 & 2033
- Table 24: Global Weapons Carriage & Release Systems Industry Revenue Million Forecast, by Geography 2020 & 2033
- Table 25: Global Weapons Carriage & Release Systems Industry Revenue Million Forecast, by North America 2020 & 2033
- Table 26: Global Weapons Carriage & Release Systems Industry Revenue Million Forecast, by Europe 2020 & 2033
- Table 27: Global Weapons Carriage & Release Systems Industry Revenue Million Forecast, by Asia-Pacific 2020 & 2033
- Table 28: Global Weapons Carriage & Release Systems Industry Revenue Million Forecast, by Latin America 2020 & 2033
- Table 29: Global Weapons Carriage & Release Systems Industry Revenue Million Forecast, by Middle East and Africa 2020 & 2033
- Table 30: Global Weapons Carriage & Release Systems Industry Revenue Million Forecast, by Country 2020 & 2033
- Table 31: Brazil Weapons Carriage & Release Systems Industry Revenue (Million) Forecast, by Application 2020 & 2033
- Table 32: Argentina Weapons Carriage & Release Systems Industry Revenue (Million) Forecast, by Application 2020 & 2033
- Table 33: Rest of South America Weapons Carriage & Release Systems Industry Revenue (Million) Forecast, by Application 2020 & 2033
- Table 34: Global Weapons Carriage & Release Systems Industry Revenue Million Forecast, by Platform 2020 & 2033
- Table 35: Global Weapons Carriage & Release Systems Industry Revenue Million Forecast, by Weapon Type 2020 & 2033
- Table 36: Global Weapons Carriage & Release Systems Industry Revenue Million Forecast, by Geography 2020 & 2033
- Table 37: Global Weapons Carriage & Release Systems Industry Revenue Million Forecast, by North America 2020 & 2033
- Table 38: Global Weapons Carriage & Release Systems Industry Revenue Million Forecast, by Europe 2020 & 2033
- Table 39: Global Weapons Carriage & Release Systems Industry Revenue Million Forecast, by Asia-Pacific 2020 & 2033
- Table 40: Global Weapons Carriage & Release Systems Industry Revenue Million Forecast, by Latin America 2020 & 2033
- Table 41: Global Weapons Carriage & Release Systems Industry Revenue Million Forecast, by Middle East and Africa 2020 & 2033
- Table 42: Global Weapons Carriage & Release Systems Industry Revenue Million Forecast, by Country 2020 & 2033
- Table 43: United Kingdom Weapons Carriage & Release Systems Industry Revenue (Million) Forecast, by Application 2020 & 2033
- Table 44: Germany Weapons Carriage & Release Systems Industry Revenue (Million) Forecast, by Application 2020 & 2033
- Table 45: France Weapons Carriage & Release Systems Industry Revenue (Million) Forecast, by Application 2020 & 2033
- Table 46: Italy Weapons Carriage & Release Systems Industry Revenue (Million) Forecast, by Application 2020 & 2033
- Table 47: Spain Weapons Carriage & Release Systems Industry Revenue (Million) Forecast, by Application 2020 & 2033
- Table 48: Russia Weapons Carriage & Release Systems Industry Revenue (Million) Forecast, by Application 2020 & 2033
- Table 49: Benelux Weapons Carriage & Release Systems Industry Revenue (Million) Forecast, by Application 2020 & 2033
- Table 50: Nordics Weapons Carriage & Release Systems Industry Revenue (Million) Forecast, by Application 2020 & 2033
- Table 51: Rest of Europe Weapons Carriage & Release Systems Industry Revenue (Million) Forecast, by Application 2020 & 2033
- Table 52: Global Weapons Carriage & Release Systems Industry Revenue Million Forecast, by Platform 2020 & 2033
- Table 53: Global Weapons Carriage & Release Systems Industry Revenue Million Forecast, by Weapon Type 2020 & 2033
- Table 54: Global Weapons Carriage & Release Systems Industry Revenue Million Forecast, by Geography 2020 & 2033
- Table 55: Global Weapons Carriage & Release Systems Industry Revenue Million Forecast, by North America 2020 & 2033
- Table 56: Global Weapons Carriage & Release Systems Industry Revenue Million Forecast, by Europe 2020 & 2033
- Table 57: Global Weapons Carriage & Release Systems Industry Revenue Million Forecast, by Asia-Pacific 2020 & 2033
- Table 58: Global Weapons Carriage & Release Systems Industry Revenue Million Forecast, by Latin America 2020 & 2033
- Table 59: Global Weapons Carriage & Release Systems Industry Revenue Million Forecast, by Middle East and Africa 2020 & 2033
- Table 60: Global Weapons Carriage & Release Systems Industry Revenue Million Forecast, by Country 2020 & 2033
- Table 61: Turkey Weapons Carriage & Release Systems Industry Revenue (Million) Forecast, by Application 2020 & 2033
- Table 62: Israel Weapons Carriage & Release Systems Industry Revenue (Million) Forecast, by Application 2020 & 2033
- Table 63: GCC Weapons Carriage & Release Systems Industry Revenue (Million) Forecast, by Application 2020 & 2033
- Table 64: North Africa Weapons Carriage & Release Systems Industry Revenue (Million) Forecast, by Application 2020 & 2033
- Table 65: South Africa Weapons Carriage & Release Systems Industry Revenue (Million) Forecast, by Application 2020 & 2033
- Table 66: Rest of Middle East & Africa Weapons Carriage & Release Systems Industry Revenue (Million) Forecast, by Application 2020 & 2033
- Table 67: Global Weapons Carriage & Release Systems Industry Revenue Million Forecast, by Platform 2020 & 2033
- Table 68: Global Weapons Carriage & Release Systems Industry Revenue Million Forecast, by Weapon Type 2020 & 2033
- Table 69: Global Weapons Carriage & Release Systems Industry Revenue Million Forecast, by Geography 2020 & 2033
- Table 70: Global Weapons Carriage & Release Systems Industry Revenue Million Forecast, by North America 2020 & 2033
- Table 71: Global Weapons Carriage & Release Systems Industry Revenue Million Forecast, by Europe 2020 & 2033
- Table 72: Global Weapons Carriage & Release Systems Industry Revenue Million Forecast, by Asia-Pacific 2020 & 2033
- Table 73: Global Weapons Carriage & Release Systems Industry Revenue Million Forecast, by Latin America 2020 & 2033
- Table 74: Global Weapons Carriage & Release Systems Industry Revenue Million Forecast, by Middle East and Africa 2020 & 2033
- Table 75: Global Weapons Carriage & Release Systems Industry Revenue Million Forecast, by Country 2020 & 2033
- Table 76: China Weapons Carriage & Release Systems Industry Revenue (Million) Forecast, by Application 2020 & 2033
- Table 77: India Weapons Carriage & Release Systems Industry Revenue (Million) Forecast, by Application 2020 & 2033
- Table 78: Japan Weapons Carriage & Release Systems Industry Revenue (Million) Forecast, by Application 2020 & 2033
- Table 79: South Korea Weapons Carriage & Release Systems Industry Revenue (Million) Forecast, by Application 2020 & 2033
- Table 80: ASEAN Weapons Carriage & Release Systems Industry Revenue (Million) Forecast, by Application 2020 & 2033
- Table 81: Oceania Weapons Carriage & Release Systems Industry Revenue (Million) Forecast, by Application 2020 & 2033
- Table 82: Rest of Asia Pacific Weapons Carriage & Release Systems Industry Revenue (Million) Forecast, by Application 2020 & 2033
Frequently Asked Questions
1. What is the projected Compound Annual Growth Rate (CAGR) of the Weapons Carriage & Release Systems Industry?
The projected CAGR is approximately 4.19%.
2. Which companies are prominent players in the Weapons Carriage & Release Systems Industry?
Key companies in the market include The Marvin Group, L3Harris Technologies Inc, Systima Technologies Inc (Karman Space & Defense, Cobham Limited, Moog Inc, RTX Corporation, Alkan, Marotta Controls Inc.
3. What are the main segments of the Weapons Carriage & Release Systems Industry?
The market segments include Platform, Weapon Type, Geography, North America, Europe, Asia-Pacific, Latin America, Middle East and Africa.
4. Can you provide details about the market size?
The market size is estimated to be USD 409.12 Million as of 2022.
5. What are some drivers contributing to market growth?
N/A
6. What are the notable trends driving market growth?
Aircraft Platform to Dominate the Market.
7. Are there any restraints impacting market growth?
N/A
8. Can you provide examples of recent developments in the market?
N/A
9. What pricing options are available for accessing the report?
Pricing options include single-user, multi-user, and enterprise licenses priced at USD 4750, USD 5250, and USD 8750 respectively.
10. Is the market size provided in terms of value or volume?
The market size is provided in terms of value, measured in Million.
11. Are there any specific market keywords associated with the report?
Yes, the market keyword associated with the report is "Weapons Carriage & Release Systems Industry," which aids in identifying and referencing the specific market segment covered.
12. How do I determine which pricing option suits my needs best?
The pricing options vary based on user requirements and access needs. Individual users may opt for single-user licenses, while businesses requiring broader access may choose multi-user or enterprise licenses for cost-effective access to the report.
13. Are there any additional resources or data provided in the Weapons Carriage & Release Systems Industry report?
While the report offers comprehensive insights, it's advisable to review the specific contents or supplementary materials provided to ascertain if additional resources or data are available.
14. How can I stay updated on further developments or reports in the Weapons Carriage & Release Systems Industry?
To stay informed about further developments, trends, and reports in the Weapons Carriage & Release Systems Industry, consider subscribing to industry newsletters, following relevant companies and organizations, or regularly checking reputable industry news sources and publications.
Methodology
Step 1 - Identification of Relevant Samples Size from Population Database


Step 2 - Approaches for Defining Global Market Size (Value, Volume* & Price*)

Note*: In applicable scenarios
Step 3 - Data Sources
Primary Research
- Web Analytics
- Survey Reports
- Research Institute
- Latest Research Reports
- Opinion Leaders
Secondary Research
- Annual Reports
- White Paper
- Latest Press Release
- Industry Association
- Paid Database
- Investor Presentations

Step 4 - Data Triangulation
Involves using different sources of information in order to increase the validity of a study
These sources are likely to be stakeholders in a program - participants, other researchers, program staff, other community members, and so on.
Then we put all data in single framework & apply various statistical tools to find out the dynamic on the market.
During the analysis stage, feedback from the stakeholder groups would be compared to determine areas of agreement as well as areas of divergence