

Key Insights
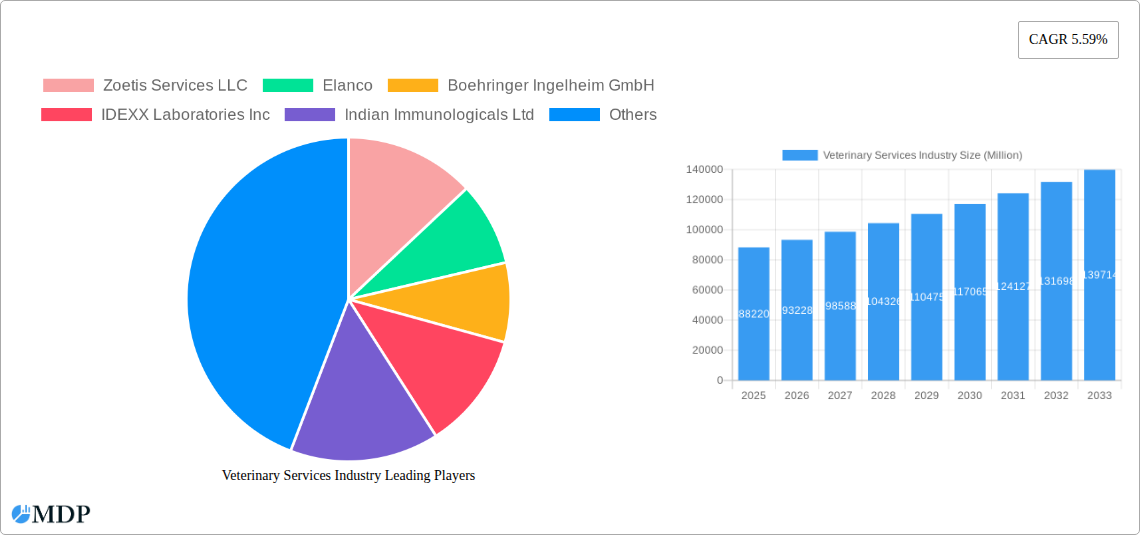
The global veterinary services market, valued at $88.22 billion in 2025, is projected to experience robust growth, driven by several key factors. Rising pet ownership worldwide, coupled with increasing humanization of pets and a greater willingness to invest in their healthcare, significantly fuels market expansion. Advances in veterinary technology, including diagnostic imaging, minimally invasive surgical techniques, and specialized treatments, enhance the quality of care and contribute to higher spending. The growing prevalence of chronic diseases in companion animals, like diabetes and cancer, necessitates ongoing veterinary care, further boosting market demand. Furthermore, the expanding role of veterinary services in areas such as preventative care, animal welfare initiatives, and specialized services like oncology and cardiology creates new revenue streams. The market is segmented by animal type (companion and production) and service type (primary, emergency, critical, specialty, and others like diagnostics and counseling). This segmentation reveals that companion animal care currently holds a larger share, although production animal services are also experiencing growth, driven by increasing focus on animal health in the agricultural sector.
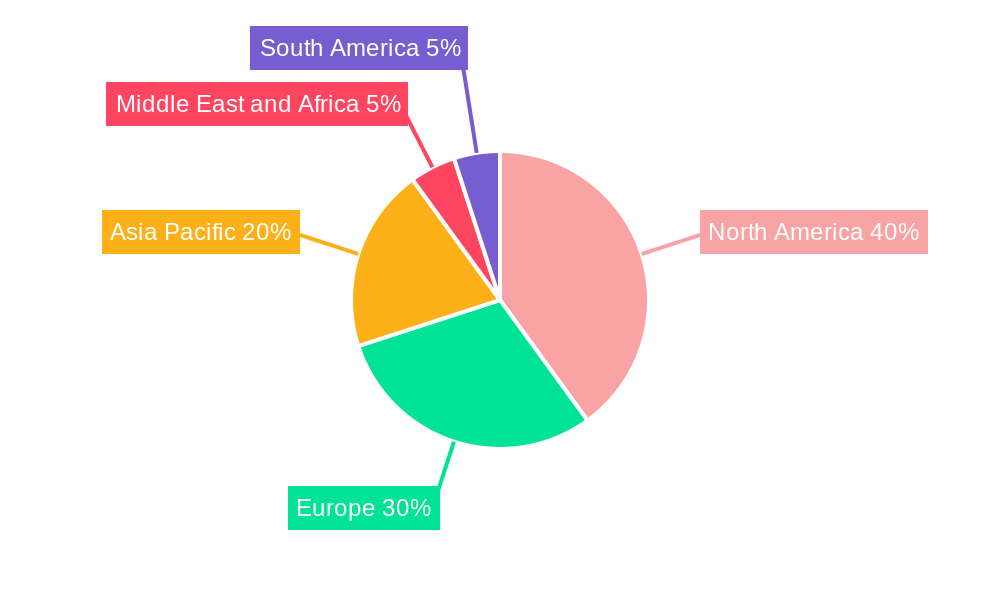
Regional variations in market size reflect differing levels of pet ownership, economic development, and access to healthcare. North America and Europe are currently dominant regions due to high per capita pet ownership and well-established veterinary infrastructure. However, rapid growth is anticipated in the Asia-Pacific region, driven by rising incomes and increasing pet adoption rates, particularly in developing economies. Competitive dynamics involve both large multinational corporations like Zoetis, Elanco, and IDEXX, and smaller, regional players focusing on specific niches. The forecast period (2025-2033) anticipates sustained growth at a CAGR of 5.59%, implying a significant expansion of the market size and a continued shift towards specialized and advanced veterinary services. This necessitates strategic investments in infrastructure, technological advancements, and skilled veterinary professionals to meet the growing demand.
This comprehensive report provides a detailed analysis of the Veterinary Services industry, projecting a market size exceeding $XX Million by 2033. It offers actionable insights for industry stakeholders, investors, and businesses seeking to navigate this dynamic market. The report covers key market segments, leading players, and emerging trends, offering a robust forecast for the period 2025-2033 (Base Year: 2025, Estimated Year: 2025). Discover valuable data on market concentration, growth drivers, challenges, and opportunities within the Veterinary Services sector.
Veterinary Services Industry Market Dynamics & Concentration
The global veterinary services market is characterized by a moderately concentrated landscape, with key players like Zoetis Services LLC, Elanco, and Boehringer Ingelheim GmbH holding significant market share. The market share of these top 3 players is estimated to be approximately xx%. However, the market also features several smaller, specialized players catering to niche segments. Innovation in diagnostics, therapeutics, and preventive care drives market growth. Stringent regulatory frameworks governing animal health products and practices influence industry operations. Product substitutes, such as homeopathic remedies and traditional medicine, exist but pose a limited threat. End-user trends towards increased pet ownership and enhanced animal welfare contribute significantly to market expansion. The past five years have witnessed a notable increase in M&A activity, with approximately xx major deals recorded between 2019 and 2024. These mergers and acquisitions primarily focus on expanding product portfolios, geographical reach, and technological capabilities.
- Market Concentration: Moderately concentrated, with top 3 players holding xx% market share (2024).
- Innovation Drivers: Advancements in diagnostics, therapeutics, and preventive care.
- Regulatory Frameworks: Stringent regulations governing animal health products and practices.
- Product Substitutes: Limited threat from homeopathic and traditional medicine.
- End-User Trends: Rising pet ownership and increased focus on animal welfare.
- M&A Activity: Approximately xx major deals between 2019 and 2024.
Veterinary Services Industry Industry Trends & Analysis
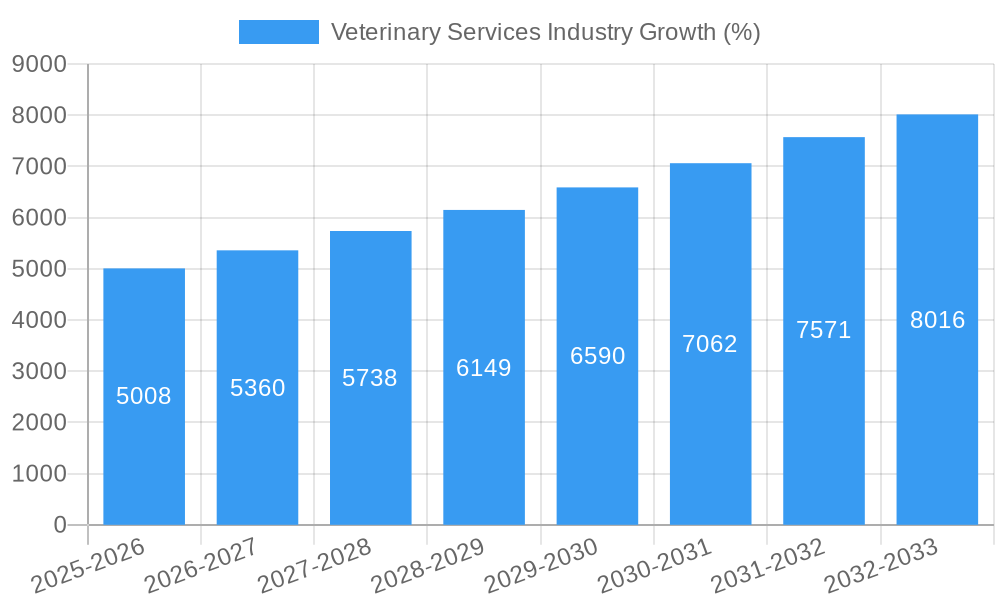
The veterinary services market exhibits a robust Compound Annual Growth Rate (CAGR) of xx% during the historical period (2019-2024) and is projected to maintain a CAGR of xx% throughout the forecast period (2025-2033). This growth is propelled by several factors, including increasing pet humanization, rising disposable incomes in developing economies, technological advancements like telemedicine and advanced diagnostics, and a growing awareness of preventative animal healthcare. The market penetration of specialized veterinary services, particularly in areas like cardiology and oncology, is also increasing significantly. Competitive dynamics are characterized by both intense competition among established players and the emergence of innovative start-ups offering specialized services. Consumer preferences are shifting towards personalized care, advanced treatment options, and convenient service delivery models.
Leading Markets & Segments in Veterinary Services Industry
The companion animal segment dominates the veterinary services market, accounting for approximately xx% of the total revenue in 2024. This dominance is primarily attributed to the increasing humanization of pets and higher spending on their healthcare. Geographically, North America and Europe currently represent the largest markets, driven by factors such as high pet ownership rates, strong regulatory frameworks, and advanced healthcare infrastructure. Within the "By Type of Care" segment, primary care services currently hold the largest market share, followed by specialty services.
Key Drivers:
- Companion Animal Segment: High pet ownership, increasing pet humanization, higher disposable incomes.
- North America & Europe: High pet ownership rates, robust regulatory frameworks, advanced infrastructure.
- Primary Care: High prevalence of routine health checks and preventative care.
Dominance Analysis: The companion animal segment's dominance is likely to continue throughout the forecast period due to sustained growth in pet ownership and increasing consumer spending on pet healthcare. North America and Europe will likely maintain their leading positions, but significant growth potential exists in emerging markets with rising pet ownership and increasing disposable incomes.
Veterinary Services Industry Product Developments
Recent product developments highlight the integration of advanced technologies in veterinary care. New diagnostic tools, such as point-of-care diagnostics and advanced imaging techniques, provide faster and more accurate diagnoses. The development of novel therapeutics, including targeted therapies for cancer and other diseases, improves treatment outcomes. These advancements not only enhance the quality of animal care but also improve the efficiency and profitability of veterinary practices. Animalcare's launch of Plaqtiv+ demonstrates a focus on preventive care, catering to growing consumer demand for pet dental health products. Aurena Laboratories' collaboration with Emollivet signifies a surge in partnerships focused on innovative delivery systems for animal healthcare products.
Key Drivers of Veterinary Services Industry Growth
Several key factors propel the growth of the veterinary services industry. Technological advancements, like telemedicine and sophisticated diagnostic tools, significantly improve healthcare accessibility and efficiency. Rising disposable incomes, especially in developing economies, lead to increased pet ownership and higher spending on veterinary services. Favorable regulatory environments in many countries support industry expansion. Finally, increasing awareness of animal welfare and preventative healthcare drives higher demand for veterinary services.
Challenges in the Veterinary Services Industry Market
The veterinary services industry faces several challenges. Stringent regulatory approvals for new products and services can delay market entry and increase development costs. Supply chain disruptions, especially concerning pharmaceuticals and medical devices, impact service availability and pricing. Intense competition among established players and the emergence of new entrants further pressure profit margins. These factors can collectively limit market expansion and profitability. For example, supply chain issues during 2022 resulted in a xx% increase in the cost of certain veterinary drugs.
Emerging Opportunities in Veterinary Services Industry
The veterinary services market presents significant long-term opportunities. Technological breakthroughs in areas like genomics and personalized medicine will lead to more targeted and effective treatments. Strategic partnerships between veterinary practices and technology companies will enhance service delivery and efficiency. Expansion into underserved markets, particularly in developing economies, offers significant potential for growth. These factors collectively contribute to a positive long-term outlook for the industry.
Leading Players in the Veterinary Services Industry Sector
- Zoetis Services LLC
- Elanco
- Boehringer Ingelheim GmbH
- IDEXX Laboratories Inc
- Indian Immunologicals Ltd
- Vetoquinol S A
- Hester Bioscience
- Heska Corp
- Ceva Sant Animale
- Phibro Animal Health
- Virbac
- Merck Animal Health
Key Milestones in Veterinary Services Industry Industry
- April 2022: Animalcare launched Plaqtiv+, a range of dental care products for cats and dogs, expanding the preventive care segment and increasing competition in the pet dental health market.
- April 2022: Aurena Laboratories AB partnered with Emollivet, signifying a growing trend of collaborations to innovate and enhance animal healthcare product delivery systems. This partnership could significantly impact the market share of spray-form animal health products.
Strategic Outlook for Veterinary Services Industry Market
The veterinary services market is poised for sustained growth, driven by technological advancements, increasing pet ownership, and rising consumer spending on animal healthcare. Strategic opportunities exist in developing innovative products and services, expanding into new geographic markets, and forming strategic partnerships to enhance service delivery and market penetration. A focus on preventive care and personalized medicine will be crucial for capturing market share and achieving long-term success in this dynamic industry.
Veterinary Services Industry Segmentation
-
1. Animal Type
- 1.1. Companion Animal
- 1.2. Production Animal
-
2. Type of Care
- 2.1. Primary
- 2.2. Emergency
- 2.3. Critical
- 2.4. Specialty Services
- 2.5. Others S
Veterinary Services Industry Segmentation By Geography
-
1. North America
- 1.1. United States
- 1.2. Canada
- 1.3. Mexico
-
2. Europe
- 2.1. Germany
- 2.2. United Kingdom
- 2.3. France
- 2.4. Italy
- 2.5. Spain
- 2.6. Rest of Europe
-
3. Asia Pacific
- 3.1. China
- 3.2. Japan
- 3.3. India
- 3.4. Australia
- 3.5. South Korea
- 3.6. Rest of Asia Pacific
-
4. Middle East and Africa
- 4.1. GCC
- 4.2. South Africa
- 4.3. Rest of Middle East and Africa
-
5. South America
- 5.1. Brazil
- 5.2. Argentina
- 5.3. Rest of South America
Veterinary Services Industry REPORT HIGHLIGHTS
| Aspects | Details |
|---|---|
| Study Period | 2019-2033 |
| Base Year | 2024 |
| Estimated Year | 2025 |
| Forecast Period | 2025-2033 |
| Historical Period | 2019-2024 |
| Growth Rate | CAGR of 5.59% from 2019-2033 |
| Segmentation |
|
Table of Contents
- 1. Introduction
- 1.1. Research Scope
- 1.2. Market Segmentation
- 1.3. Research Methodology
- 1.4. Definitions and Assumptions
- 2. Executive Summary
- 2.1. Introduction
- 3. Market Dynamics
- 3.1. Introduction
- 3.2. Market Drivers
- 3.2.1. Rising Chronic Diseases and Awareness Regarding Veterinary Care; Increasing Initiatives by Governments and Animal Welfare Associations in Different Countries
- 3.3. Market Restrains
- 3.3.1. Increasing Costs of Animal Care Product and Veterinary Services
- 3.4. Market Trends
- 3.4.1. Companion Animal Segment is Expected to Hold Significant Market Share in the Market Over the Forecast Period
- 4. Market Factor Analysis
- 4.1. Porters Five Forces
- 4.2. Supply/Value Chain
- 4.3. PESTEL analysis
- 4.4. Market Entropy
- 4.5. Patent/Trademark Analysis
- 5. Global Veterinary Services Industry Analysis, Insights and Forecast, 2019-2031
- 5.1. Market Analysis, Insights and Forecast - by Animal Type
- 5.1.1. Companion Animal
- 5.1.2. Production Animal
- 5.2. Market Analysis, Insights and Forecast - by Type of Care
- 5.2.1. Primary
- 5.2.2. Emergency
- 5.2.3. Critical
- 5.2.4. Specialty Services
- 5.2.5. Others S
- 5.3. Market Analysis, Insights and Forecast - by Region
- 5.3.1. North America
- 5.3.2. Europe
- 5.3.3. Asia Pacific
- 5.3.4. Middle East and Africa
- 5.3.5. South America
- 5.1. Market Analysis, Insights and Forecast - by Animal Type
- 6. North America Veterinary Services Industry Analysis, Insights and Forecast, 2019-2031
- 6.1. Market Analysis, Insights and Forecast - by Animal Type
- 6.1.1. Companion Animal
- 6.1.2. Production Animal
- 6.2. Market Analysis, Insights and Forecast - by Type of Care
- 6.2.1. Primary
- 6.2.2. Emergency
- 6.2.3. Critical
- 6.2.4. Specialty Services
- 6.2.5. Others S
- 6.1. Market Analysis, Insights and Forecast - by Animal Type
- 7. Europe Veterinary Services Industry Analysis, Insights and Forecast, 2019-2031
- 7.1. Market Analysis, Insights and Forecast - by Animal Type
- 7.1.1. Companion Animal
- 7.1.2. Production Animal
- 7.2. Market Analysis, Insights and Forecast - by Type of Care
- 7.2.1. Primary
- 7.2.2. Emergency
- 7.2.3. Critical
- 7.2.4. Specialty Services
- 7.2.5. Others S
- 7.1. Market Analysis, Insights and Forecast - by Animal Type
- 8. Asia Pacific Veterinary Services Industry Analysis, Insights and Forecast, 2019-2031
- 8.1. Market Analysis, Insights and Forecast - by Animal Type
- 8.1.1. Companion Animal
- 8.1.2. Production Animal
- 8.2. Market Analysis, Insights and Forecast - by Type of Care
- 8.2.1. Primary
- 8.2.2. Emergency
- 8.2.3. Critical
- 8.2.4. Specialty Services
- 8.2.5. Others S
- 8.1. Market Analysis, Insights and Forecast - by Animal Type
- 9. Middle East and Africa Veterinary Services Industry Analysis, Insights and Forecast, 2019-2031
- 9.1. Market Analysis, Insights and Forecast - by Animal Type
- 9.1.1. Companion Animal
- 9.1.2. Production Animal
- 9.2. Market Analysis, Insights and Forecast - by Type of Care
- 9.2.1. Primary
- 9.2.2. Emergency
- 9.2.3. Critical
- 9.2.4. Specialty Services
- 9.2.5. Others S
- 9.1. Market Analysis, Insights and Forecast - by Animal Type
- 10. South America Veterinary Services Industry Analysis, Insights and Forecast, 2019-2031
- 10.1. Market Analysis, Insights and Forecast - by Animal Type
- 10.1.1. Companion Animal
- 10.1.2. Production Animal
- 10.2. Market Analysis, Insights and Forecast - by Type of Care
- 10.2.1. Primary
- 10.2.2. Emergency
- 10.2.3. Critical
- 10.2.4. Specialty Services
- 10.2.5. Others S
- 10.1. Market Analysis, Insights and Forecast - by Animal Type
- 11. North America Veterinary Services Industry Analysis, Insights and Forecast, 2019-2031
- 11.1. Market Analysis, Insights and Forecast - By Country/Sub-region
- 11.1.1 United States
- 11.1.2 Canada
- 11.1.3 Mexico
- 12. Europe Veterinary Services Industry Analysis, Insights and Forecast, 2019-2031
- 12.1. Market Analysis, Insights and Forecast - By Country/Sub-region
- 12.1.1 Germany
- 12.1.2 United Kingdom
- 12.1.3 France
- 12.1.4 Italy
- 12.1.5 Spain
- 12.1.6 Rest of Europe
- 13. Asia Pacific Veterinary Services Industry Analysis, Insights and Forecast, 2019-2031
- 13.1. Market Analysis, Insights and Forecast - By Country/Sub-region
- 13.1.1 China
- 13.1.2 Japan
- 13.1.3 India
- 13.1.4 Australia
- 13.1.5 South Korea
- 13.1.6 Rest of Asia Pacific
- 14. Middle East and Africa Veterinary Services Industry Analysis, Insights and Forecast, 2019-2031
- 14.1. Market Analysis, Insights and Forecast - By Country/Sub-region
- 14.1.1 GCC
- 14.1.2 South Africa
- 14.1.3 Rest of Middle East and Africa
- 15. South America Veterinary Services Industry Analysis, Insights and Forecast, 2019-2031
- 15.1. Market Analysis, Insights and Forecast - By Country/Sub-region
- 15.1.1 Brazil
- 15.1.2 Argentina
- 15.1.3 Rest of South America
- 16. Competitive Analysis
- 16.1. Global Market Share Analysis 2024
- 16.2. Company Profiles
- 16.2.1 Zoetis Services LLC
- 16.2.1.1. Overview
- 16.2.1.2. Products
- 16.2.1.3. SWOT Analysis
- 16.2.1.4. Recent Developments
- 16.2.1.5. Financials (Based on Availability)
- 16.2.2 Elanco
- 16.2.2.1. Overview
- 16.2.2.2. Products
- 16.2.2.3. SWOT Analysis
- 16.2.2.4. Recent Developments
- 16.2.2.5. Financials (Based on Availability)
- 16.2.3 Boehringer Ingelheim GmbH
- 16.2.3.1. Overview
- 16.2.3.2. Products
- 16.2.3.3. SWOT Analysis
- 16.2.3.4. Recent Developments
- 16.2.3.5. Financials (Based on Availability)
- 16.2.4 IDEXX Laboratories Inc
- 16.2.4.1. Overview
- 16.2.4.2. Products
- 16.2.4.3. SWOT Analysis
- 16.2.4.4. Recent Developments
- 16.2.4.5. Financials (Based on Availability)
- 16.2.5 Indian Immunologicals Ltd
- 16.2.5.1. Overview
- 16.2.5.2. Products
- 16.2.5.3. SWOT Analysis
- 16.2.5.4. Recent Developments
- 16.2.5.5. Financials (Based on Availability)
- 16.2.6 Vetoquinol S A
- 16.2.6.1. Overview
- 16.2.6.2. Products
- 16.2.6.3. SWOT Analysis
- 16.2.6.4. Recent Developments
- 16.2.6.5. Financials (Based on Availability)
- 16.2.7 Hester Bioscience
- 16.2.7.1. Overview
- 16.2.7.2. Products
- 16.2.7.3. SWOT Analysis
- 16.2.7.4. Recent Developments
- 16.2.7.5. Financials (Based on Availability)
- 16.2.8 Heska Corp
- 16.2.8.1. Overview
- 16.2.8.2. Products
- 16.2.8.3. SWOT Analysis
- 16.2.8.4. Recent Developments
- 16.2.8.5. Financials (Based on Availability)
- 16.2.9 Ceva Sant Animale
- 16.2.9.1. Overview
- 16.2.9.2. Products
- 16.2.9.3. SWOT Analysis
- 16.2.9.4. Recent Developments
- 16.2.9.5. Financials (Based on Availability)
- 16.2.10 Phibro Animal Health
- 16.2.10.1. Overview
- 16.2.10.2. Products
- 16.2.10.3. SWOT Analysis
- 16.2.10.4. Recent Developments
- 16.2.10.5. Financials (Based on Availability)
- 16.2.11 Virbac
- 16.2.11.1. Overview
- 16.2.11.2. Products
- 16.2.11.3. SWOT Analysis
- 16.2.11.4. Recent Developments
- 16.2.11.5. Financials (Based on Availability)
- 16.2.12 Merck Animal Health
- 16.2.12.1. Overview
- 16.2.12.2. Products
- 16.2.12.3. SWOT Analysis
- 16.2.12.4. Recent Developments
- 16.2.12.5. Financials (Based on Availability)
- 16.2.1 Zoetis Services LLC
List of Figures
- Figure 1: Global Veterinary Services Industry Revenue Breakdown (Million, %) by Region 2024 & 2032
- Figure 2: Global Veterinary Services Industry Volume Breakdown (K Unit, %) by Region 2024 & 2032
- Figure 3: North America Veterinary Services Industry Revenue (Million), by Country 2024 & 2032
- Figure 4: North America Veterinary Services Industry Volume (K Unit), by Country 2024 & 2032
- Figure 5: North America Veterinary Services Industry Revenue Share (%), by Country 2024 & 2032
- Figure 6: North America Veterinary Services Industry Volume Share (%), by Country 2024 & 2032
- Figure 7: Europe Veterinary Services Industry Revenue (Million), by Country 2024 & 2032
- Figure 8: Europe Veterinary Services Industry Volume (K Unit), by Country 2024 & 2032
- Figure 9: Europe Veterinary Services Industry Revenue Share (%), by Country 2024 & 2032
- Figure 10: Europe Veterinary Services Industry Volume Share (%), by Country 2024 & 2032
- Figure 11: Asia Pacific Veterinary Services Industry Revenue (Million), by Country 2024 & 2032
- Figure 12: Asia Pacific Veterinary Services Industry Volume (K Unit), by Country 2024 & 2032
- Figure 13: Asia Pacific Veterinary Services Industry Revenue Share (%), by Country 2024 & 2032
- Figure 14: Asia Pacific Veterinary Services Industry Volume Share (%), by Country 2024 & 2032
- Figure 15: Middle East and Africa Veterinary Services Industry Revenue (Million), by Country 2024 & 2032
- Figure 16: Middle East and Africa Veterinary Services Industry Volume (K Unit), by Country 2024 & 2032
- Figure 17: Middle East and Africa Veterinary Services Industry Revenue Share (%), by Country 2024 & 2032
- Figure 18: Middle East and Africa Veterinary Services Industry Volume Share (%), by Country 2024 & 2032
- Figure 19: South America Veterinary Services Industry Revenue (Million), by Country 2024 & 2032
- Figure 20: South America Veterinary Services Industry Volume (K Unit), by Country 2024 & 2032
- Figure 21: South America Veterinary Services Industry Revenue Share (%), by Country 2024 & 2032
- Figure 22: South America Veterinary Services Industry Volume Share (%), by Country 2024 & 2032
- Figure 23: North America Veterinary Services Industry Revenue (Million), by Animal Type 2024 & 2032
- Figure 24: North America Veterinary Services Industry Volume (K Unit), by Animal Type 2024 & 2032
- Figure 25: North America Veterinary Services Industry Revenue Share (%), by Animal Type 2024 & 2032
- Figure 26: North America Veterinary Services Industry Volume Share (%), by Animal Type 2024 & 2032
- Figure 27: North America Veterinary Services Industry Revenue (Million), by Type of Care 2024 & 2032
- Figure 28: North America Veterinary Services Industry Volume (K Unit), by Type of Care 2024 & 2032
- Figure 29: North America Veterinary Services Industry Revenue Share (%), by Type of Care 2024 & 2032
- Figure 30: North America Veterinary Services Industry Volume Share (%), by Type of Care 2024 & 2032
- Figure 31: North America Veterinary Services Industry Revenue (Million), by Country 2024 & 2032
- Figure 32: North America Veterinary Services Industry Volume (K Unit), by Country 2024 & 2032
- Figure 33: North America Veterinary Services Industry Revenue Share (%), by Country 2024 & 2032
- Figure 34: North America Veterinary Services Industry Volume Share (%), by Country 2024 & 2032
- Figure 35: Europe Veterinary Services Industry Revenue (Million), by Animal Type 2024 & 2032
- Figure 36: Europe Veterinary Services Industry Volume (K Unit), by Animal Type 2024 & 2032
- Figure 37: Europe Veterinary Services Industry Revenue Share (%), by Animal Type 2024 & 2032
- Figure 38: Europe Veterinary Services Industry Volume Share (%), by Animal Type 2024 & 2032
- Figure 39: Europe Veterinary Services Industry Revenue (Million), by Type of Care 2024 & 2032
- Figure 40: Europe Veterinary Services Industry Volume (K Unit), by Type of Care 2024 & 2032
- Figure 41: Europe Veterinary Services Industry Revenue Share (%), by Type of Care 2024 & 2032
- Figure 42: Europe Veterinary Services Industry Volume Share (%), by Type of Care 2024 & 2032
- Figure 43: Europe Veterinary Services Industry Revenue (Million), by Country 2024 & 2032
- Figure 44: Europe Veterinary Services Industry Volume (K Unit), by Country 2024 & 2032
- Figure 45: Europe Veterinary Services Industry Revenue Share (%), by Country 2024 & 2032
- Figure 46: Europe Veterinary Services Industry Volume Share (%), by Country 2024 & 2032
- Figure 47: Asia Pacific Veterinary Services Industry Revenue (Million), by Animal Type 2024 & 2032
- Figure 48: Asia Pacific Veterinary Services Industry Volume (K Unit), by Animal Type 2024 & 2032
- Figure 49: Asia Pacific Veterinary Services Industry Revenue Share (%), by Animal Type 2024 & 2032
- Figure 50: Asia Pacific Veterinary Services Industry Volume Share (%), by Animal Type 2024 & 2032
- Figure 51: Asia Pacific Veterinary Services Industry Revenue (Million), by Type of Care 2024 & 2032
- Figure 52: Asia Pacific Veterinary Services Industry Volume (K Unit), by Type of Care 2024 & 2032
- Figure 53: Asia Pacific Veterinary Services Industry Revenue Share (%), by Type of Care 2024 & 2032
- Figure 54: Asia Pacific Veterinary Services Industry Volume Share (%), by Type of Care 2024 & 2032
- Figure 55: Asia Pacific Veterinary Services Industry Revenue (Million), by Country 2024 & 2032
- Figure 56: Asia Pacific Veterinary Services Industry Volume (K Unit), by Country 2024 & 2032
- Figure 57: Asia Pacific Veterinary Services Industry Revenue Share (%), by Country 2024 & 2032
- Figure 58: Asia Pacific Veterinary Services Industry Volume Share (%), by Country 2024 & 2032
- Figure 59: Middle East and Africa Veterinary Services Industry Revenue (Million), by Animal Type 2024 & 2032
- Figure 60: Middle East and Africa Veterinary Services Industry Volume (K Unit), by Animal Type 2024 & 2032
- Figure 61: Middle East and Africa Veterinary Services Industry Revenue Share (%), by Animal Type 2024 & 2032
- Figure 62: Middle East and Africa Veterinary Services Industry Volume Share (%), by Animal Type 2024 & 2032
- Figure 63: Middle East and Africa Veterinary Services Industry Revenue (Million), by Type of Care 2024 & 2032
- Figure 64: Middle East and Africa Veterinary Services Industry Volume (K Unit), by Type of Care 2024 & 2032
- Figure 65: Middle East and Africa Veterinary Services Industry Revenue Share (%), by Type of Care 2024 & 2032
- Figure 66: Middle East and Africa Veterinary Services Industry Volume Share (%), by Type of Care 2024 & 2032
- Figure 67: Middle East and Africa Veterinary Services Industry Revenue (Million), by Country 2024 & 2032
- Figure 68: Middle East and Africa Veterinary Services Industry Volume (K Unit), by Country 2024 & 2032
- Figure 69: Middle East and Africa Veterinary Services Industry Revenue Share (%), by Country 2024 & 2032
- Figure 70: Middle East and Africa Veterinary Services Industry Volume Share (%), by Country 2024 & 2032
- Figure 71: South America Veterinary Services Industry Revenue (Million), by Animal Type 2024 & 2032
- Figure 72: South America Veterinary Services Industry Volume (K Unit), by Animal Type 2024 & 2032
- Figure 73: South America Veterinary Services Industry Revenue Share (%), by Animal Type 2024 & 2032
- Figure 74: South America Veterinary Services Industry Volume Share (%), by Animal Type 2024 & 2032
- Figure 75: South America Veterinary Services Industry Revenue (Million), by Type of Care 2024 & 2032
- Figure 76: South America Veterinary Services Industry Volume (K Unit), by Type of Care 2024 & 2032
- Figure 77: South America Veterinary Services Industry Revenue Share (%), by Type of Care 2024 & 2032
- Figure 78: South America Veterinary Services Industry Volume Share (%), by Type of Care 2024 & 2032
- Figure 79: South America Veterinary Services Industry Revenue (Million), by Country 2024 & 2032
- Figure 80: South America Veterinary Services Industry Volume (K Unit), by Country 2024 & 2032
- Figure 81: South America Veterinary Services Industry Revenue Share (%), by Country 2024 & 2032
- Figure 82: South America Veterinary Services Industry Volume Share (%), by Country 2024 & 2032
List of Tables
- Table 1: Global Veterinary Services Industry Revenue Million Forecast, by Region 2019 & 2032
- Table 2: Global Veterinary Services Industry Volume K Unit Forecast, by Region 2019 & 2032
- Table 3: Global Veterinary Services Industry Revenue Million Forecast, by Animal Type 2019 & 2032
- Table 4: Global Veterinary Services Industry Volume K Unit Forecast, by Animal Type 2019 & 2032
- Table 5: Global Veterinary Services Industry Revenue Million Forecast, by Type of Care 2019 & 2032
- Table 6: Global Veterinary Services Industry Volume K Unit Forecast, by Type of Care 2019 & 2032
- Table 7: Global Veterinary Services Industry Revenue Million Forecast, by Region 2019 & 2032
- Table 8: Global Veterinary Services Industry Volume K Unit Forecast, by Region 2019 & 2032
- Table 9: Global Veterinary Services Industry Revenue Million Forecast, by Country 2019 & 2032
- Table 10: Global Veterinary Services Industry Volume K Unit Forecast, by Country 2019 & 2032
- Table 11: United States Veterinary Services Industry Revenue (Million) Forecast, by Application 2019 & 2032
- Table 12: United States Veterinary Services Industry Volume (K Unit) Forecast, by Application 2019 & 2032
- Table 13: Canada Veterinary Services Industry Revenue (Million) Forecast, by Application 2019 & 2032
- Table 14: Canada Veterinary Services Industry Volume (K Unit) Forecast, by Application 2019 & 2032
- Table 15: Mexico Veterinary Services Industry Revenue (Million) Forecast, by Application 2019 & 2032
- Table 16: Mexico Veterinary Services Industry Volume (K Unit) Forecast, by Application 2019 & 2032
- Table 17: Global Veterinary Services Industry Revenue Million Forecast, by Country 2019 & 2032
- Table 18: Global Veterinary Services Industry Volume K Unit Forecast, by Country 2019 & 2032
- Table 19: Germany Veterinary Services Industry Revenue (Million) Forecast, by Application 2019 & 2032
- Table 20: Germany Veterinary Services Industry Volume (K Unit) Forecast, by Application 2019 & 2032
- Table 21: United Kingdom Veterinary Services Industry Revenue (Million) Forecast, by Application 2019 & 2032
- Table 22: United Kingdom Veterinary Services Industry Volume (K Unit) Forecast, by Application 2019 & 2032
- Table 23: France Veterinary Services Industry Revenue (Million) Forecast, by Application 2019 & 2032
- Table 24: France Veterinary Services Industry Volume (K Unit) Forecast, by Application 2019 & 2032
- Table 25: Italy Veterinary Services Industry Revenue (Million) Forecast, by Application 2019 & 2032
- Table 26: Italy Veterinary Services Industry Volume (K Unit) Forecast, by Application 2019 & 2032
- Table 27: Spain Veterinary Services Industry Revenue (Million) Forecast, by Application 2019 & 2032
- Table 28: Spain Veterinary Services Industry Volume (K Unit) Forecast, by Application 2019 & 2032
- Table 29: Rest of Europe Veterinary Services Industry Revenue (Million) Forecast, by Application 2019 & 2032
- Table 30: Rest of Europe Veterinary Services Industry Volume (K Unit) Forecast, by Application 2019 & 2032
- Table 31: Global Veterinary Services Industry Revenue Million Forecast, by Country 2019 & 2032
- Table 32: Global Veterinary Services Industry Volume K Unit Forecast, by Country 2019 & 2032
- Table 33: China Veterinary Services Industry Revenue (Million) Forecast, by Application 2019 & 2032
- Table 34: China Veterinary Services Industry Volume (K Unit) Forecast, by Application 2019 & 2032
- Table 35: Japan Veterinary Services Industry Revenue (Million) Forecast, by Application 2019 & 2032
- Table 36: Japan Veterinary Services Industry Volume (K Unit) Forecast, by Application 2019 & 2032
- Table 37: India Veterinary Services Industry Revenue (Million) Forecast, by Application 2019 & 2032
- Table 38: India Veterinary Services Industry Volume (K Unit) Forecast, by Application 2019 & 2032
- Table 39: Australia Veterinary Services Industry Revenue (Million) Forecast, by Application 2019 & 2032
- Table 40: Australia Veterinary Services Industry Volume (K Unit) Forecast, by Application 2019 & 2032
- Table 41: South Korea Veterinary Services Industry Revenue (Million) Forecast, by Application 2019 & 2032
- Table 42: South Korea Veterinary Services Industry Volume (K Unit) Forecast, by Application 2019 & 2032
- Table 43: Rest of Asia Pacific Veterinary Services Industry Revenue (Million) Forecast, by Application 2019 & 2032
- Table 44: Rest of Asia Pacific Veterinary Services Industry Volume (K Unit) Forecast, by Application 2019 & 2032
- Table 45: Global Veterinary Services Industry Revenue Million Forecast, by Country 2019 & 2032
- Table 46: Global Veterinary Services Industry Volume K Unit Forecast, by Country 2019 & 2032
- Table 47: GCC Veterinary Services Industry Revenue (Million) Forecast, by Application 2019 & 2032
- Table 48: GCC Veterinary Services Industry Volume (K Unit) Forecast, by Application 2019 & 2032
- Table 49: South Africa Veterinary Services Industry Revenue (Million) Forecast, by Application 2019 & 2032
- Table 50: South Africa Veterinary Services Industry Volume (K Unit) Forecast, by Application 2019 & 2032
- Table 51: Rest of Middle East and Africa Veterinary Services Industry Revenue (Million) Forecast, by Application 2019 & 2032
- Table 52: Rest of Middle East and Africa Veterinary Services Industry Volume (K Unit) Forecast, by Application 2019 & 2032
- Table 53: Global Veterinary Services Industry Revenue Million Forecast, by Country 2019 & 2032
- Table 54: Global Veterinary Services Industry Volume K Unit Forecast, by Country 2019 & 2032
- Table 55: Brazil Veterinary Services Industry Revenue (Million) Forecast, by Application 2019 & 2032
- Table 56: Brazil Veterinary Services Industry Volume (K Unit) Forecast, by Application 2019 & 2032
- Table 57: Argentina Veterinary Services Industry Revenue (Million) Forecast, by Application 2019 & 2032
- Table 58: Argentina Veterinary Services Industry Volume (K Unit) Forecast, by Application 2019 & 2032
- Table 59: Rest of South America Veterinary Services Industry Revenue (Million) Forecast, by Application 2019 & 2032
- Table 60: Rest of South America Veterinary Services Industry Volume (K Unit) Forecast, by Application 2019 & 2032
- Table 61: Global Veterinary Services Industry Revenue Million Forecast, by Animal Type 2019 & 2032
- Table 62: Global Veterinary Services Industry Volume K Unit Forecast, by Animal Type 2019 & 2032
- Table 63: Global Veterinary Services Industry Revenue Million Forecast, by Type of Care 2019 & 2032
- Table 64: Global Veterinary Services Industry Volume K Unit Forecast, by Type of Care 2019 & 2032
- Table 65: Global Veterinary Services Industry Revenue Million Forecast, by Country 2019 & 2032
- Table 66: Global Veterinary Services Industry Volume K Unit Forecast, by Country 2019 & 2032
- Table 67: United States Veterinary Services Industry Revenue (Million) Forecast, by Application 2019 & 2032
- Table 68: United States Veterinary Services Industry Volume (K Unit) Forecast, by Application 2019 & 2032
- Table 69: Canada Veterinary Services Industry Revenue (Million) Forecast, by Application 2019 & 2032
- Table 70: Canada Veterinary Services Industry Volume (K Unit) Forecast, by Application 2019 & 2032
- Table 71: Mexico Veterinary Services Industry Revenue (Million) Forecast, by Application 2019 & 2032
- Table 72: Mexico Veterinary Services Industry Volume (K Unit) Forecast, by Application 2019 & 2032
- Table 73: Global Veterinary Services Industry Revenue Million Forecast, by Animal Type 2019 & 2032
- Table 74: Global Veterinary Services Industry Volume K Unit Forecast, by Animal Type 2019 & 2032
- Table 75: Global Veterinary Services Industry Revenue Million Forecast, by Type of Care 2019 & 2032
- Table 76: Global Veterinary Services Industry Volume K Unit Forecast, by Type of Care 2019 & 2032
- Table 77: Global Veterinary Services Industry Revenue Million Forecast, by Country 2019 & 2032
- Table 78: Global Veterinary Services Industry Volume K Unit Forecast, by Country 2019 & 2032
- Table 79: Germany Veterinary Services Industry Revenue (Million) Forecast, by Application 2019 & 2032
- Table 80: Germany Veterinary Services Industry Volume (K Unit) Forecast, by Application 2019 & 2032
- Table 81: United Kingdom Veterinary Services Industry Revenue (Million) Forecast, by Application 2019 & 2032
- Table 82: United Kingdom Veterinary Services Industry Volume (K Unit) Forecast, by Application 2019 & 2032
- Table 83: France Veterinary Services Industry Revenue (Million) Forecast, by Application 2019 & 2032
- Table 84: France Veterinary Services Industry Volume (K Unit) Forecast, by Application 2019 & 2032
- Table 85: Italy Veterinary Services Industry Revenue (Million) Forecast, by Application 2019 & 2032
- Table 86: Italy Veterinary Services Industry Volume (K Unit) Forecast, by Application 2019 & 2032
- Table 87: Spain Veterinary Services Industry Revenue (Million) Forecast, by Application 2019 & 2032
- Table 88: Spain Veterinary Services Industry Volume (K Unit) Forecast, by Application 2019 & 2032
- Table 89: Rest of Europe Veterinary Services Industry Revenue (Million) Forecast, by Application 2019 & 2032
- Table 90: Rest of Europe Veterinary Services Industry Volume (K Unit) Forecast, by Application 2019 & 2032
- Table 91: Global Veterinary Services Industry Revenue Million Forecast, by Animal Type 2019 & 2032
- Table 92: Global Veterinary Services Industry Volume K Unit Forecast, by Animal Type 2019 & 2032
- Table 93: Global Veterinary Services Industry Revenue Million Forecast, by Type of Care 2019 & 2032
- Table 94: Global Veterinary Services Industry Volume K Unit Forecast, by Type of Care 2019 & 2032
- Table 95: Global Veterinary Services Industry Revenue Million Forecast, by Country 2019 & 2032
- Table 96: Global Veterinary Services Industry Volume K Unit Forecast, by Country 2019 & 2032
- Table 97: China Veterinary Services Industry Revenue (Million) Forecast, by Application 2019 & 2032
- Table 98: China Veterinary Services Industry Volume (K Unit) Forecast, by Application 2019 & 2032
- Table 99: Japan Veterinary Services Industry Revenue (Million) Forecast, by Application 2019 & 2032
- Table 100: Japan Veterinary Services Industry Volume (K Unit) Forecast, by Application 2019 & 2032
- Table 101: India Veterinary Services Industry Revenue (Million) Forecast, by Application 2019 & 2032
- Table 102: India Veterinary Services Industry Volume (K Unit) Forecast, by Application 2019 & 2032
- Table 103: Australia Veterinary Services Industry Revenue (Million) Forecast, by Application 2019 & 2032
- Table 104: Australia Veterinary Services Industry Volume (K Unit) Forecast, by Application 2019 & 2032
- Table 105: South Korea Veterinary Services Industry Revenue (Million) Forecast, by Application 2019 & 2032
- Table 106: South Korea Veterinary Services Industry Volume (K Unit) Forecast, by Application 2019 & 2032
- Table 107: Rest of Asia Pacific Veterinary Services Industry Revenue (Million) Forecast, by Application 2019 & 2032
- Table 108: Rest of Asia Pacific Veterinary Services Industry Volume (K Unit) Forecast, by Application 2019 & 2032
- Table 109: Global Veterinary Services Industry Revenue Million Forecast, by Animal Type 2019 & 2032
- Table 110: Global Veterinary Services Industry Volume K Unit Forecast, by Animal Type 2019 & 2032
- Table 111: Global Veterinary Services Industry Revenue Million Forecast, by Type of Care 2019 & 2032
- Table 112: Global Veterinary Services Industry Volume K Unit Forecast, by Type of Care 2019 & 2032
- Table 113: Global Veterinary Services Industry Revenue Million Forecast, by Country 2019 & 2032
- Table 114: Global Veterinary Services Industry Volume K Unit Forecast, by Country 2019 & 2032
- Table 115: GCC Veterinary Services Industry Revenue (Million) Forecast, by Application 2019 & 2032
- Table 116: GCC Veterinary Services Industry Volume (K Unit) Forecast, by Application 2019 & 2032
- Table 117: South Africa Veterinary Services Industry Revenue (Million) Forecast, by Application 2019 & 2032
- Table 118: South Africa Veterinary Services Industry Volume (K Unit) Forecast, by Application 2019 & 2032
- Table 119: Rest of Middle East and Africa Veterinary Services Industry Revenue (Million) Forecast, by Application 2019 & 2032
- Table 120: Rest of Middle East and Africa Veterinary Services Industry Volume (K Unit) Forecast, by Application 2019 & 2032
- Table 121: Global Veterinary Services Industry Revenue Million Forecast, by Animal Type 2019 & 2032
- Table 122: Global Veterinary Services Industry Volume K Unit Forecast, by Animal Type 2019 & 2032
- Table 123: Global Veterinary Services Industry Revenue Million Forecast, by Type of Care 2019 & 2032
- Table 124: Global Veterinary Services Industry Volume K Unit Forecast, by Type of Care 2019 & 2032
- Table 125: Global Veterinary Services Industry Revenue Million Forecast, by Country 2019 & 2032
- Table 126: Global Veterinary Services Industry Volume K Unit Forecast, by Country 2019 & 2032
- Table 127: Brazil Veterinary Services Industry Revenue (Million) Forecast, by Application 2019 & 2032
- Table 128: Brazil Veterinary Services Industry Volume (K Unit) Forecast, by Application 2019 & 2032
- Table 129: Argentina Veterinary Services Industry Revenue (Million) Forecast, by Application 2019 & 2032
- Table 130: Argentina Veterinary Services Industry Volume (K Unit) Forecast, by Application 2019 & 2032
- Table 131: Rest of South America Veterinary Services Industry Revenue (Million) Forecast, by Application 2019 & 2032
- Table 132: Rest of South America Veterinary Services Industry Volume (K Unit) Forecast, by Application 2019 & 2032
Frequently Asked Questions
1. What is the projected Compound Annual Growth Rate (CAGR) of the Veterinary Services Industry?
The projected CAGR is approximately 5.59%.
2. Which companies are prominent players in the Veterinary Services Industry?
Key companies in the market include Zoetis Services LLC, Elanco, Boehringer Ingelheim GmbH, IDEXX Laboratories Inc, Indian Immunologicals Ltd, Vetoquinol S A, Hester Bioscience, Heska Corp, Ceva Sant Animale, Phibro Animal Health, Virbac, Merck Animal Health.
3. What are the main segments of the Veterinary Services Industry?
The market segments include Animal Type, Type of Care.
4. Can you provide details about the market size?
The market size is estimated to be USD 88.22 Million as of 2022.
5. What are some drivers contributing to market growth?
Rising Chronic Diseases and Awareness Regarding Veterinary Care; Increasing Initiatives by Governments and Animal Welfare Associations in Different Countries.
6. What are the notable trends driving market growth?
Companion Animal Segment is Expected to Hold Significant Market Share in the Market Over the Forecast Period.
7. Are there any restraints impacting market growth?
Increasing Costs of Animal Care Product and Veterinary Services.
8. Can you provide examples of recent developments in the market?
April 2022: Animalcare launched Plaqtiv+, a range of dental care products for cats and dogs designed to reduce calculus formation.
9. What pricing options are available for accessing the report?
Pricing options include single-user, multi-user, and enterprise licenses priced at USD 4750, USD 5250, and USD 8750 respectively.
10. Is the market size provided in terms of value or volume?
The market size is provided in terms of value, measured in Million and volume, measured in K Unit.
11. Are there any specific market keywords associated with the report?
Yes, the market keyword associated with the report is "Veterinary Services Industry," which aids in identifying and referencing the specific market segment covered.
12. How do I determine which pricing option suits my needs best?
The pricing options vary based on user requirements and access needs. Individual users may opt for single-user licenses, while businesses requiring broader access may choose multi-user or enterprise licenses for cost-effective access to the report.
13. Are there any additional resources or data provided in the Veterinary Services Industry report?
While the report offers comprehensive insights, it's advisable to review the specific contents or supplementary materials provided to ascertain if additional resources or data are available.
14. How can I stay updated on further developments or reports in the Veterinary Services Industry?
To stay informed about further developments, trends, and reports in the Veterinary Services Industry, consider subscribing to industry newsletters, following relevant companies and organizations, or regularly checking reputable industry news sources and publications.
Methodology
Step 1 - Identification of Relevant Samples Size from Population Database


Step 2 - Approaches for Defining Global Market Size (Value, Volume* & Price*)

Note*: In applicable scenarios
Step 3 - Data Sources
Primary Research
- Web Analytics
- Survey Reports
- Research Institute
- Latest Research Reports
- Opinion Leaders
Secondary Research
- Annual Reports
- White Paper
- Latest Press Release
- Industry Association
- Paid Database
- Investor Presentations

Step 4 - Data Triangulation
Involves using different sources of information in order to increase the validity of a study
These sources are likely to be stakeholders in a program - participants, other researchers, program staff, other community members, and so on.
Then we put all data in single framework & apply various statistical tools to find out the dynamic on the market.
During the analysis stage, feedback from the stakeholder groups would be compared to determine areas of agreement as well as areas of divergence
